You are not logged in.
This means you
CAN ONLY VIEW reports that were published prior to Monday, April 14, 2025.
You
MUST UPGRADE YOUR MEMBERSHIP if you want to see any current reports.
AFTER MARKET UPDATE - THURSDAY, FEBRUARY 11TH, 2010
Previous After Market Report Next After Market Report >>>
|
|
|
|
DOW |
+105.81 |
10,144.19 |
+1.05% |
|
Volume |
1,071,002,730 |
+6% |
|
Volume |
2,165,277,500 |
+6% |
|
NASDAQ |
+29.54 |
2,177.41 |
+1.38% |
|
Advancers |
2,329 |
74% |
|
Advancers |
1,993 |
71% |
|
S&P 500 |
+10.34 |
1,078.47 |
+0.97% |
|
Decliners |
697 |
22% |
|
Decliners |
692 |
25% |
|
Russell 2000 |
+9.64 |
605.46 |
+1.62% |
|
52 Wk Highs |
54 |
|
|
52 Wk Highs |
52 |
|
|
S&P 600 |
+4.58 |
321.47 |
+1.45% |
|
52 Wk Lows |
6 |
|
|
52 Wk Lows |
16 |
|
|
 |
Small Gains For Indices Leave New Rally Unconfirmed
Adam Sarhan, Contributing Writer,
The EU said it will help Greece and stocks rallied on Thursday, but the major indices' gains were too small to meet the guidelines for a sound "follow-through day" while the volume totals were reported higher than the prior session on the NYSE and the Nasdaq exchange. Advancers led decliners by a 3-to-1 ratio on the NYSE and on the Nasdaq exchange. There were 13 high-ranked companies from the CANSLIM.net Leaders List that made a new 52-week high and appeared on the CANSLIM.net BreakOuts Page, up from the 6 issues that appeared on the prior session. New 52-week highs outnumbered new 52-week lows on the NYSE and on the Nasdaq exchange.
Stocks rallied after the European Union said it would help Greece recover from the worst economic crisis the continent has experienced since the euro was established over 11 years ago. It is important to note that Portugal and Spain's growing budget deficits have yet to be addressed, which could come back and haunt the EU later this year.
Inflation concerns eased in China after consumer prices rose less than expected in January. This helped allay fears that the Chinese central bank will continue taking aggressive steps to curb its surging economy. Domestically, the Labor Department said that weekly jobless claims unexpectedly dropped last week. The weaker than expected report is a net positive for the ailing jobs market and bodes well for the economy.
Looking at the market, as long as last Friday's lows are not breached the window remains open for a new follow-through day (FTD) to emerge. A new follow-through day will be confirmed when one of the major averages rallies at least +1.7% on higher volume than the prior session as a new batch of leaders breakout of sound bases. However, if last Friday's lows are breached then the day count will be reset and a steeper correction may unfold.
It is also important to see how the major averages react to their respective 50-day moving average (DMA) lines which were support and are now acting as resistance. Until they all close above that important level the technical damage remaining on the charts is a concern. So far, the market's reaction has been tepid at best to the latest round of economic and earnings data which remains a concern. Remember that the market remains in a correction until a new new follow-through day emerges. Until then, patience is paramount.
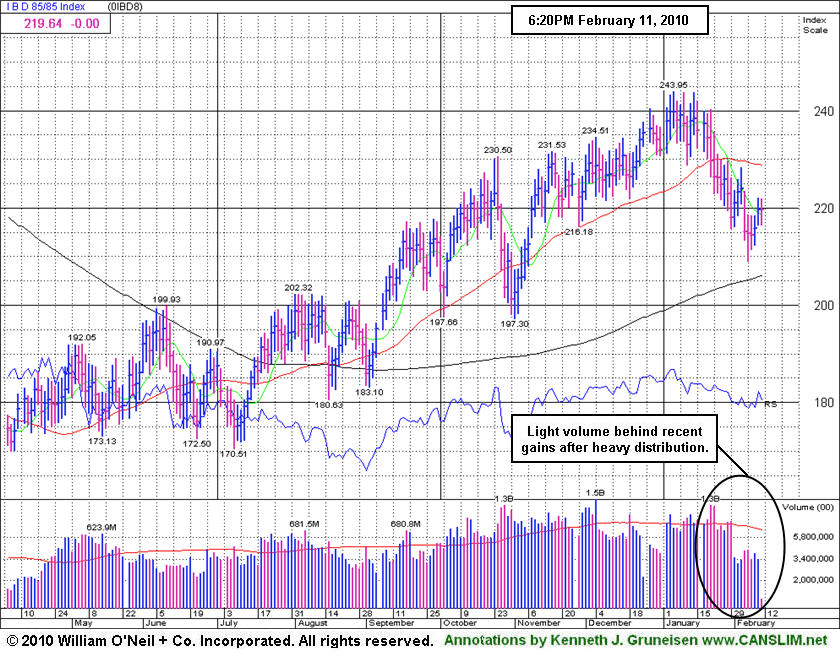
PICTURED: The IBD 85/85 Index has slumped below its 50-day moving average like all of the major averages in recent weeks. As the chart above shows, there has been light volume behind recent gains after heavy distribution caused damage. This helps illustrate the poor action in the high-ranked spectrum of stocks given greatest focus under the investment system. While this action persists, great caution is advised!
|
|
|
 |
XAU Rebounded To Close Above 200-Day Average
Kenneth J. Gruneisen - Passed the CAN SLIM® Master's Exam
Commodity-linked areas were among Thursday's strongest gainers as the Gold & Silver Index ($XAU +3.97%), Oil Services Index ($OSX +2.26%), and Integrated Oil Index ($XOI +1.81%) rose. Financial shares were exceptionally quiet as the Bank Index ($BKX +0.07%) and Broker/Dealer Index ($XBD +0.07%) were virtually unchanged. The Semiconductor Index ($SOX +2.36%) set a solid pace for the tech sector while the Internet Index ($IIX +1.52%) and Biotechnology Index ($BTK +0.94%) produced modest gains and the Networking Index ($NWX -0.26%) lagged. Gains from the Healthcare Index ($HMO +0.50%) and Retail Index ($RLX +1.10%) rounded out the mostly positive session.
Charts courtesy www.stockcharts.com
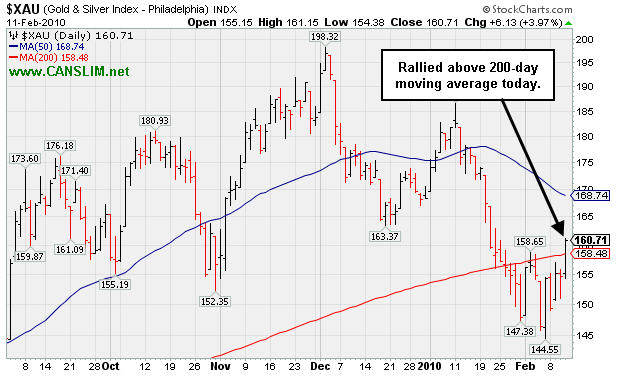
PICTURED: The Gold & Silver Index ($XAU +3.97%) rallied back above its 200-day moving average today. It fell -27.2% from its early-December peak to its February low and currently is trading -19% off its high.
| Oil Services |
$OSX |
197.47 |
+4.37 |
+2.26% |
+1.31% |
| Healthcare |
$HMO |
1,415.47 |
+7.01 |
+0.50% |
-3.90% |
| Integrated Oil |
$XOI |
1,022.18 |
+18.21 |
+1.81% |
-4.31% |
| Semiconductor |
$SOX |
331.04 |
+7.64 |
+2.36% |
-8.02% |
| Networking |
$NWX |
226.75 |
-0.58 |
-0.26% |
-1.87% |
| Internet |
$IIX |
223.01 |
+3.34 |
+1.52% |
-4.64% |
| Broker/Dealer |
$XBD |
110.76 |
+0.08 |
+0.07% |
-3.73% |
| Retail |
$RLX |
399.36 |
+4.33 |
+1.10% |
-2.86% |
| Gold & Silver |
$XAU |
160.71 |
+6.13 |
+3.97% |
-4.48% |
| Bank |
$BKX |
45.07 |
+0.03 |
+0.07% |
+5.53% |
| Biotech |
$BTK |
981.29 |
+9.12 |
+0.94% |
+4.16% |
|
|
|
 |
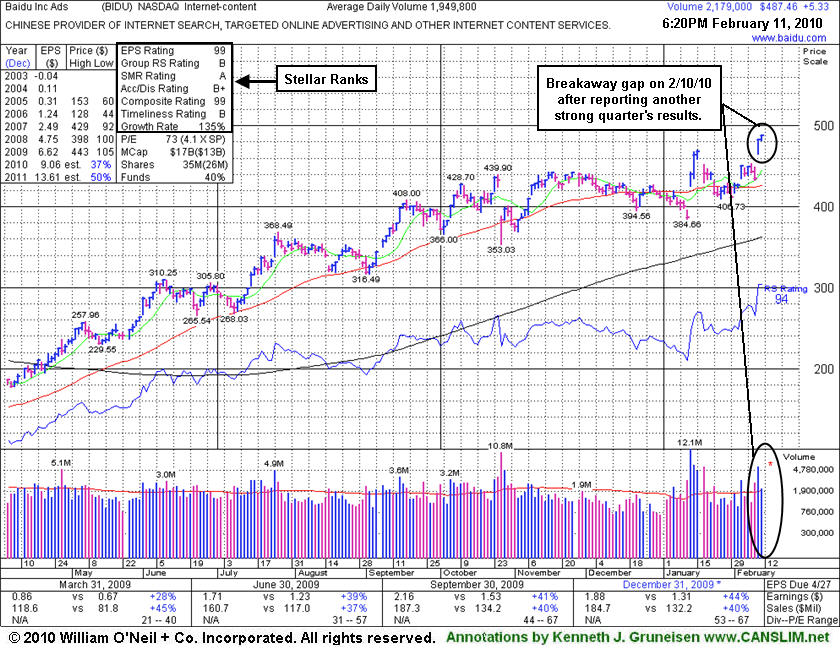
Gap To New Highs Indicated Proof Of Institutional Accumulation
Kenneth J. Gruneisen - Passed the CAN SLIM® Master's Exam
Baidu.com, Inc. (BIDU +$5.33 or +1.11% to $487.46) posted a gain today on average volume, rallying into new high ground. After reporting earnings and raising guidance it gapped up on 2/10/10 for a considerable gain and new all-time high, closing strong with volume more than 3 times average. Market conditions (M criteria of the investment system) argue against new buying efforts until a follow-through-day confirms the latest rally attempt, otherwise odds are not favorable for investors. No overhead supply exists to hinder its progress. Disciplined investors always follow all key criteria of the investment system to stack the odds of success in your favor. In a bullish market environment, many ideal buy candidates come along. Right now, disciplined investors are waiting for a new confirmed rally before initiating any new buying efforts. Meanwhile, the M criteria presents a problem, since 3 out of 4 stocks typically follow the direction of the major averages.
Within its last appearance in this FSU section on 2/03/10 under the headline "3rd Best Close Ever For Baidu.com" it was observed, "Gaps often indicate substantial institutional activity. Today's considerable gap up and close near the session high was a sign of great institutional accumulation. However, this company's chart is loaded with numerous gaps in in either direction in recent months." There was also a reminder included that the company was due to report earnings after the close on February 9th. Its 2/10/10 breakaway gap into new all-time high territory provided more compelling proof that institutional investors are accumulating the high-ranked Internet- Content firm's shares. It is very reassuring that the number of top-rated funds owning BIDU's shares rose from 103 in Dec '08 to 204 in Dec '09, solid evidence its shares were being accumulated by the institutional (I criteria) crowd.
It has a stellar sales and earnings history that satisfies the C & A criteria. However it has not formed any recent sound base and is extended from an earlier "double bottom" base pattern that was identified based upon its December low and January's lower low. Technically it triggered a technical buy signal and was featured in yellow on 1/13/10 as it cleared the 12/29/09 high mentioned in the 1/12/10 note. (See the "view all notes" links to review prior analysis on any stock.)
|
|
|
Color Codes Explained :
Y - Better candidates highlighted by our
staff of experts.
G - Previously featured
in past reports as yellow but may no longer be buyable under the
guidelines.
***Last / Change / Volume quote data in this table corresponds with the timestamp on the note***
Symbol/Exchange
Company Name
Industry Group |
Last |
Chg. |
Vol
% DAV |
Date Featured |
Price Featured |
Latest Pivot Point
Featured |
Status |
| Latest Max Buy Price |
ARST
-
|
$25.54
|
+0.81
|
225,751
46% DAV
490,100
|
12/22/2009
(Date
Featured) |
$25.94
(Price
Featured) |
PP = $27.20 |
G |
| MB = $28.56 |
Most Recent Note - 2/11/2010 5:46:46 PM
G - Gain today with below average volume helped it rally and close above its 50 DMA line, technically helping its outlook improve. Important support to watch now is its recent low ($22.58) and prior chart lows in the $22 area. ARST was first featured in yellow at $19.91 in the 9/01/09 mid-day report with an annotated daily graph (read here).
>>> The latest Featured Stock Update with an annotated graph appeared on 2/4/2010. click here.
|
|
C
A
S
I |
News |
Chart |
SEC
View all notes Alert
me of new notes
Company
Profile
|
BIDU
- NASDAQ
Baidu Inc Ads
INTERNET - Internet Information Providers
|
$487.46
|
+5.33
|
2,191,487
112% DAV
1,949,800
|
1/13/2010
(Date
Featured) |
$431.25
(Price
Featured) |
PP = $426.75 |
G |
| MB = $448.09 |
Most Recent Note - 2/11/2010 5:48:01 PM
G - Gain today on average volume, rallying into new high ground. After reporting earnings and raising guidance it gapped up on 2/10/10 for a considerable gain and new all-time high, closing strong with volume more than 3 times average. Market conditions (M criteria of the investment system) argue against new buying efforts until a follow-through-day confirms the latest rally attempt, otherwise odds are not favorable for investors. No overhead supply exists to hinder its progress.
>>> The latest Featured Stock Update with an annotated graph appeared on 2/11/2010. click here.
|
|
C
A
S
I |
News |
Chart |
SEC
View all notes Alert
me of new notes
Company
Profile
|
CACC
- NASDAQ
Credit Acceptance Corp
FINANCIAL SERVICES - Credit Services
|
$40.19
|
+1.19
|
55,931
89% DAV
63,000
|
9/29/2009
(Date
Featured) |
$33.48
(Price
Featured) |
PP = $37.10 |
G |
| MB = $38.96 |
Most Recent Note - 2/11/2010 5:49:28 PM
G - Small gain today with below average volume following 8 consecutive losses. Prior chart highs in the $37 area may act as support. Concerns were recently raised and sell signals triggered when this high-ranked Financial firm violated its 50 DMA line.
>>> The latest Featured Stock Update with an annotated graph appeared on 2/9/2010. click here.
|
|
C
A
S
I |
News |
Chart |
SEC
View all notes Alert
me of new notes
Company
Profile
|
CRM
- NYSE
Salesforce.com Inc
INTERNET - Internet Software & Services
|
$65.96
|
+1.23
|
1,612,128
87% DAV
1,858,600
|
12/18/2009
(Date
Featured) |
$67.32
(Price
Featured) |
PP = $67.82 |
G |
| MB = $71.21 |
Most Recent Note - 2/11/2010 6:10:05 PM
G - Gain today was its 4th consecutive gain on near average volume, but a rebound back above its 50 DMA line is still needed for its outlook to improve. Technically, the recent chart low ($60.30 on 2/05/10) is an important support level to watch.
>>> The latest Featured Stock Update with an annotated graph appeared on 2/10/2010. click here.
|
|
C
A
S
I |
News |
Chart |
SEC
View all notes Alert
me of new notes
Company
Profile
|
GMCR
- NASDAQ
Green Mtn Coffee Roastrs
FOOD & BEVERAGE - Processed & Packaged Goods
|
$83.02
|
+0.49
|
1,004,025
66% DAV
1,520,500
|
12/28/2009
(Date
Featured) |
$77.49
(Price
Featured) |
PP = $76.50 |
G |
| MB = $80.33 |
Most Recent Note - 2/11/2010 6:15:15 PM
G - Quietly consolidating in a fairly tight trading range above its 50 DMA line and within close striking range of its 52-week high. Important initial support level to watch is recent lows in the $78 area.
>>> The latest Featured Stock Update with an annotated graph appeared on 2/2/2010. click here.
|
|
C
A
S
I |
News |
Chart |
SEC
View all notes Alert
me of new notes
Company
Profile
|
ISRG
- NASDAQ
Intuitive Surgical Inc
HEALTH SERVICES - Medical Appliances & Equipment
|
$329.77
|
+7.82
|
421,486
82% DAV
514,000
|
1/22/2010
(Date
Featured) |
$340.40
(Price
Featured) |
PP = $314.00 |
G |
| MB = $329.70 |
Most Recent Note - 2/11/2010 6:16:55 PM
G -Closed near the session high with a gain on below average volume today. Consolidating above its 50 DMA line and prior chart highs in the $314 area that define important technical support. ISRG was featured again most recently in the 1/22/10 mid-day report (read here).
>>> The latest Featured Stock Update with an annotated graph appeared on 2/5/2010. click here.
|
|
C
A
S
I |
News |
Chart |
SEC
View all notes Alert
me of new notes
Company
Profile
|
PEGA
- NASDAQ
Pegasystems Inc
COMPUTER SOFTWARE & SERVICES - Business Software & Services
|
$35.79
|
+0.52
|
127,949
65% DAV
196,800
|
1/4/2010
(Date
Featured) |
$34.00
(Price
Featured) |
PP = $36.19 |
G |
| MB = $38.00 |
Most Recent Note - 2/11/2010 6:18:18 PM
G - Closed near the session high with a gain on below average volume today. Consolidating in the $35-36 area that was a previously a stubborn resistance level. It remains in healthy shape above its 50 DMA line, but wider than usual intra-day price swings with higher volume in the prior 2 weeks with distributional action raised concerns.
>>> The latest Featured Stock Update with an annotated graph appeared on 2/8/2010. click here.
|
|
C
A
S
I |
News |
Chart |
SEC
View all notes Alert
me of new notes
Company
Profile
|
|
|
|
THESE ARE NOT BUY RECOMMENDATIONS!
Comments contained in the body of this report are technical
opinions only. The material herein has been obtained
from sources believed to be reliable and accurate, however,
its accuracy and completeness cannot be guaranteed.
This site is not an investment advisor, hence it does
not endorse or recommend any securities or other investments.
Any recommendation contained in this report may not
be suitable for all investors and it is not to be deemed
an offer or solicitation on our part with respect to
the purchase or sale of any securities. All trademarks,
service marks and trade names appearing in this report
are the property of their respective owners, and are
likewise used for identification purposes only.
This report is a service available
only to active Paid Premium Members.
You may opt-out of receiving report notifications
at any time. Questions or comments may be submitted
by writing to Premium Membership Services 665 S.E. 10 Street, Suite 201 Deerfield Beach, FL 33441-5634 or by calling 1-800-965-8307
or 954-785-1121.
|
|
|


