You are not logged in.
This means you
CAN ONLY VIEW reports that were published prior to Monday, April 14, 2025.
You
MUST UPGRADE YOUR MEMBERSHIP if you want to see any current reports.
AFTER MARKET UPDATE - WEDNESDAY, FEBRUARY 10TH, 2010
Previous After Market Report Next After Market Report >>>
|
|
|
|
DOW |
-20.26 |
10,038.38 |
-0.20% |
|
Volume |
1,008,529,600 |
-19% |
|
Volume |
2,051,021,410 |
-8% |
|
NASDAQ |
-3.00 |
2,147.87 |
-0.14% |
|
Advancers |
1,501 |
48% |
|
Advancers |
1,304 |
47% |
|
S&P 500 |
-2.39 |
1,068.13 |
-0.22% |
|
Decliners |
1,511 |
48% |
|
Decliners |
1,320 |
48% |
|
Russell 2000 |
+0.65 |
595.82 |
+0.11% |
|
52 Wk Highs |
50 |
|
|
52 Wk Highs |
25 |
|
|
S&P 600 |
+0.77 |
316.89 |
+0.24% |
|
52 Wk Lows |
10 |
|
|
52 Wk Lows |
18 |
|
|
 |
Leadership Lacking As Indices End Day 4 With Light Volume Losses
Adam Sarhan, Contributing Writer,
Stocks closed lower amid speculation that the European Union will not bail out Greece. Volume was reported lower than the prior session on the NYSE and the Nasdaq exchange. Decliners and advancers were evenly mixed on both major exchanges. There were 6 high-ranked companies from the CANSLIM.net Leaders List that made a new 52-week high and appeared on the CANSLIM.net BreakOuts Page, down from the 9 issues that appeared on the prior session. New 52-week highs outnumbered new 52-week lows on the NYSE and on the Nasdaq exchange.
Stocks spent the session trading between positive and negative territory as Germany and France discussed plans on helping their troubled neighbors and the latest comments from Federal Reserve Chairman Ben S. Bernanke on how the Fed plans on raising rates. European Union leaders are slated to meet in Brussels on Thursday to discuss a workable solution to the ballooning debt crisis. Analysts believe that the EU will ask Greece to continue trimming their over-sized budget but will stop short of offering a full bailout package. Greek citizens flocked to the streets, protested and were on strike as the country falls deeper into debt. The massive protests shut down schools, hospitals and flights in response to government plans to freeze wages and cut benefits as the nation tries to reduce the largest deficit in the EU. Elsewhere, Bernanke said that he plans to raise interest rates "before long” which put rate hikes back on the table for 2010.
On the earnings front, so far, over 330 companies in the S&P 500 have released their Q4 results and approximately +76% have topped analysts’ estimates which will likely help the benchmark index snap a record nine quarter earnings slump. Bloomberg released a survey of investors across the globe which showed that investor confidence in the world economy fell in February on concern that sovereign debt will hinder economic growth. The Bloomberg Professional Global Confidence Index slid to 54.9 from 66.6 in January.
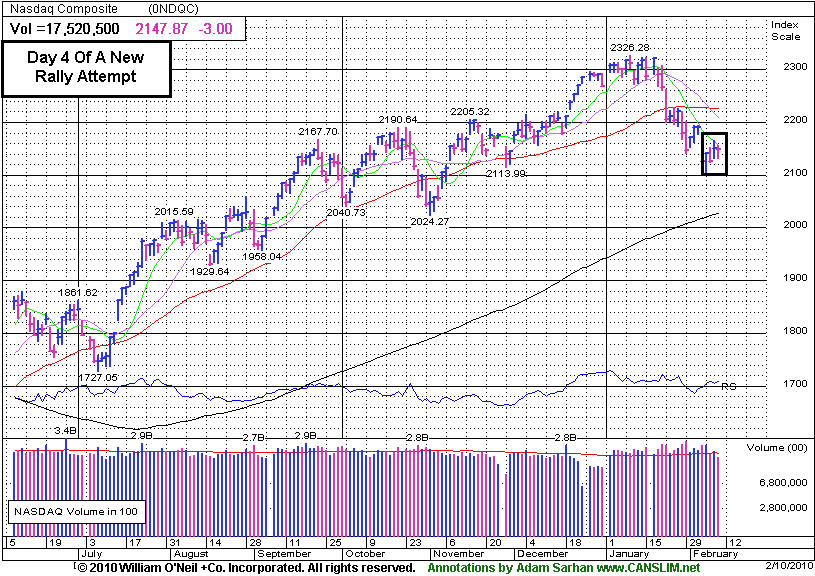
Looking at the market, as long as last Friday's lows are not breached, the window is now open for a new follow-through day (FTD) to emerge. A new follow-through day will be confirmed when one of the major averages rallies at least +1.7% on higher volume than the prior session as a new batch of leaders breakout of sound bases. However, if last Friday's lows are breached then the day count will be reset and a steeper correction may unfold.
It is also important to see how the major averages react to their respective 50-day moving average (DMA) lines which were support and are now acting as resistance. Until they all close above that important level the technical damage remaining on the charts is a concern. So far, the market's reaction has been tepid at best to the latest round of economic and earnings data. Remember that the recent series of distribution days coupled with the deleterious action in the major averages suggests large institutions are aggressively selling stocks. Disciplined investors will now wait for a new follow-through day to be produced before resuming any buying efforts. Until then, patience is paramount.
PICTURED: The Nasdaq Composite Index closed lower on Day 4 of its new rally attempt.
|
|
|
 |
SOX -12.8% Off High After Zapping +97% Higher Since March '09 Low
Kenneth J. Gruneisen - Passed the CAN SLIM® Master's Exam
It was somewhat encouraging to see financial shares show some leadership as the Broker/Dealer Index ($XBD +0.98%) and Bank Index ($BKX +1.03%) were standout gainers. The tech sector indices collectively paused in such a way that at least one analyst questioned the data provided by multiple sources confirming the lack of change in the Biotechnology Index ($BTK -0.02%), Internet Index ($IIX -0.02%), Semiconductor Index ($SOX -0.00%), and Networking Index ($NWX +0.05%). It was a lighter volume session with little conviction and a slightly negative bias in most other groups. Defensive areas including the Healthcare Index ($HMO -1.08%) and Gold & Silver Index ($XAU -0.32%) slumped, and the Retail Index ($RLX -0.44%) contributed to the major indices' negative bias. Energy-related shares were mostly quiet as the Integrated Oil Index ($XOI -0.30%) and Oil Services Index ($OSX -0.10%) seeped lower.
Charts courtesy www.stockcharts.com
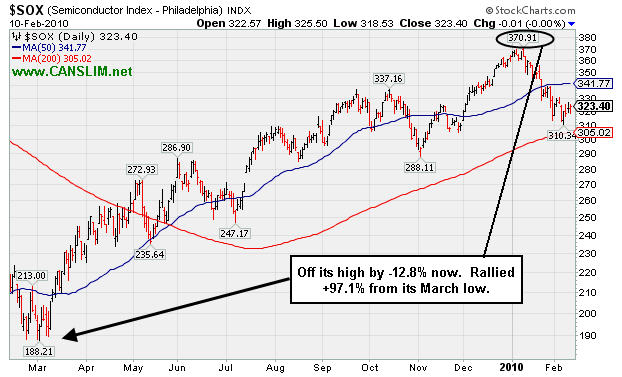
PICTURED: The Semiconductor Index ($SOX -0.00%) was unchanged today. It is off its high by -12.8% after having rallied +97.1% from its March 2009 low. It has stayed above its 200-day moving average (DMA) line since May, when its 50 DMA rose above its 200 DMA line. It has generally trended higher since that bullish crossover occurred, and the tech sector has been an important component underpinning the past year's rally.
| Oil Services |
$OSX |
193.10 |
-0.20 |
-0.10% |
-0.93% |
| Healthcare |
$HMO |
1,408.46 |
-15.42 |
-1.08% |
-4.38% |
| Integrated Oil |
$XOI |
1,003.97 |
-3.03 |
-0.30% |
-6.01% |
| Semiconductor |
$SOX |
323.40 |
-0.01 |
-0.00% |
-10.14% |
| Networking |
$NWX |
227.33 |
+0.12 |
+0.05% |
-1.61% |
| Internet |
$IIX |
219.67 |
-0.04 |
-0.02% |
-6.07% |
| Broker/Dealer |
$XBD |
110.68 |
+1.07 |
+0.98% |
-3.80% |
| Retail |
$RLX |
395.03 |
-1.75 |
-0.44% |
-3.91% |
| Gold & Silver |
$XAU |
154.58 |
-0.49 |
-0.32% |
-8.12% |
| Bank |
$BKX |
45.04 |
+0.46 |
+1.03% |
+5.46% |
| Biotech |
$BTK |
972.17 |
-0.21 |
-0.02% |
+3.19% |
|
|
|
 |
Recently Forced Lower By Distributional Pressure
Kenneth J. Gruneisen - Passed the CAN SLIM® Master's Exam
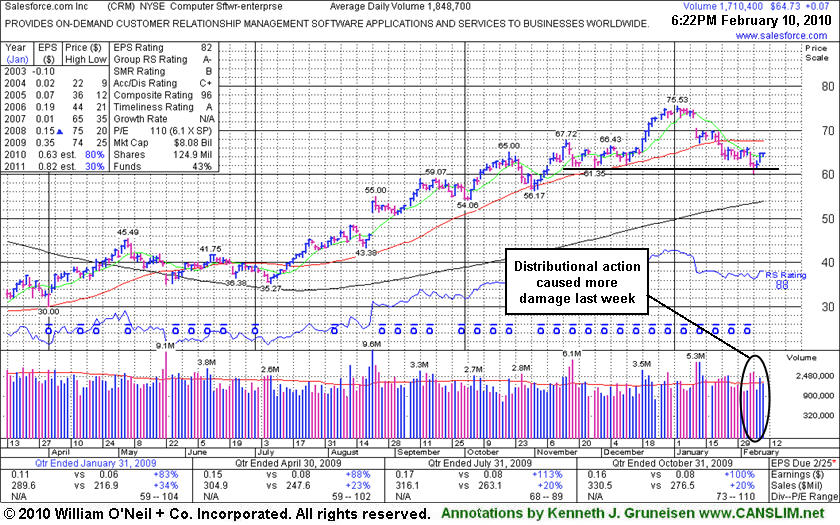
Salesforce.com, Inc. (CRM +$0.07 or +0.11% to $64.73) held its ground today. The high-ranked Computer Software - Enterprise firm encountered more pressure indicative of institutional (I criteria) distribution since its last appearance in this FSU section under the headline "Recent Damage Leaves High-Ranked Leader Testing Upward Trendline on 1/27/10. Then it was observed - "An upward trendline connecting its September-January lows now defines an important support level, where any further deterioration to new lows would raise even greater concerns." The upward trendline referred to at the time has subsequently been breached. Technically, the recent chart low ($60.30 on 2/05/10) is an important support level to watch, meanwhile a rebound back above its 50-day moving average (DMA) line is needed for its outlook improve.
Numerous notes in mid-January (see the "view all notes" links if you wish to review) called attention to CRM's deterioration. The weakness has likely prompted disciplined investors to sell any shares bought at the later stage, if not positions accumulated earlier. Market conditions (M criteria) still argue for playing good defense for at least the near-term period until a follow-through day emerges. More time is needed for a sound base to develop and, as stated above, a rebound back above its 50-day moving average (DMA) line is needed for its outlook improve.
|
|
|
Color Codes Explained :
Y - Better candidates highlighted by our
staff of experts.
G - Previously featured
in past reports as yellow but may no longer be buyable under the
guidelines.
***Last / Change / Volume quote data in this table corresponds with the timestamp on the note***
Symbol/Exchange
Company Name
Industry Group |
Last |
Chg. |
Vol
% DAV |
Date Featured |
Price Featured |
Latest Pivot Point
Featured |
Status |
| Latest Max Buy Price |
ARST
-
|
$24.73
|
+0.51
|
149,380
30% DAV
492,200
|
12/22/2009
(Date
Featured) |
$25.94
(Price
Featured) |
PP = $27.20 |
G |
| MB = $28.56 |
Most Recent Note - 2/10/2010 5:54:33 PM
G - Small gains this week have come with very light volume while it continues to struggle below its 50 DMA line. Important support to watch now is its recent low ($22.58) and prior chart lows in the $22 area. ARST was first featured in yellow at $19.91 in the 9/01/09 mid-day report with an annotated daily graph (read here).
>>> The latest Featured Stock Update with an annotated graph appeared on 2/4/2010. click here.
|
|
C
A
S
I |
News |
Chart |
SEC
View all notes Alert
me of new notes
Company
Profile
|
BIDU
- NASDAQ
Baidu Inc Ads
INTERNET - Internet Information Providers
|
$482.13
|
+47.12
|
5,646,749
303% DAV
1,863,500
|
1/13/2010
(Date
Featured) |
$431.25
(Price
Featured) |
PP = $426.75 |
G |
| MB = $448.09 |
Most Recent Note - 2/10/2010 6:02:07 PM
G - After reporting earnings and raising guidance it gapped up today for a considerable gain and new all-time high, closing strong with volume more than 3 times average. Market conditions (M criteria of the investment system) argue against new buying efforts until a follow-through-day confirms the latest rally attempt, otherwise odds are not favorable for investors. No overhead supply exists to hinder its progress.
>>> The latest Featured Stock Update with an annotated graph appeared on 2/3/2010. click here.
|
|
C
A
S
I |
News |
Chart |
SEC
View all notes Alert
me of new notes
Company
Profile
|
CACC
- NASDAQ
Credit Acceptance Corp
FINANCIAL SERVICES - Credit Services
|
$39.00
|
-1.90
|
123,385
202% DAV
61,000
|
9/29/2009
(Date
Featured) |
$33.48
(Price
Featured) |
PP = $37.10 |
G |
| MB = $38.96 |
Most Recent Note - 2/10/2010 6:03:36 PM
G - Down considerably today with above average volume for an 8th consecutive loss. Prior chart highs in the $37 area may act as support. Concerns were recently raised and sell signals triggered when this high-ranked Financial firm violated its 50 DMA line.
>>> The latest Featured Stock Update with an annotated graph appeared on 2/9/2010. click here.
|
|
C
A
S
I |
News |
Chart |
SEC
View all notes Alert
me of new notes
Company
Profile
|
CRM
- NYSE
Salesforce.com Inc
INTERNET - Internet Software & Services
|
$64.73
|
+0.07
|
1,713,752
93% DAV
1,848,700
|
12/18/2009
(Date
Featured) |
$67.32
(Price
Featured) |
PP = $67.82 |
G |
| MB = $71.21 |
Most Recent Note - 2/10/2010 6:06:19 PM
G - Held its ground today. Technically, the recent chart low ($60.30 on 2/05/10) is an important support level to watch, meanwhile a rebound back above its 50 DMA line is needed for its outlook improve.
>>> The latest Featured Stock Update with an annotated graph appeared on 2/10/2010. click here.
|
|
C
A
S
I |
News |
Chart |
SEC
View all notes Alert
me of new notes
Company
Profile
|
GMCR
- NASDAQ
Green Mtn Coffee Roastrs
FOOD & BEVERAGE - Processed & Packaged Goods
|
$82.53
|
-0.12
|
992,627
65% DAV
1,515,800
|
12/28/2009
(Date
Featured) |
$77.49
(Price
Featured) |
PP = $76.50 |
G |
| MB = $80.33 |
Most Recent Note - 2/10/2010 6:11:11 PM
G - Quietly consolidating above its 50 DMA line and prior chart highs in the $75-76 area which define an important support area to watch below recent weeks' lows.
>>> The latest Featured Stock Update with an annotated graph appeared on 2/2/2010. click here.
|
|
C
A
S
I |
News |
Chart |
SEC
View all notes Alert
me of new notes
Company
Profile
|
ISRG
- NASDAQ
Intuitive Surgical Inc
HEALTH SERVICES - Medical Appliances & Equipment
|
$321.95
|
-4.89
|
373,413
73% DAV
512,600
|
1/22/2010
(Date
Featured) |
$340.40
(Price
Featured) |
PP = $314.00 |
G |
| MB = $329.70 |
Most Recent Note - 2/10/2010 6:14:22 PM
G - Quietly consolidating above its 50 DMA line and prior chart highs in the $314 area that define important technical support. ISRG was featured again most recently in the 1/22/10 mid-day report (read here).
>>> The latest Featured Stock Update with an annotated graph appeared on 2/5/2010. click here.
|
|
C
A
S
I |
News |
Chart |
SEC
View all notes Alert
me of new notes
Company
Profile
|
PEGA
- NASDAQ
Pegasystems Inc
COMPUTER SOFTWARE & SERVICES - Business Software & Services
|
$35.27
|
+0.25
|
199,107
102% DAV
194,900
|
1/4/2010
(Date
Featured) |
$34.00
(Price
Featured) |
PP = $36.19 |
G |
| MB = $38.00 |
Most Recent Note - 2/10/2010 6:19:24 PM
G - Consolidating in the $35-36 area that was a previously a stubborn resistance level. It remains in healthy shape above its 50 DMA line, but wider than usual intra-day price swings with higher volume in the prior 2 weeks with distributional action raised concerns.
>>> The latest Featured Stock Update with an annotated graph appeared on 2/8/2010. click here.
|
|
C
A
S
I |
News |
Chart |
SEC
View all notes Alert
me of new notes
Company
Profile
|
|
|
|
THESE ARE NOT BUY RECOMMENDATIONS!
Comments contained in the body of this report are technical
opinions only. The material herein has been obtained
from sources believed to be reliable and accurate, however,
its accuracy and completeness cannot be guaranteed.
This site is not an investment advisor, hence it does
not endorse or recommend any securities or other investments.
Any recommendation contained in this report may not
be suitable for all investors and it is not to be deemed
an offer or solicitation on our part with respect to
the purchase or sale of any securities. All trademarks,
service marks and trade names appearing in this report
are the property of their respective owners, and are
likewise used for identification purposes only.
This report is a service available
only to active Paid Premium Members.
You may opt-out of receiving report notifications
at any time. Questions or comments may be submitted
by writing to Premium Membership Services 665 S.E. 10 Street, Suite 201 Deerfield Beach, FL 33441-5634 or by calling 1-800-965-8307
or 954-785-1121.
|
|
|


