You are not logged in.
This means you
CAN ONLY VIEW reports that were published prior to Monday, April 14, 2025.
You
MUST UPGRADE YOUR MEMBERSHIP if you want to see any current reports.
AFTER MARKET UPDATE - TUESDAY, FEBRUARY 9TH, 2010
Previous After Market Report Next After Market Report >>>
|
|
|
|
DOW |
+150.25 |
10,058.64 |
+1.52% |
|
Volume |
1,238,639,350 |
+14% |
|
Volume |
2,241,515,960 |
+9% |
|
NASDAQ |
+24.82 |
2,150.87 |
+1.17% |
|
Advancers |
2,389 |
76% |
|
Advancers |
1,924 |
68% |
|
S&P 500 |
+13.78 |
1,070.52 |
+1.30% |
|
Decliners |
663 |
21% |
|
Decliners |
768 |
27% |
|
Russell 2000 |
+8.68 |
595.17 |
+1.48% |
|
52 Wk Highs |
40 |
|
|
52 Wk Highs |
28 |
|
|
S&P 600 |
+4.17 |
316.12 |
+1.34% |
|
52 Wk Lows |
14 |
|
|
52 Wk Lows |
20 |
|
|
 |
Better Volume And Breadth Behind Indices' Gains
Adam Sarhan, Contributing Writer,
Stocks rallied, with emerging-market equities recovering from the worst three-day slide in a year as the US dollar fell, consolidating after recent gains. Volume was higher than the prior session on the NYSE and the Nasdaq exchange. Advancers led decliners by more than a 3-to-1 ratio on the NYSE and nearly a a 3-to-1 ratio on the Nasdaq exchange. There were 9 high-ranked companies from the CANSLIM.net Leaders List that made a new 52-week high and appeared on the CANSLIM.net BreakOuts Page, up from the 5 issues that appeared on the prior session. New 52-week highs outnumbered new 52-week lows on the NYSE and on the Nasdaq exchange.
Risk-taking returned to the market and a weaker US dollar sent metal and oil prices higher. Overnight, the euro rallied on speculation that Greece will receive European aid to tackle its massive budget deficit. On February 11, EU leaders are scheduled to discuss Greece’s plans to reduce its massive budget deficit and many now believe that the EU will offer assistance. European Central Bank President, Jean-Claude Trichet, unexpectedly left a meeting in Sydney one day ahead of schedule and returned to Europe to discuss this issue. In related news, European Commission President Jose Barroso supported the euro when he directly said that investors would be wrong to bet against it.
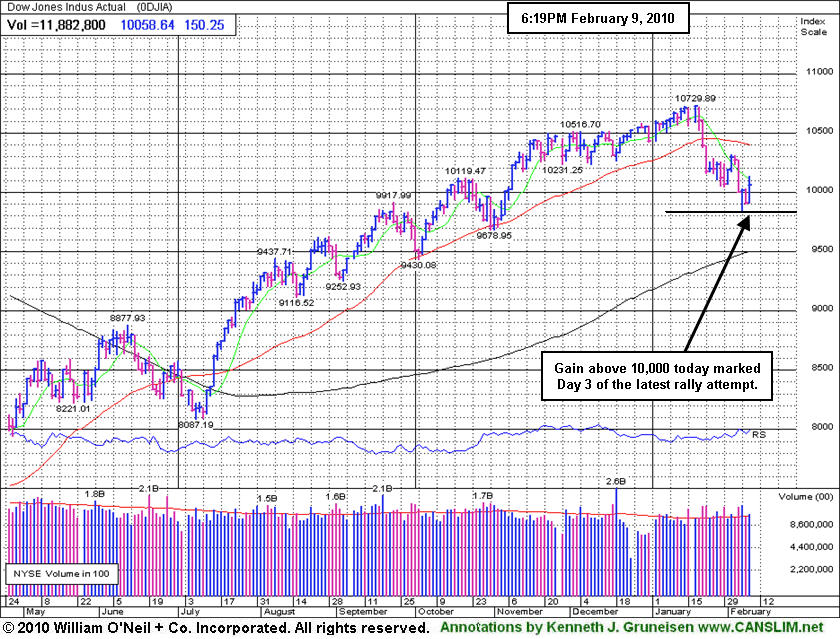
Looking at the market, Tuesday marked Day 3 of the newest rally attempt which means that as long as last Friday's lows are not breached this rally attempt remains intact. In addition, the earliest a possible follow-through day (FTD) could emerge will be Wednesday if the major averages rally at least +1.7% on higher volume than the prior session. However, if last Friday's lows are breached then the day count will be reset and a steeper correction may unfold.
It is also important to see how the major averages react to their respective 50-day moving average (DMA) lines which were support and are now acting as resistance. Until they all close above that important level the technical damage remaining on the charts is a concern. So far, the market's reaction has been tepid at best to the latest round of economic and earnings data. Remember that the recent series of distribution days coupled with the deleterious action in the major averages suggests large institutions are aggressively selling stocks. Disciplined investors will now wait for a new follow-through day to be produced before resuming any buying efforts. Until then, patience is paramount.
Professional Money Management Services - A Winning System - Inquire today!
Our skilled team of portfolio managers knows how to follow the rules of this fact-based investment system. We do not follow opinion or the "conviction list" of some large Wall Street institution which would have us fully invested even during horrific bear markets. Instead, we remain fluid and only buy the best stocks when they are triggering proper technical buy signals. If you are not completely satisfied with the way your portfolio is being managed, Click here to submit your inquiry. *Accounts over $250,000 please. ** Serious inquires only, please.
PICTURED: The Dow Jones Industrial Average rose back above 10,000 and Caterpillar (CAT +5.4%) was the best performing Dow component after receiving an analyst upgrade.
|
|
|
 |
Broker/Dealer Index Testing 200-Day Average Line
Kenneth J. Gruneisen - Passed the CAN SLIM® Master's Exam
Commodity-linked groups were among the best gainers as the Gold & Silver Index ($XAU +3.84%), Oil Services Index ($OSX +2.83%), and Integrated Oil Index ($XOI +1.94%) powered their way to solid gains on Tuesday. The Healthcare Index ($HMO +1.75%) was another gainer from a "defensive" area in the market - groups which are typically outperformers in times of economic uncertainty. The tech sector also traded with a positive bias as the Networking Index ($NWX +2.73%), Semiconductor Index ($SOX +1.43%), Biotechnology Index ($BTK +1.22%), and Internet Index ($IIX +0.83%) posted unanimous gains. Other influential groups were also on the rise as the Retail Index ($RLX +1.15%), Bank Index ($BKX +1.00%), and Broker/Dealer Index ($XBD +0.54%) rounded out a mostly positive session across the board.
Charts courtesy www.stockcharts.com
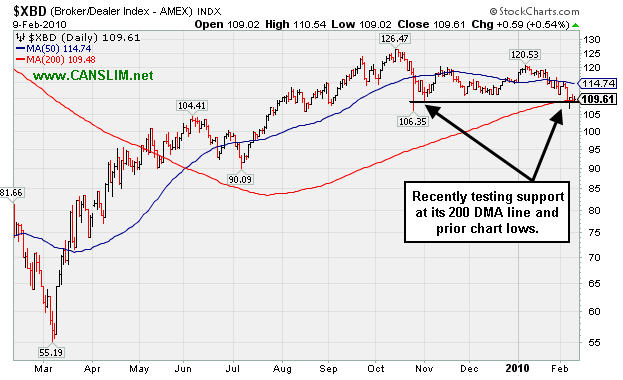
PICTURED: The Broker/Dealer Index ($XBD +0.54%) has been recently testing support at its 200-day moving average (DMA) line and prior chart lows. Gains back above its 50 DMA line (the blue line on the above graph) are needed to help this group's outlook. Such gains would also improve the broader market outlook.
| Oil Services |
$OSX |
193.30 |
+5.32 |
+2.83% |
-0.83% |
| Healthcare |
$HMO |
1,423.88 |
+24.51 |
+1.75% |
-3.33% |
| Integrated Oil |
$XOI |
1,007.00 |
+19.17 |
+1.94% |
-5.73% |
| Semiconductor |
$SOX |
323.41 |
+4.55 |
+1.43% |
-10.14% |
| Networking |
$NWX |
227.21 |
+6.04 |
+2.73% |
-1.67% |
| Internet |
$IIX |
219.71 |
+1.80 |
+0.83% |
-6.05% |
| Broker/Dealer |
$XBD |
109.61 |
+0.59 |
+0.54% |
-4.73% |
| Retail |
$RLX |
396.78 |
+4.51 |
+1.15% |
-3.49% |
| Gold & Silver |
$XAU |
155.07 |
+5.73 |
+3.84% |
-7.83% |
| Bank |
$BKX |
44.58 |
+0.44 |
+1.00% |
+4.38% |
| Biotech |
$BTK |
972.38 |
+11.69 |
+1.22% |
+3.21% |
|
|
|
 |
Damaging Losses Prompted Profit Taking
Kenneth J. Gruneisen - Passed the CAN SLIM® Master's Exam
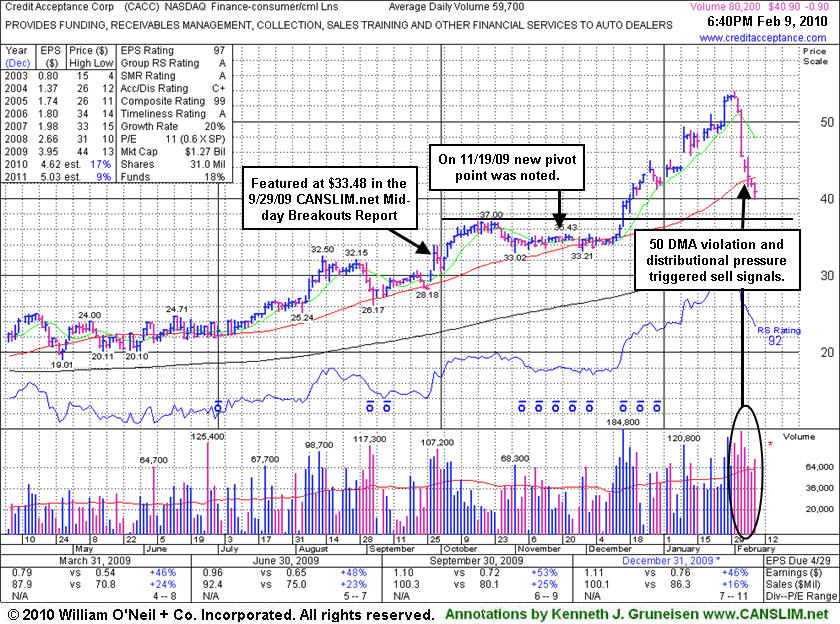
Credit Acceptance Corp (CACC -$0.90 or -2.15% to $40.90) has fallen sharply in the course of its current 7-session losing streak. Investors were prompted to consider locking in profits as worrisome action has transpired since its last FSU section appearance on 1/28/10 under the headline "Strong Leader Extended After Producing Big Gains." Damaging losses have quickly erased a large portion gains of as much as +61.2% since it was first featured in yellow at $33.48 in the 9/29/09 mid-day report (read here). After it was initially featured, it went on to later build a new sound base on top of its prior base. New pivot point and max buy levels were noted on 11/19/09, yet it stubbornly held its ground in a tight range for another month plus before finally blasting to new all-time highs with heavy volume on 12/16/09.
Distributional action recently has raised concerns and triggered technical sell signals as it violated its 50-day moving average (DMA) line. Previous chart highs at $37 define the next important support level to watch. Right now, however, the M criteria is an overriding concern which discourages new buying efforts until a proper follow-through day emerges. This stock also needs time to build a new sound base before new buying efforts would be justifiable under the investment system's strict technical buying discipline. On Monday Jan 25th the company announced the pricing of $250 Million Senior Secured Notes. The Finance - Consumer/Commercial Loans firm has maintained a great track record of annual and quarterly sales revenues and earnings increases that satisfy the C and A criteria of the investment system.
|
|
|
Color Codes Explained :
Y - Better candidates highlighted by our
staff of experts.
G - Previously featured
in past reports as yellow but may no longer be buyable under the
guidelines.
***Last / Change / Volume quote data in this table corresponds with the timestamp on the note***
Symbol/Exchange
Company Name
Industry Group |
Last |
Chg. |
Vol
% DAV |
Date Featured |
Price Featured |
Latest Pivot Point
Featured |
Status |
| Latest Max Buy Price |
ARST
-
|
$24.22
|
+0.44
|
170,112
35% DAV
491,500
|
12/22/2009
(Date
Featured) |
$25.94
(Price
Featured) |
PP = $27.20 |
G |
| MB = $28.56 |
Most Recent Note - 2/9/2010 5:48:18 PM
G - Small gain today came with very light volume. Important support to watch now is its recent low ($22.58) and prior chart lows in the $22 area. It would need to rebound above its 50 DMA line for its outlook to improve. ARST was first featured in yellow at $19.91 in the 9/01/09 mid-day report with an annotated daily graph (read here).
>>> The latest Featured Stock Update with an annotated graph appeared on 2/4/2010. click here.
|
|
C
A
S
I |
News |
Chart |
SEC
View all notes Alert
me of new notes
Company
Profile
|
BIDU
- NASDAQ
Baidu Inc Ads
INTERNET - Internet Information Providers
|
$435.01
|
-8.22
|
2,747,258
150% DAV
1,831,900
|
1/13/2010
(Date
Featured) |
$431.25
(Price
Featured) |
PP = $426.75 |
G |
| MB = $448.09 |
Most Recent Note - 2/9/2010 5:54:12 PM
G - Reported stronger than expected earnings and raised guidance after the close today, and after-hours trades have subsequently been reported at new all-time highs.
>>> The latest Featured Stock Update with an annotated graph appeared on 2/3/2010. click here.
|
|
C
A
S
I |
News |
Chart |
SEC
View all notes Alert
me of new notes
Company
Profile
|
CACC
- NASDAQ
Credit Acceptance Corp
FINANCIAL SERVICES - Credit Services
|
$40.90
|
-0.90
|
81,677
137% DAV
59,700
|
9/29/2009
(Date
Featured) |
$33.48
(Price
Featured) |
PP = $37.10 |
G |
| MB = $38.96 |
Most Recent Note - 2/9/2010 5:56:47 PM
G - Down today with above average volume, suffering its 7th consecutive loss. Concerns were recently raised and sell signals triggered when this high-ranked Financial firm violated its 50 DMA line.
>>> The latest Featured Stock Update with an annotated graph appeared on 2/9/2010. click here.
|
|
C
A
S
I |
News |
Chart |
SEC
View all notes Alert
me of new notes
Company
Profile
|
CRM
- NYSE
Salesforce.com Inc
INTERNET - Internet Software & Services
|
$64.66
|
+2.54
|
2,274,714
125% DAV
1,821,200
|
12/18/2009
(Date
Featured) |
$67.32
(Price
Featured) |
PP = $67.82 |
G |
| MB = $71.21 |
Most Recent Note - 2/9/2010 6:01:09 PM
G - Gapped up for a small gain today on slightly above average volume. Its recent chart low ($60.30 on 2/05/10) is an important support level to watch now. A rebound back above its 50 DMA line (now $67.55) would help its outlook improve.
>>> The latest Featured Stock Update with an annotated graph appeared on 1/27/2010. click here.
|
|
C
A
S
I |
News |
Chart |
SEC
View all notes Alert
me of new notes
Company
Profile
|
GMCR
- NASDAQ
Green Mtn Coffee Roastrs
FOOD & BEVERAGE - Processed & Packaged Goods
|
$82.65
|
+2.30
|
1,339,171
89% DAV
1,504,700
|
12/28/2009
(Date
Featured) |
$77.49
(Price
Featured) |
PP = $76.50 |
G |
| MB = $80.33 |
Most Recent Note - 2/9/2010 6:03:57 PM
G - Today's gain on slightly better (but still below average) volume halted a 4 session losing streak that was marked by even lighter volume totals. Perched near its all-time highs, the recent chart lows in the $78 area are an important support level to watch now.
>>> The latest Featured Stock Update with an annotated graph appeared on 2/2/2010. click here.
|
|
C
A
S
I |
News |
Chart |
SEC
View all notes Alert
me of new notes
Company
Profile
|
ISRG
- NASDAQ
Intuitive Surgical Inc
HEALTH SERVICES - Medical Appliances & Equipment
|
$326.84
|
+2.89
|
329,270
64% DAV
513,000
|
1/22/2010
(Date
Featured) |
$340.40
(Price
Featured) |
PP = $314.00 |
G |
| MB = $329.70 |
Most Recent Note - 2/9/2010 6:04:46 PM
G - Small gain today on very light volume while consolidating well above its 50 DMA line. ISRG was featured again most recently in the 1/22/10 mid-day report (read here).
>>> The latest Featured Stock Update with an annotated graph appeared on 2/5/2010. click here.
|
|
C
A
S
I |
News |
Chart |
SEC
View all notes Alert
me of new notes
Company
Profile
|
PEGA
- NASDAQ
Pegasystems Inc
COMPUTER SOFTWARE & SERVICES - Business Software & Services
|
$35.02
|
+0.46
|
229,229
119% DAV
192,000
|
1/4/2010
(Date
Featured) |
$34.00
(Price
Featured) |
PP = $36.19 |
G |
| MB = $38.00 |
Most Recent Note - 2/9/2010 6:06:39 PM
G - Volume was slightly above average behind today's gain after 4 consecutive losses. Wider than usual intra-day price swings in the prior 2 weeks were noted as signs of uncertainty.
>>> The latest Featured Stock Update with an annotated graph appeared on 2/8/2010. click here.
|
|
C
A
S
I |
News |
Chart |
SEC
View all notes Alert
me of new notes
Company
Profile
|
|
|
|
THESE ARE NOT BUY RECOMMENDATIONS!
Comments contained in the body of this report are technical
opinions only. The material herein has been obtained
from sources believed to be reliable and accurate, however,
its accuracy and completeness cannot be guaranteed.
This site is not an investment advisor, hence it does
not endorse or recommend any securities or other investments.
Any recommendation contained in this report may not
be suitable for all investors and it is not to be deemed
an offer or solicitation on our part with respect to
the purchase or sale of any securities. All trademarks,
service marks and trade names appearing in this report
are the property of their respective owners, and are
likewise used for identification purposes only.
This report is a service available
only to active Paid Premium Members.
You may opt-out of receiving report notifications
at any time. Questions or comments may be submitted
by writing to Premium Membership Services 665 S.E. 10 Street, Suite 201 Deerfield Beach, FL 33441-5634 or by calling 1-800-965-8307
or 954-785-1121.
|
|
|