You are not logged in.
This means you
CAN ONLY VIEW reports that were published prior to Wednesday, April 23, 2025.
You
MUST UPGRADE YOUR MEMBERSHIP if you want to see any current reports.
AFTER MARKET UPDATE - MONDAY, FEBRUARY 8TH, 2010
Previous After Market Report Next After Market Report >>>
|
|
|
|
DOW |
-103.84 |
9,908.39 |
-1.04% |
|
Volume |
1,084,800,640 |
-31% |
|
Volume |
2,059,117,020 |
-29% |
|
NASDAQ |
-15.07 |
2,126.05 |
-0.70% |
|
Advancers |
1,077 |
35% |
|
Advancers |
947 |
34% |
|
S&P 500 |
-9.45 |
1,056.74 |
-0.89% |
|
Decliners |
1,957 |
63% |
|
Decliners |
1,723 |
62% |
|
Russell 2000 |
-6.49 |
586.49 |
-1.09% |
|
52 Wk Highs |
29 |
|
|
52 Wk Highs |
19 |
|
|
S&P 600 |
-3.38 |
311.95 |
-1.07% |
|
52 Wk Lows |
15 |
|
|
52 Wk Lows |
25 |
|
|
 |
Major Averages Tally Losses on Lighter Volume
Adam Sarhan, Contributing Writer,
The major averages negatively reversed and ended lower on Monday as concern spread that some European governments will struggle to fund ballooning budget deficits. Volume was lower than the prior session on the NYSE and the Nasdaq exchange. Decliners led advancers by nearly a 2-to-1 ratio on the NYSE and the Nasdaq exchange. There were only 5 high-ranked companies from the CANSLIM.net Leaders List that made a new 52-week high and appeared on the CANSLIM.net BreakOuts Page, higher than the 3 issues that appeared on the prior session. New 52-week highs outnumbered new 52-week lows on the NYSE but trailed by a small margin on the Nasdaq exchange.
Stocks opened higher on Monday but turned lower after concern spread that several European countries may default on their debt. Greece, Spain and Portugal are the three primary suspects for the latest sovereign debt crisis. The primary concern is that these countries will need outside assistance to stay afloat as they make their way through the worst recession since WWII. Meanwhile, the Congressional Budget Office expects America’s debt to reach +65% of US GDP this year which would still be below the +77% of GDP the European Commission expects for Germany, U.K. is running closer to +80% and Japan is in the lead with a whopping +180%.
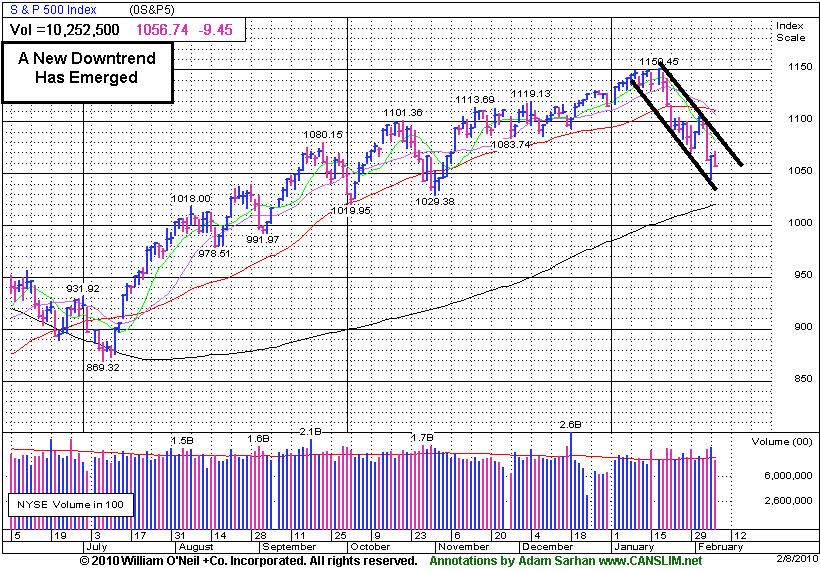
Looking at the market, Monday marked Day 2 of a new rally attempt which means that as long as last Friday's lows are not breached this rally attempt remains intact. The earliest a possible follow-through day (FTD) will emerge will be this Wednesday. However, if Friday's lows are breached then the day count will be reset and a steeper correction may unfold. It is also important to see how the major averages react to their respective 50-day moving average (DMA) lines which were support and are now acting as resistance. Until they all close above that important level the technical damage remaining on the charts is a concern. So far, the market's reaction has been tepid at best to the latest round of economic and earnings data. Remember that the recent series of distribution days coupled with the deleterious action in the major averages suggests large institutions are aggressively selling stocks. Disciplined investors will now wait for a new follow-through day to be produced before resuming any buying efforts. Until then, patience is paramount.
Professional Money Management Services - A Winning System - Inquire today!
Our skilled team of portfolio managers knows how to follow the rules of this fact-based investment system. We do not follow opinion or the "conviction list" of some large Wall Street institution which would have us fully invested even during horrific bear markets. Instead, we remain fluid and only buy the best stocks when they are triggering proper technical buy signals. If you are not completely satisfied with the way your portfolio is being managed, Click here to submit your inquiry. *Accounts over $250,000 please. ** Serious inquires only, please.
PICTURED: The S&P 500 Index has steadily fallen over the past four weeks and is currently -8.1% below its recent high.
|
|
|
 |
Commodity-Linked And Financials Among Weaker Groups
Kenneth J. Gruneisen - Passed the CAN SLIM® Master's Exam
Commodity-related shares and financial shares were among Monday's weaker performers as the Gold & Silver Index ($XAU -3.18%), Integrated Oil Index ($XOI -1.05%), Oil Services Index ($OSX -0.92%), and the Bank Index ($BKX -1.47%) and Broker/Dealer Index ($XBD -1.03%) ended unanimously lower. The Healthcare Index ($HMO -0.73%) also fell, and the tech sector traded with a slightly negative bias as the Networking Index ($NWX -0.91%), Internet Index ($IIX -0.66%), Biotechnology Index ($BTK -0.64%), and Semiconductor Index ($SOX -0.36%) each fell less than -1% on the session.
Charts courtesy www.stockcharts.com
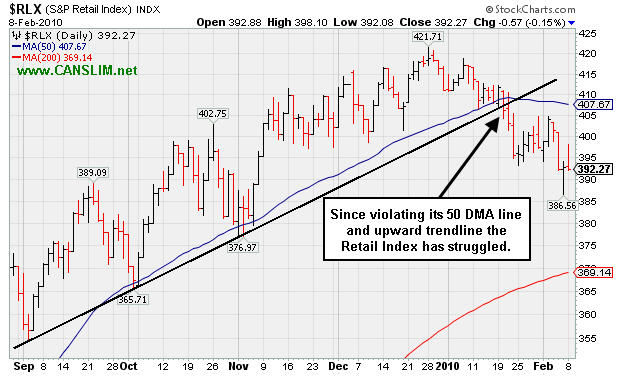
PICTURED: The Retail Index ($RLX -0.15%) has struggled since violating its 50-day moving average line and upward trendline.
| Oil Services |
$OSX |
187.98 |
-1.75 |
-0.92% |
-3.56% |
| Healthcare |
$HMO |
1,399.37 |
-10.26 |
-0.73% |
-4.99% |
| Integrated Oil |
$XOI |
987.83 |
-10.45 |
-1.05% |
-7.52% |
| Semiconductor |
$SOX |
318.86 |
-1.15 |
-0.36% |
-11.41% |
| Networking |
$NWX |
221.17 |
-2.02 |
-0.91% |
-4.28% |
| Internet |
$IIX |
217.91 |
-1.45 |
-0.66% |
-6.82% |
| Broker/Dealer |
$XBD |
109.02 |
-1.13 |
-1.03% |
-5.24% |
| Retail |
$RLX |
392.27 |
-0.57 |
-0.15% |
-4.59% |
| Gold & Silver |
$XAU |
149.34 |
-4.91 |
-3.18% |
-11.24% |
| Bank |
$BKX |
44.14 |
-0.66 |
-1.47% |
+3.35% |
| Biotech |
$BTK |
960.69 |
-6.17 |
-0.64% |
+1.97% |
|
|
|
 |
Latest Breakout Promptly Failed, Yet 50 DMA Acted As Support
Kenneth J. Gruneisen - Passed the CAN SLIM® Master's Exam
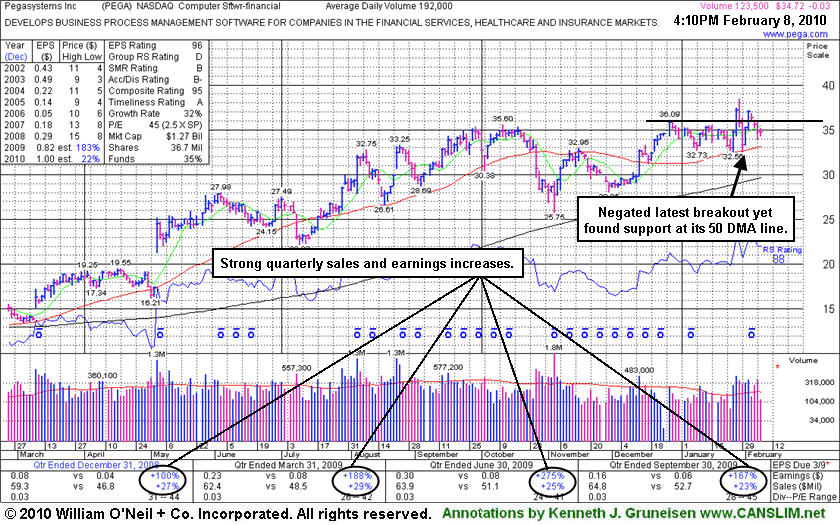
Pegasystems Inc. (PEGA -0.19 or -0.55% to $34.56) was down today on lighter volume as it fell for a 4th consecutive loss. Wider than usual intra-day price swings in the past 2 weeks were noted as signs of uncertainty. Since its prior appearance in this FSU section on 1/25/10 under the headline "No Buy Signal Since Recently Featured in CANSLIM.net News" it broke out with great volume conviction on 1/27/10 and triggered a technical buy signal, however 2 big losses on heavy volume promptly negated that breakout. Its 50-day moving average line and recent chart lows near $32.50 help define important technical support, where violations would trigger more worrisome sell signals. Negative market conditions (M criteria) are currently an overriding concern prompting great caution, since a follow-through day is still needed to confirm a new rally.
PEGA was featured in the January 2010 issue of CANSLIM.net News (read here). This high-ranked Computer Software - Financial firm develops, markets, licenses, and supports software to automate various business processes primarily the United States, the United Kingdom, and Europe. It has attracted an increasing number of institutional investors, as the number of top-rated funds owning its shares rose from 43 in Sep '08 to 84 in Dec '09, which is a solid reassurance concerning the investment system's I criteria. PEGA has shown good sales revenues increases and its earnings increases were well above the +25% guideline in the 4 last quarterly comparisons versus the year ago period. The previously noted downturn in annual earnings (the A criteria) from 2003 to 2006 has been followed by a solid turn around and big earnings increases in '07, '08 and '09.
Caution and patience are suggested until the stock manages to build a new base and the broader market (M criteria) proves itself. Meanwhile, 3 out of 4 stocks are likely to struggle since the market is currently in a correction. Odds are not in favor of new buys working out until a new rally is confirmed with a follow-through-day of gains from at least one of the 3 major market averages.
|
|
|
Color Codes Explained :
Y - Better candidates highlighted by our
staff of experts.
G - Previously featured
in past reports as yellow but may no longer be buyable under the
guidelines.
***Last / Change / Volume quote data in this table corresponds with the timestamp on the note***
Symbol/Exchange
Company Name
Industry Group |
Last |
Chg. |
Vol
% DAV |
Date Featured |
Price Featured |
Latest Pivot Point
Featured |
Status |
| Latest Max Buy Price |
ARST
-
|
$23.79
|
-0.08
|
308,751
63% DAV
488,900
|
12/22/2009
(Date
Featured) |
$25.94
(Price
Featured) |
PP = $27.20 |
G |
| MB = $28.56 |
Most Recent Note - 2/8/2010 5:01:57 PM
G - Small loss today with light volume. Important support to watch now is its recent low ($22.58) and prior chart lows in the $22 area. It would need to rebound above its 50 DMA line for its outlook to improve. ARST was first featured in yellow at $19.91 in the 9/01/09 mid-day report with an annotated daily graph (read here).
>>> The latest Featured Stock Update with an annotated graph appeared on 2/4/2010. click here.
|
|
C
A
S
I |
News |
Chart |
SEC
View all notes Alert
me of new notes
Company
Profile
|
BIDU
- NASDAQ
Baidu Inc Ads
INTERNET - Internet Information Providers
|
$443.23
|
-5.57
|
1,180,331
64% DAV
1,832,500
|
1/13/2010
(Date
Featured) |
$431.25
(Price
Featured) |
PP = $426.75 |
G |
| MB = $448.09 |
Most Recent Note - 2/8/2010 5:07:46 PM
G - Consolidating near all-time highs above its 50 DMA line and prior chart highs. Due to report earnings after the close on February 9th.
>>> The latest Featured Stock Update with an annotated graph appeared on 2/3/2010. click here.
|
|
C
A
S
I |
News |
Chart |
SEC
View all notes Alert
me of new notes
Company
Profile
|
CACC
- NASDAQ
Credit Acceptance Corp
FINANCIAL SERVICES - Credit Services
|
$41.80
|
-0.99
|
57,248
97% DAV
58,900
|
9/29/2009
(Date
Featured) |
$33.48
(Price
Featured) |
PP = $37.10 |
G |
| MB = $38.96 |
Most Recent Note - 2/8/2010 5:09:46 PM
G - Down on lighter volume today for its 6th consecutive loss, this high-ranked Financial firm closed under its 50 DMA line.
>>> The latest Featured Stock Update with an annotated graph appeared on 1/28/2010. click here.
|
|
C
A
S
I |
News |
Chart |
SEC
View all notes Alert
me of new notes
Company
Profile
|
CRM
- NYSE
Salesforce.com Inc
INTERNET - Internet Software & Services
|
$62.12
|
+0.04
|
1,265,569
69% DAV
1,833,100
|
12/18/2009
(Date
Featured) |
$67.32
(Price
Featured) |
PP = $67.82 |
G |
| MB = $71.21 |
Most Recent Note - 2/8/2010 5:11:30 PM
G - Held its ground today with a small gain on light volume. Distributional pressure last week led to a breach of its recent chart lows in the $63 area while recent gains lacked volume. It would need to rebound above its 50 DMA line for its outlook to improve.
>>> The latest Featured Stock Update with an annotated graph appeared on 1/27/2010. click here.
|
|
C
A
S
I |
News |
Chart |
SEC
View all notes Alert
me of new notes
Company
Profile
|
GMCR
- NASDAQ
Green Mtn Coffee Roastrs
FOOD & BEVERAGE - Processed & Packaged Goods
|
$80.35
|
-2.25
|
1,123,911
74% DAV
1,514,800
|
12/28/2009
(Date
Featured) |
$77.49
(Price
Featured) |
PP = $76.50 |
G |
| MB = $80.33 |
Most Recent Note - 2/8/2010 5:13:22 PM
G - Today marked its 4th consecutive loss on below average volume. Consolidating near its all-time highs, while recent chart lows in the $78 area are an important support level to watch now.
>>> The latest Featured Stock Update with an annotated graph appeared on 2/2/2010. click here.
|
|
C
A
S
I |
News |
Chart |
SEC
View all notes Alert
me of new notes
Company
Profile
|
ISRG
- NASDAQ
Intuitive Surgical Inc
HEALTH SERVICES - Medical Appliances & Equipment
|
$323.95
|
-1.46
|
372,818
73% DAV
512,400
|
1/22/2010
(Date
Featured) |
$340.40
(Price
Featured) |
PP = $314.00 |
G |
| MB = $329.70 |
Most Recent Note - 2/8/2010 5:20:33 PM
G - Small loss today on light volume while consolidating well above its 50 DMA line. ISRG was featured again most recently in the 1/22/10 mid-day report (read here).
>>> The latest Featured Stock Update with an annotated graph appeared on 2/5/2010. click here.
|
|
C
A
S
I |
News |
Chart |
SEC
View all notes Alert
me of new notes
Company
Profile
|
PEGA
- NASDAQ
Pegasystems Inc
COMPUTER SOFTWARE & SERVICES - Business Software & Services
|
$34.56
|
-0.19
|
135,091
70% DAV
192,000
|
1/4/2010
(Date
Featured) |
$34.00
(Price
Featured) |
PP = $36.19 |
G |
| MB = $38.00 |
Most Recent Note - 2/8/2010 5:24:28 PM
G - Volume was lighter today as it fell for a 4th consecutive loss. Wider than usual intra-day price swings in the past 2 weeks were noted as signs of uncertainty.
>>> The latest Featured Stock Update with an annotated graph appeared on 2/8/2010. click here.
|
|
C
A
S
I |
News |
Chart |
SEC
View all notes Alert
me of new notes
Company
Profile
|
|
|
|
THESE ARE NOT BUY RECOMMENDATIONS!
Comments contained in the body of this report are technical
opinions only. The material herein has been obtained
from sources believed to be reliable and accurate, however,
its accuracy and completeness cannot be guaranteed.
This site is not an investment advisor, hence it does
not endorse or recommend any securities or other investments.
Any recommendation contained in this report may not
be suitable for all investors and it is not to be deemed
an offer or solicitation on our part with respect to
the purchase or sale of any securities. All trademarks,
service marks and trade names appearing in this report
are the property of their respective owners, and are
likewise used for identification purposes only.
This report is a service available
only to active Paid Premium Members.
You may opt-out of receiving report notifications
at any time. Questions or comments may be submitted
by writing to Premium Membership Services 665 S.E. 10 Street, Suite 201 Deerfield Beach, FL 33441-5634 or by calling 1-800-965-8307
or 954-785-1121.
|
|
|


