***Last / Change / Volume data in this table is the closing quote data***
Symbol/Exchange
Company Name
Industry Group |
PRICE |
CHANGE
(%Change) |
Day High |
Volume
(% DAV)
(% 50 day avg vol) |
52 Wk Hi
% From Hi |
Featured
Date |
Price
Featured |
Pivot Featured |
|
Max Buy |
BIDU
-
NASDAQ
Baidu Inc Ads
INTERNET - Internet Information Providers
|
$118.96
|
+1.28
1.09% |
$120.50
|
7,636,818
98.85% of 50 DAV
50 DAV is 7,725,300
|
$119.21
-0.21%
|
2/1/2011
|
$117.74
|
PP = $112.08
|
|
MB = $117.68
|
Most Recent Note - 2/4/2011
Y - Holding its ground in a tight range since gapping up on 2/01/11 rising from a "double bottom" base pattern. Color code was changed to yellow with pivot point cited based upon its 12/07/10 high. It rebounded above its 50 DMA line in recent weeks. It stayed well above its 200 DMA line in the interim since it was dropped from the Featured Stocks list on 12/27/10.
>>> The latest Featured Stock Update with an annotated graph appeared on 2/2/2011. Click here.
View all notes |
Alert me of new notes |
CANSLIM.net Company Profile |
SEC |
Zacks Reports |
StockTalk |
News |
Chart |
Request a new note
C
A N
S L
I M


|
CRUS
-
NASDAQ
Cirrus Logic Inc
ELECTRONICS - Semiconductor - Specialized
|
$24.09
|
-0.72
-2.90% |
$25.15
|
6,249,511
192.37% of 50 DAV
50 DAV is 3,248,700
|
$25.05
-3.83%
|
1/28/2011
|
$20.69
|
PP = $19.17
|
|
MB = $20.13
|
 Most Recent Note - 2/7/2011 12:46:11 PM
G - Patience may allow for secondary buy points to develop. Holding its ground after 5 consecutive volume-driven gains, extended from its latest sound base pattern. Prior highs define chart support levels to watch on pullbacks.
>>> The latest Featured Stock Update with an annotated graph appeared on 1/28/2011. Click here.
View all notes |
Alert me of new notes |
CANSLIM.net Company Profile |
SEC |
Zacks Reports |
StockTalk |
News |
Chart |
Request a new note
C
A N
S L
I M
|
CTSH
-
NASDAQ
Cognizant Tech Sol Cl A
COMPUTER SOFTWARE and SERVICES - Business Software and Services
|
$74.72
|
-0.70
-0.93% |
$76.44
|
4,131,462
190.66% of 50 DAV
50 DAV is 2,166,900
|
$76.49
-2.31%
|
2/7/2011
|
$75.09
|
PP = $76.46
|
|
MB = $80.28
|
Most Recent Note - 2/7/2011 1:02:07 PM
Y - Hovering near its all-time high, building a short flat base while recently finding support at its 50 DMA line. Color code is changed to yellow with pivot point cited based on its 1/06/11 high plus ten cents. A subsequent breakout with volume may trigger a buy signal from its riskier late-stage base. Recent quarters showed much better sales and earnings increases versus the year earlier and it maintained a strong annual earnings (A criteria) history. It reported earnings +40% on +45% sales for the quarter ended December 31, 2010 versus the year ago period in the interim since last noted in the 10/15/10 mid-day report. It is already well-known by the institutional crowd, and decreasing top-rated institutional ownership (I criteria) is a concern after falling from 1,640 in Jun '10 to 1,617 in Dec '10. On 4/11/07 this stock was dropped from the CANSLIM.net Featured Stocks list and it subsequently fell from $40+ to $14 before rebounding impressively.
>>> The latest Featured Stock Update with an annotated graph appeared on 3/23/2007. Click here.
View all notes |
Alert me of new notes |
CANSLIM.net Company Profile |
SEC |
Zacks Reports |
StockTalk |
News |
Chart |
Request a new note
C
A N
S L
I M
|
DECK
-
NASDAQ
Deckers Outdoor Corp
CONSUMER NON-DURABLES - Textile - Apparel Footwear
|
$82.84
|
+1.90
2.35% |
$83.26
|
1,481,202
78.50% of 50 DAV
50 DAV is 1,887,000
|
$87.88
-5.74%
|
2/3/2011
|
$79.61
|
PP = $82.67
|
|
MB = $86.80
|
Most Recent Note - 2/7/2011 5:17:50 PM
Y - Gapped up today while extending its streak to 5 consecutive gains with below average volume, and it inched to a close above its pivot point. Color code was changed to yellow with new pivot point cited based on its 1/11/11 high while forming a double bottom base pattern.
>>> The latest Featured Stock Update with an annotated graph appeared on 1/26/2011. Click here.
View all notes |
Alert me of new notes |
CANSLIM.net Company Profile |
SEC |
Zacks Reports |
StockTalk |
News |
Chart |
Request a new note
C
A N
S L
I M
|
EZCH
-
NASDAQ
Ezchip Semiconductor Ltd
ELECTRONICS - Semiconductor - Specialized
|
$32.40
|
+1.52
4.92% |
$32.61
|
539,849
176.31% of 50 DAV
50 DAV is 306,200
|
$33.20
-2.41%
|
12/2/2010
|
$27.53
|
PP = $26.00
|
|
MB = $27.30
|
Most Recent Note - 2/7/2011 1:05:13 PM
G - Gapped up today for a 5th consecutive gain, challenging its 52-week high. Recently found support above its 50 DMA line and prior chart highs in the $29 area.
>>> The latest Featured Stock Update with an annotated graph appeared on 1/21/2011. Click here.
View all notes |
Alert me of new notes |
CANSLIM.net Company Profile |
SEC |
Zacks Reports |
StockTalk |
News |
Chart |
Request a new note
C
A N
S L
I M
|
Symbol/Exchange
Company Name
Industry Group |
PRICE |
CHANGE
(%Change) |
Day High |
Volume
(% DAV)
(% 50 day avg vol) |
52 Wk Hi
% From Hi |
Featured
Date |
Price
Featured |
Pivot Featured |
|
Max Buy |
EZPW
-
NASDAQ
Ezcorp Inc Cl A
SPECIALTY RETAIL - Specialty Retail, Other
|
$27.59
|
+0.30
1.10% |
$27.96
|
207,159
49.50% of 50 DAV
50 DAV is 418,500
|
$29.94
-7.85%
|
11/5/2010
|
$24.02
|
PP = $23.85
|
|
MB = $25.04
|
Most Recent Note - 2/4/2011 4:20:39 PM
G - Volume totals have been cooling while consolidating near its 50 DMA line, showing resilience after damaging distribution. It is not near any sound base, and its recent low ($25.56 on 1/25/11) defines an important support level now. See the latest FSU analysis for more details and an annotated graph.
>>> The latest Featured Stock Update with an annotated graph appeared on 2/3/2011. Click here.
View all notes |
Alert me of new notes |
CANSLIM.net Company Profile |
SEC |
Zacks Reports |
StockTalk |
News |
Chart |
Request a new note
C
A N
S L
I M
|
FOSL
-
NASDAQ
Fossil Inc
CONSUMER DURABLES - Recreational Goods, Other
|
$76.56
|
+0.00
0.00% |
$76.94
|
339,734
48.65% of 50 DAV
50 DAV is 698,300
|
$76.67
-0.14%
|
2/1/2011
|
$73.30
|
PP = $74.44
|
|
MB = $78.16
|
Most Recent Note - 2/4/2011 4:25:40 PM
Y - Hit another new 52-week high today with a 2nd consecutive gain on light volume, inching up above its pivot point from an orderly 8-week flat base. Color code was changed to yellow with new pivot point cited, however it may be considered a riskier "late-stage" base. Great volume conviction is a critical element needed to confirm a new (or add-on) technical buy signal. Recent chart low ($66.05 on 1/25/11) defines important support
>>> The latest Featured Stock Update with an annotated graph appeared on 1/12/2011. Click here.
View all notes |
Alert me of new notes |
CANSLIM.net Company Profile |
SEC |
Zacks Reports |
StockTalk |
News |
Chart |
Request a new note
C
A N
S L
I M
|
HMSY
-
NASDAQ
H M S Holdings Corp
COMPUTER SOFTWARE and SERVICES - Healthcare Information Service
|
$66.65
|
+0.67
1.02% |
$67.07
|
131,085
91.22% of 50 DAV
50 DAV is 143,700
|
$67.42
-1.14%
|
11/19/2010
|
$61.89
|
PP = $63.01
|
|
MB = $66.16
|
Most Recent Note - 2/4/2011 4:27:23 PM
G - This week's gains with light volume helped it find support at its 50 DMA line and finish only -2.1% off its 52-week high. It is building a base-on-base type pattern, but its waning Relative Strength rank (now 72) has been noted as a concern.
>>> The latest Featured Stock Update with an annotated graph appeared on 1/3/2011. Click here.
View all notes |
Alert me of new notes |
CANSLIM.net Company Profile |
SEC |
Zacks Reports |
StockTalk |
News |
Chart |
Request a new note
C
A N
S L
I M
|
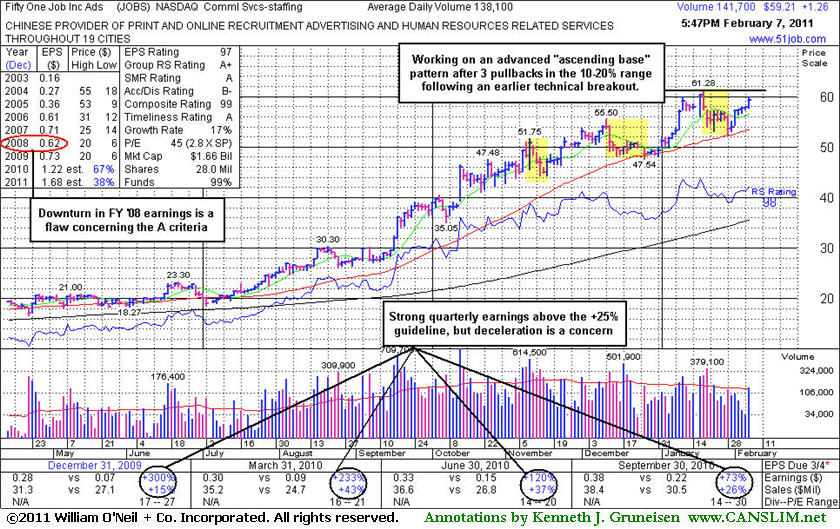
JOBS
-
NASDAQ
Fifty One Job Inc Ads
DIVERSIFIED SERVICES - Staffing and; Outsourcing Service
|
$59.23
|
+1.28
2.21% |
$59.92
|
142,038
102.85% of 50 DAV
50 DAV is 138,100
|
$61.28
-3.35%
|
2/7/2011
|
$59.23
|
PP = $61.38
|
|
MB = $64.45
|
Most Recent Note - 2/7/2011 6:19:06 PM
Y - Color code is changed to yellow with new pivot point cited after a long ascending base pattern. Posted 6th small gain today and volume picked up to near average while it finished at its second-best close ever. Its 50 DMA line defines important support, where a violation would raise concerns and trigger a technical sell signal. See the latest FSU analysis for more details and an annotated graph.
>>> The latest Featured Stock Update with an annotated graph appeared on 2/7/2011. Click here.
View all notes |
Alert me of new notes |
CANSLIM.net Company Profile |
SEC |
Zacks Reports |
StockTalk |
News |
Chart |
Request a new note
C
A N
S L
I M
|
LULU
-
NASDAQ
Lululemon Athletica
MANUFACTURING - Textile Manufacturing
|
$78.39
|
+1.43
1.86% |
$79.11
|
2,220,345
103.54% of 50 DAV
50 DAV is 2,144,400
|
$77.35
1.34%
|
1/26/2011
|
$68.11
|
PP = $74.70
|
|
MB = $78.44
|
Most Recent Note - 2/7/2011 5:23:27 PM
Y - Gapped up today and hit another new 52-week high, closing near its "max buy" level. A convincing gain above its pivot point with more than 2 times average volume on 2/04/11 triggered a technical buy signal.
>>> The latest Featured Stock Update with an annotated graph appeared on 1/14/2011. Click here.
View all notes |
Alert me of new notes |
CANSLIM.net Company Profile |
SEC |
Zacks Reports |
StockTalk |
News |
Chart |
Request a new note
C
A N
S L
I M
|
Symbol/Exchange
Company Name
Industry Group |
PRICE |
CHANGE
(%Change) |
Day High |
Volume
(% DAV)
(% 50 day avg vol) |
52 Wk Hi
% From Hi |
Featured
Date |
Price
Featured |
Pivot Featured |
|
Max Buy |
MWIV
-
NASDAQ
M W I Veterinary Supply
HEALTH SERVICES - Medical Instruments and; Supplies
|
$67.51
|
+1.66
2.52% |
$68.02
|
103,556
175.52% of 50 DAV
50 DAV is 59,000
|
$67.13
0.57%
|
11/4/2010
|
$61.79
|
PP = $59.60
|
|
MB = $62.58
|
Most Recent Note - 2/7/2011 5:25:36 PM
G - Hit a new all-time high today and closed near the session high with a 3rd consecutive gain on above average volume. Reported earnings +38% on +55% sales revenues for the quarter ended December 31, 2010, and found support near its 50 DMA line recently. Sales revenues acceleration (bigger percentage increases sequentially) is a very reassuring sign.
>>> The latest Featured Stock Update with an annotated graph appeared on 2/2/2011. Click here.
View all notes |
Alert me of new notes |
CANSLIM.net Company Profile |
SEC |
Zacks Reports |
StockTalk |
News |
Chart |
Request a new note
C
A N
S L
I M
|
NFLX
-
NASDAQ
Netflix Inc
SPECIALTY RETAIL - Music and Video Stores
|
$218.02
|
-2.05
-0.93% |
$222.81
|
3,633,285
61.63% of 50 DAV
50 DAV is 5,895,200
|
$221.00
-1.35%
|
1/10/2011
|
$187.88
|
PP = $209.34
|
|
MB = $219.81
|
Most Recent Note - 2/4/2011 4:44:01 PM
G - Gain today with average volume led to a close just above its "max buy" level, and its color code is changed to green. Prior highs define support to watch above its 50 DMA line.
>>> The latest Featured Stock Update with an annotated graph appeared on 1/10/2011. Click here.
View all notes |
Alert me of new notes |
CANSLIM.net Company Profile |
SEC |
Zacks Reports |
StockTalk |
News |
Chart |
Request a new note
C
A N
S L
I M
|
NTAP
-
NASDAQ
Netapp Inc
COMPUTER HARDWARE - Data Storage Devices
|
$58.64
|
+0.71
1.23% |
$59.48
|
3,811,157
84.89% of 50 DAV
50 DAV is 4,489,400
|
$59.79
-1.92%
|
1/6/2011
|
$57.49
|
PP = $58.06
|
|
MB = $60.96
|
Most Recent Note - 2/4/2011 4:46:31 PM
G - Gains this week with light volume have it trading up after finding support near its 50 DMA line. More damaging losses below its recent chart low ($53.14 on 1/25/11) could raise greater concerns and trigger a more serious technical sell signal.
>>> The latest Featured Stock Update with an annotated graph appeared on 2/4/2011. Click here.
View all notes |
Alert me of new notes |
CANSLIM.net Company Profile |
SEC |
Zacks Reports |
StockTalk |
News |
Chart |
Request a new note
C
A N
S L
I M
|
OPEN
-
NASDAQ
Opentable Inc
INTERNET - Internet Software and Services
|
$84.80
|
+0.22
0.26% |
$86.90
|
1,139,702
150.73% of 50 DAV
50 DAV is 756,100
|
$85.95
-1.34%
|
1/5/2011
|
$74.05
|
PP = $76.79
|
|
MB = $80.63
|
Most Recent Note - 2/7/2011 5:35:51 PM
G - Closed near the session low with a small gain today with above average volume, rising further above its "max buy" level for another new all-time high. Color code was changed to green after getting extended from its prior base. Recent lows and its 50 DMA line define near-term chart support.
>>> The latest Featured Stock Update with an annotated graph appeared on 1/5/2011. Click here.
View all notes |
Alert me of new notes |
CANSLIM.net Company Profile |
SEC |
Zacks Reports |
StockTalk |
News |
Chart |
Request a new note
C
A N
S L
I M
|
ORCL
-
NASDAQ
Oracle Corp
COMPUTER SOFTWARE and SERVICES - Application Software
|
$32.98
|
+0.36
1.10% |
$33.29
|
22,782,919
81.00% of 50 DAV
50 DAV is 28,125,500
|
$33.56
-1.73%
|
1/20/2011
|
$32.31
|
PP = $32.37
|
|
MB = $33.99
|
Most Recent Note - 2/7/2011 5:38:22 PM
Y - Gain today with quiet volume followed mild distributional pressure. Perched above its pivot point after hitting a new 52-week high last week. Near-term support to watch is its 50 DMA line.
>>> The latest Featured Stock Update with an annotated graph appeared on 1/7/2011. Click here.
View all notes |
Alert me of new notes |
CANSLIM.net Company Profile |
SEC |
Zacks Reports |
StockTalk |
News |
Chart |
Request a new note
C
A N
S L
I M
|
Symbol/Exchange
Company Name
Industry Group |
PRICE |
CHANGE
(%Change) |
Day High |
Volume
(% DAV)
(% 50 day avg vol) |
52 Wk Hi
% From Hi |
Featured
Date |
Price
Featured |
Pivot Featured |
|
Max Buy |
PAY
-
NYSE
Verifone Systems Inc
COMPUTER HARDWARE - Transaction Automation Systems
|
$44.21
|
+1.23
2.86% |
$44.49
|
1,289,733
85.53% of 50 DAV
50 DAV is 1,508,000
|
$44.87
-1.47%
|
1/27/2011
|
$41.77
|
PP = $44.97
|
|
MB = $47.22
|
Most Recent Note - 2/7/2011 3:57:10 PM
Y - Today's 5th consecutive gain has it trading up from its 50 DMA line toward its pivot point ($44.97 = its 1/13/11 high plus 10 cents) which has been corrected. Gains above its pivot point with at least +50% above average volume may trigger a new (or add-on) technical buy signal.
>>> The latest Featured Stock Update with an annotated graph appeared on 1/27/2011. Click here.
View all notes |
Alert me of new notes |
CANSLIM.net Company Profile |
SEC |
Zacks Reports |
StockTalk |
News |
Chart |
Request a new note
C
A N
S L
I M
|
PCLN
-
NASDAQ
Priceline.Com Inc
INTERNET - Internet Software and Services
|
$437.20
|
+3.77
0.87% |
$441.62
|
953,821
102.42% of 50 DAV
50 DAV is 931,300
|
$444.95
-1.74%
|
11/1/2002
|
$399.55
|
PP = $428.20
|
|
MB = $449.61
|
Most Recent Note - 2/4/2011 4:53:44 PM
Y - Trading in a tight range near its 52-week high since its 1/05/11 technical breakout, consolidating above its 50 DMA line and above its pivot point yet below its "max buy" level.
>>> The latest Featured Stock Update with an annotated graph appeared on 1/2/2011. Click here.
View all notes |
Alert me of new notes |
CANSLIM.net Company Profile |
SEC |
Zacks Reports |
StockTalk |
News |
Chart |
Request a new note
C
A N
S L
I M
|
RAX
-
NYSE
Rackspace Hosting Inc
INTERNET - Internet Software and; Services
|
$36.79
|
+0.70
1.94% |
$37.10
|
1,753,308
102.25% of 50 DAV
50 DAV is 1,714,800
|
$36.53
0.71%
|
1/10/2011
|
$22.84
|
PP = $32.76
|
|
MB = $34.40
|
Most Recent Note - 2/7/2011 5:32:40 PM
G - Small gap up on average volume today for a new high close, more extended from any sound base. Found prompt support near its 50 DMA line recently
>>> The latest Featured Stock Update with an annotated graph appeared on 12/31/2010. Click here.
View all notes |
Alert me of new notes |
CANSLIM.net Company Profile |
SEC |
Zacks Reports |
StockTalk |
News |
Chart |
Request a new note
C
A N
S L
I M
|
ROVI
-
NASDAQ
Rovi Corp
COMPUTER SOFTWARE andamp; SERVICES - Security Software andamp; Services
|
$64.77
|
+1.09
1.71% |
$65.50
|
1,120,947
67.14% of 50 DAV
50 DAV is 1,669,600
|
$69.50
-6.81%
|
10/29/2010
|
$49.99
|
PP = $53.10
|
|
MB = $55.76
|
Most Recent Note - 2/4/2011 4:57:24 PM
G - Consolidating above its 50 DMA line after finding support near that important short-term average. The 1/10/11 low ($58.51) defines another near-term chart support level to watch.
>>> The latest Featured Stock Update with an annotated graph appeared on 1/25/2011. Click here.
View all notes |
Alert me of new notes |
CANSLIM.net Company Profile |
SEC |
Zacks Reports |
StockTalk |
News |
Chart |
Request a new note
C
A N
S L
I M
|
TIBX
-
NASDAQ
Tibco Software Inc
COMPUTER SOFTWARE and SERVICES - Business Software and Services
|
$24.57
|
+0.31
1.28% |
$24.77
|
1,818,939
66.04% of 50 DAV
50 DAV is 2,754,200
|
$24.50
0.29%
|
2/1/2011
|
$24.35
|
PP = $22.18
|
|
MB = $23.29
|
Most Recent Note - 2/4/2011 5:02:14 PM
G - Small gain today for a new 52-week high with light volume. Rose from an orderly flat base this week and quickly got extended from its "late-stage" or riskier base. Color code is changed to green, meanwhile disciplined investors may watch for light volume pullbacks toward prior resistance. Previously noted its streak of 4 quarterly comparisons with +25% earnings (good C criteria) increases with good sales revenues growth. It also has a good annual earnings (A criteria) history, and leadership (L criteria) in the Computer Software - Database group is reassuring.
>>> The latest Featured Stock Update with an annotated graph appeared on 2/2/2011. Click here.
View all notes |
Alert me of new notes |
CANSLIM.net Company Profile |
SEC |
Zacks Reports |
StockTalk |
News |
Chart |
Request a new note
C
A N
S L
I M
|
Symbol/Exchange
Company Name
Industry Group |
PRICE |
CHANGE
(%Change) |
Day High |
Volume
(% DAV)
(% 50 day avg vol) |
52 Wk Hi
% From Hi |
Featured
Date |
Price
Featured |
Pivot Featured |
|
Max Buy |
UA
-
NYSE
Under Armour Inc Cl A
CONSUMER NON-DURABLES - Textile - Apparel Clothing
|
$65.51
|
+1.81
2.84% |
$65.55
|
1,179,404
156.30% of 50 DAV
50 DAV is 754,600
|
$64.95
0.86%
|
1/27/2011
|
$58.31
|
PP = $56.99
|
|
MB = $59.84
|
Most Recent Note - 2/7/2011 5:27:56 PM
G - Gain with above average volume, rising further above recent $60 resistance for another new 52-week high today. It is extended from a previously noted "double bottom" base pattern. Recent highs and its 50 DMA line define chart support to watch in the $56 area.
>>> The latest Featured Stock Update with an annotated graph appeared on 2/1/2011. Click here.
View all notes |
Alert me of new notes |
CANSLIM.net Company Profile |
SEC |
Zacks Reports |
StockTalk |
News |
Chart |
Request a new note
C
A N
S L
I M
|
ULTA
-
NASDAQ
Ulta Salon Cosm & Frag
SPECIALTY RETAIL - Specialty Retail, Other
|
$40.39
|
+0.32
0.80% |
$40.63
|
426,476
66.96% of 50 DAV
50 DAV is 636,900
|
$40.34
0.12%
|
1/6/2011
|
$36.12
|
PP = $37.34
|
|
MB = $39.21
|
Most Recent Note - 2/7/2011 5:31:35 PM
G - Gain on lighter volume today, closing above its "max buy" level after hitting another new 52-week high. Its color code is changed to green after getting extended from a sound base pattern. Confirming gain on 2/03/11 with +79% above average volume. Its 50 DMA line defines important chart support to watch.
>>> The latest Featured Stock Update with an annotated graph appeared on 1/6/2011. Click here.
View all notes |
Alert me of new notes |
CANSLIM.net Company Profile |
SEC |
Zacks Reports |
StockTalk |
News |
Chart |
Request a new note
C
A N
S L
I M
|