You are not logged in.
This means you
CAN ONLY VIEW reports that were published prior to Monday, April 14, 2025.
You
MUST UPGRADE YOUR MEMBERSHIP if you want to see any current reports.
AFTER MARKET UPDATE - WEDNESDAY, FEBRUARY 6TH, 2013
Previous After Market Report Next After Market Report >>>
|
|
|
|
DOW |
+7.22 |
13,986.52 |
+0.05% |
|
Volume |
681,252,890 |
-3% |
|
Volume |
1,913,621,070 |
-8% |
|
NASDAQ |
-3.10 |
3,168.48 |
-0.10% |
|
Advancers |
1,767 |
57% |
|
Advancers |
1,335 |
52% |
|
S&P 500 |
+0.83 |
1,512.12 |
+0.05% |
|
Decliners |
1,217 |
39% |
|
Decliners |
1,088 |
43% |
|
Russell 2000 |
+3.07 |
911.29 |
+0.34% |
|
52 Wk Highs |
207 |
|
|
52 Wk Highs |
134 |
|
|
S&P 600 |
+2.21 |
509.97 |
+0.44% |
|
52 Wk Lows |
5 |
|
|
52 Wk Lows |
17 |
|
|
 |
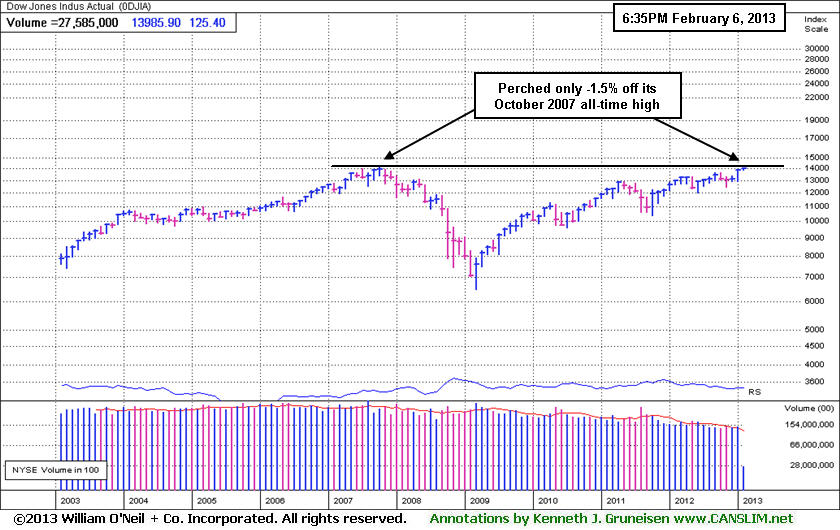
Major Averages Pause Within Reach of 2007 Highs
Kenneth J. Gruneisen - Passed the CAN SLIM® Master's Exam
The major averages ended mixed and little changed after enduring some profit taking pressure on Wednesday. The volume totals were reported lighter on the NYSE and on the Nasdaq exchange, indicating no great conviction from the institutional crowd. Breadth was positive as advancers led decliners by nearly a 3-2 margin on the NYSE and 6-5 on the Nasdaq exchange. The total number of stocks hitting new 52-week highs easily outnumbered new 52-week lows on the NYSE and on the Nasdaq exchange. There were 58 high-ranked companies from the CANSLIM.net Leaders List making new 52-week highs and appearing on the CANSLIM.net BreakOuts Page, down from the prior session total of 82 stocks. There were gains for 5 of the 11 high-ranked companies currently included on the Featured Stocks Page.
The market took a breather ahead of Thursday's monetary policy meeting in Europe. The central bank is expected to leave interest rates on hold and ECB President Draghi's euro zone outlook will garner attention. ECB policy meeting and summit of European leaders in Brussels.
As a result of the cautious tone, sector action was mixed. Shares of Express Scripts (ESRX -1.74%) were down as healthcare, energy and technology stocks paced decliners. Materials firms helped the market recover from its earlier decline with U.S. Steel Corp (X +2.43%) rising. Halliburton Co (HAL -1.47%) fell and Marathon Oil Corp (MRO -0.92%) edged lower after reporting a smaller-than-expected profit due to rising exploration costs. Apple Inc (AAPL -0.11%) failed to rally following positive comments by a well known fund manager in the Financial Times. Hewlett-Packard (HPQ +0.48%) inched higher on speculation the PC maker is considering a breakup of the company. Intel Corp (INTC -0.89%) and International Business Machines Inc (IBM -0.46%) also had a slightly negative bias.
Industrial stocks gave up ground, led by C.H. Robinson Worldwide Inc (CHRW -9.71%). Gains in telecommunication and utilities helped limit losses. Verizon Communications Inc's (VZ +0.43%) defensive characteristics pushed its shares up and Spectra Energy Corp (SE +3.64%) gained after topping earnings estimates. Also the earnings front, Ralph Lauren Corp (RL +5.89%) advanced after reporting better-than-expected quarterly results. Time Warner Cable Inc (TWC -0.14%) finished flat after profits topped analyst projections and it announced a dividend increase. Aflac Inc (AFL -4.32%) fell after reducing its full year profit forecast. The Walt Disney Co (DIS +0.42%) and Panera Bread Co (PNRA +0.80%) posted modest gains and Chipotle Mexican Grill Inc (CMG +5.72%) and Zynga Inc (ZNGA +9.12%) tallied bigger gains amid the wave of earnings news.
Notable profit tallies included News Corp (NWS +0.24%), Visa Inc (V +0.81%) and Yelp Inc (YELP +5.67%) reporting after the close.
In fixed-income, Treasury prices were higher as the 10-year note gained 11/32 to yield 1.96% and the 30-year bond increased 25/32 to yield 3.17%.
The latest rally has produced a few action worthy candidates meeting all of the fact-based investment system's criteria. Selectivity and discipline are required, as always. Investors may consider new buying efforts in stocks meeting all key criteria, as the market's (M criteria) confirmed uptrend has been comprised by great leadership (stocks hitting new 52-week highs) in the broader market. Widespread gains helped all of the major averages blast higher, and the benchmark S&P 500 Index is perched at its best level in more than five years and only -4% off its October 2007 all-time high.
Watch for an announcement via email concerning the next WEBCAST. The webcast will also be available via an updated link highlighted at the top of the Premium Member Homepage.
PICTURED: The Dow Jones Industrail Average has been hovering near the psychologically important 14,000 level. Its monthly graph shows it currently perched only -1.5% off its October 2007 all-time high. Subsequent gains into new high territory may help the broader market gain more momentum and may attract greater interest in stocks overall.
|
 Kenneth J. Gruneisen started out as a licensed stockbroker in August 1987, a couple of months prior to the historic stock market crash that took the Dow Jones Industrial Average down -22.6% in a single day. He has published daily fact-based fundamental and technical analysis on high-ranked stocks online for two decades. Through FACTBASEDINVESTING.COM, Kenneth provides educational articles, news, market commentary, and other information regarding proven investment systems that work in good times and bad.
Comments contained in the body of this report are technical opinions only and are not necessarily those of Gruneisen Growth Corp. The material herein has been obtained from sources believed to be reliable and accurate, however, its accuracy and completeness cannot be guaranteed. Our firm, employees, and customers may effect transactions, including transactions contrary to any recommendation herein, or have positions in the securities mentioned herein or options with respect thereto. Any recommendation contained in this report may not be suitable for all investors and it is not to be deemed an offer or solicitation on our part with respect to the purchase or sale of any securities. |
|
 |
Financial and Tech Indices' Mild Gains Were Offset by Other Weakness
Kenneth J. Gruneisen - Passed the CAN SLIM® Master's Exam
Financial shares ended with a slightly positive bias as the Bank Index ($BKX +0.26%) and Broker/Dealer Index ($XBD +0.29%) posted small gains on Wednesday. The Internet Index ($IIX +0.58%) and Semiconductor Index ($SOX +0.21%) led the tech sector higher while the Networking Index ($NWX +0.09%) and the Biotechnology Index ($BTK -0.09%) finished flat. The Oil Services Index ($OSX -0.39%) edged lower and the Gold & Silver Index ($XAU +0.63%) posted a modest gain while the Healthcare Index ($HMO +0.14%), Retail Index ($RLX -0.10%), and Integrated Oil Index ($XOI +0.16%) each was little changed at the session's close.
Charts courtesy www.stockcharts.com
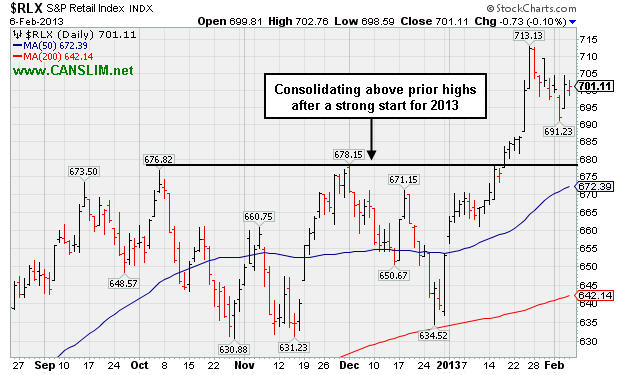
PICTURED: The Retail Index ($RLX -0.10%) is consolidating above prior highs after a strong start for 2013.
| Oil Services |
$OSX |
246.43 |
-0.97 |
-0.39% |
+11.93% |
| Healthcare |
$HMO |
2,755.55 |
+3.78 |
+0.14% |
+9.60% |
| Integrated Oil |
$XOI |
1,356.25 |
+2.10 |
+0.16% |
+9.21% |
| Semiconductor |
$SOX |
421.56 |
+0.87 |
+0.21% |
+9.76% |
| Networking |
$NWX |
246.66 |
+0.21 |
+0.09% |
+8.88% |
| Internet |
$IIX |
359.12 |
+2.08 |
+0.58% |
+9.82% |
| Broker/Dealer |
$XBD |
106.82 |
+0.31 |
+0.29% |
+13.24% |
| Retail |
$RLX |
701.11 |
-0.73 |
-0.10% |
+7.36% |
| Gold & Silver |
$XAU |
152.97 |
+0.96 |
+0.63% |
-7.63% |
| Bank |
$BKX |
55.04 |
+0.14 |
+0.26% |
+7.33% |
| Biotech |
$BTK |
1,684.56 |
-1.51 |
-0.09% |
+8.89% |
|
|
|
 |
Consolidating Above Upward Trendline and 50-Day Average
Kenneth J. Gruneisen - Passed the CAN SLIM® Master's Exam
Rackspace Hosting Inc (RAX -$0.52 or -0.69% to $75.12) is consolidating above important support at its multi-month upward trendline and its 50-day moving average (DMA) line shown virtually coinciding with each other on the annotated graph below. That defines important chart support to watch above prior highs in the $70 area, where any violations may trigger technical sell signals. Experienced investors know that volume and volatility often increase near earnings news. It was recently noted with caution - "It is extended from the previously noted base. Company will announce its fourth quarter 2012 financial results on Tuesday, February 12, 2013 after the close."
RAX tallied an additional volume-driven gain for a new high two days after it was last shown in this FSU section with an annotated graph on 1/22/13 under the headline, "Pulled Back After Getting Extended Following Technical Breakout". It reported earnings +36% on +27% sales revenues for the quarter ended September 30, 2012 versus the year ago period and its fundamentals remain strong. The past 11 quarterly earnings comparisons have shown better than +25% increases (C criteria). Its annual earnings history (A criteria) since trading began in 2008 has been good. Increasing institutional ownership (I criteria) is a reassuring sign, as the number of top-rated funds owning its shares rose from 408 in Dec '10 to 656 in Dec '12.

|
|
|
Color Codes Explained :
Y - Better candidates highlighted by our
staff of experts.
G - Previously featured
in past reports as yellow but may no longer be buyable under the
guidelines.
***Last / Change / Volume data in this table is the closing quote data***
Symbol/Exchange
Company Name
Industry Group |
PRICE |
CHANGE
(%Change) |
Day High |
Volume
(% DAV)
(% 50 day avg vol) |
52 Wk Hi
% From Hi |
Featured
Date |
Price
Featured |
Pivot Featured |
|
Max Buy |
CELG
-
NASDAQ
Celgene Corp
DRUGS - Drug Manufacturers - Major
|
$97.89
|
-1.87
-1.87% |
$99.69
|
3,277,036
89.05% of 50 DAV
50 DAV is 3,680,000
|
$102.29
-4.30%
|
12/11/2012
|
$82.24
|
PP = $81.34
|
|
MB = $85.41
|
Most Recent Note - 2/4/2013 6:19:32 PM
G - Perched near its all-time high, very extended from its prior base. See latest FSU analysis for more details and a new annotated graph.
>>> The latest Featured Stock Update with an annotated graph appeared on 2/4/2013. Click here.
View all notes |
Alert me of new notes |
CANSLIM.net Company Profile |
SEC |
Zacks Reports |
StockTalk |
News |
Chart |
Request a new note
C
A N
S L
I M


|
CFNL
-
NASDAQ
Cardinal Financial Corp
BANKING - Regional - Southeast Banks
|
$16.30
|
-0.12
-0.73% |
$16.33
|
118,041
53.90% of 50 DAV
50 DAV is 219,000
|
$16.90
-3.55%
|
12/3/2012
|
$15.20
|
PP = $16.31
|
|
MB = $17.13
|
Most Recent Note - 2/5/2013 3:49:27 PM
Y - Rebounding today with below average volume while rising back above its pivot point and still consolidating just above its 50 DMA line defining important near-term support. Subsequent losses leading to a damaging violation and a slump below the recent low ($15.74 on 1/18/13) would raise concerns and trigger technical sell signals.
>>> The latest Featured Stock Update with an annotated graph appeared on 1/31/2013. Click here.
View all notes |
Alert me of new notes |
CANSLIM.net Company Profile |
SEC |
Zacks Reports |
StockTalk |
News |
Chart |
Request a new note
C
A N
S L
I M
|
CMCSA
-
NASDAQ
Comcast Corp Cl A
MEDIA - CATV Systems
|
$38.73
|
-0.51
-1.30% |
$39.15
|
11,499,799
97.43% of 50 DAV
50 DAV is 11,802,600
|
$40.28
-3.85%
|
12/3/2012
|
$37.08
|
PP = $38.06
|
|
MB = $39.96
|
Most Recent Note - 2/5/2013 3:39:08 PM
Y - Rallying up from support near prior highs and its 50 DMA line with a solid volume-driven gain today. A subsequent violation of the latest low ($37.81 on 2/04/13) would trigger a technical sell signal.
>>> The latest Featured Stock Update with an annotated graph appeared on 1/29/2013. Click here.
View all notes |
Alert me of new notes |
CANSLIM.net Company Profile |
SEC |
Zacks Reports |
StockTalk |
News |
Chart |
Request a new note
C
A N
S L
I M
|
KORS
-
NYSE
Michael Kors Hldgs Ltd
RETAIL - Apparel Stores
|
$55.87
|
+0.49
0.88% |
$56.50
|
4,479,338
127.78% of 50 DAV
50 DAV is 3,505,500
|
$60.00
-6.88%
|
1/23/2013
|
$54.98
|
PP = $58.72
|
|
MB = $61.66
|
Most Recent Note - 2/5/2013 3:54:39 PM
Y - Managed an impressive "positive reversal" with a gain on heavy volume after a weak start today that tested support at its 50 DMA line following 6 consecutive losses. It slumped since a noted "negative reversal" after touching a new 52-week high on 1/28/13, and it was previously noted with caution - "Disciplined investors may watch for volume-driven gains above the pivot point to trigger a proper technical buy signal before taking action. See the latest FSU analysis under the headline, 'High-Ranked Luxury Apparel Firm Worthy For Watchlist - Wednesday, January 23, 2013', for more details and an annotated weekly graph."
>>> The latest Featured Stock Update with an annotated graph appeared on 1/23/2013. Click here.
View all notes |
Alert me of new notes |
CANSLIM.net Company Profile |
SEC |
Zacks Reports |
StockTalk |
News |
Chart |
Request a new note
C
A N
S L
I M
|
MIDD
-
NASDAQ
Middleby Corp
MANUFACTURING - Diversified Machinery
|
$148.15
|
+0.63
0.43% |
$149.37
|
100,110
110.37% of 50 DAV
50 DAV is 90,700
|
$148.40
-0.17%
|
10/8/2012
|
$118.46
|
PP = $122.67
|
|
MB = $128.80
|
Most Recent Note - 2/5/2013 3:36:13 PM
G - Volume is above average while rallying and hitting another new all-time high today, getting even more extended from any sound base. Prior highs and its 50 DMA line define important near-term chart support in the $132-134 area.
>>> The latest Featured Stock Update with an annotated graph appeared on 1/30/2013. Click here.
View all notes |
Alert me of new notes |
CANSLIM.net Company Profile |
SEC |
Zacks Reports |
StockTalk |
News |
Chart |
Request a new note
C
A N
S L
I M
|
Symbol/Exchange
Company Name
Industry Group |
PRICE |
CHANGE
(%Change) |
Day High |
Volume
(% DAV)
(% 50 day avg vol) |
52 Wk Hi
% From Hi |
Featured
Date |
Price
Featured |
Pivot Featured |
|
Max Buy |
N
-
NYSE
Netsuite Inc
DIVERSIFIED SERVICES - Business/Management Services
|
$67.80
|
-0.66
-0.96% |
$68.87
|
335,068
91.90% of 50 DAV
50 DAV is 364,600
|
$75.75
-10.50%
|
12/12/2012
|
$64.75
|
PP = $67.12
|
|
MB = $70.48
|
Most Recent Note - 2/5/2013 5:48:32 PM
G - Posted a gain today after slumping toward its 50 DMA line. Following a worrisome "negative reversal" on 2/01/13 after initially gapping up for a new 52-week high, the mid-day report cautioned - "Reported earnings +20% on +33% sales revenues for the Dec '12 quarter, below the +25% minimum earnings guideline (C criteria) raising fundamental concerns." See the latest FSU analysis for more details and a new annotated graph.
>>> The latest Featured Stock Update with an annotated graph appeared on 2/5/2013. Click here.
View all notes |
Alert me of new notes |
CANSLIM.net Company Profile |
SEC |
Zacks Reports |
StockTalk |
News |
Chart |
Request a new note
C
A N
S L
I M
|
NP
-
NYSE
Neenah Paper Inc
CONSUMER NON-DURABLES - Paper and Paper Products
|
$30.32
|
-0.12
-0.39% |
$30.42
|
55,609
71.29% of 50 DAV
50 DAV is 78,000
|
$32.57
-6.91%
|
1/25/2013
|
$31.80
|
PP = $31.76
|
|
MB = $33.35
|
Most Recent Note - 2/4/2013 6:39:09 PM
Y - Remains below its pivot point today, consolidating following a spurt of volume-driven losses. A "negative reversal" for a loss on heavy volume after hitting a new 52-week high on 1/25/13 was noted as a worrisome sign of distributional pressure as it failed to finish strong and did not clinch a technical buy signal.
>>> The latest Featured Stock Update with an annotated graph appeared on 1/25/2013. Click here.
View all notes |
Alert me of new notes |
CANSLIM.net Company Profile |
SEC |
Zacks Reports |
StockTalk |
News |
Chart |
Request a new note
C
A N
S L
I M
|
NSR
-
NYSE
Neustar Inc
TELECOMMUNICATIONS - Diversified Communication Serv
|
$47.07
|
+2.07
4.60% |
$47.07
|
1,000,477
233.21% of 50 DAV
50 DAV is 429,000
|
$46.49
1.25%
|
12/11/2012
|
$41.85
|
PP = $41.41
|
|
MB = $43.48
|
 Most Recent Note - 2/6/2013 12:33:30 PM
G - Today's volume-driven gain helped it touch another new 52-week high, getting more extended from its prior base. Its 50 DMA line (now $42.69)defines near-term support above its prior base.
>>> The latest Featured Stock Update with an annotated graph appeared on 2/1/2013. Click here.
View all notes |
Alert me of new notes |
CANSLIM.net Company Profile |
SEC |
Zacks Reports |
StockTalk |
News |
Chart |
Request a new note
C
A N
S L
I M
|
RAX
-
NYSE
Rackspace Hosting Inc
INTERNET - Internet Software and; Services
|
$75.12
|
-0.52
-0.69% |
$76.15
|
750,636
64.93% of 50 DAV
50 DAV is 1,156,000
|
$81.36
-7.67%
|
12/18/2012
|
$71.88
|
PP = $70.10
|
|
MB = $73.61
|
Most Recent Note - 2/6/2013 7:25:43 PM
G - Consolidating above important chart support at an upward trendline and its 50 DMA line. Recently noted with caution - "It is extended from the previously noted base. Company will announce its fourth quarter 2012 financial results on Tuesday, February 12, 2013 after the close." See the latest FSU analysis for more details and a new annotated graph.
>>> The latest Featured Stock Update with an annotated graph appeared on 2/6/2013. Click here.
View all notes |
Alert me of new notes |
CANSLIM.net Company Profile |
SEC |
Zacks Reports |
StockTalk |
News |
Chart |
Request a new note
C
A N
S L
I M
|
RNF
-
NYSE
Rentech Nitrogen Ptnr Lp
CHEMICALS - Agricultural Chemicals
|
$47.80
|
+0.07
0.15% |
$48.35
|
175,822
56.44% of 50 DAV
50 DAV is 311,500
|
$49.18
-2.81%
|
11/1/2012
|
$39.11
|
PP = $40.15
|
|
MB = $42.16
|
Most Recent Note - 2/5/2013 3:47:45 PM
G - Retreating from its 52-week high today with its 2nd loss on above average volume in the span of 3 sessions, a sign it is encountering more distributional pressure. Previously noted - "Extended from its prior base. Prior highs and 50 DMA line coincide near $41 defining important chart support to watch on pullbacks."
>>> The latest Featured Stock Update with an annotated graph appeared on 1/24/2013. Click here.
View all notes |
Alert me of new notes |
CANSLIM.net Company Profile |
SEC |
Zacks Reports |
StockTalk |
News |
Chart |
Request a new note
C
A N
S L
I M
|
Symbol/Exchange
Company Name
Industry Group |
PRICE |
CHANGE
(%Change) |
Day High |
Volume
(% DAV)
(% 50 day avg vol) |
52 Wk Hi
% From Hi |
Featured
Date |
Price
Featured |
Pivot Featured |
|
Max Buy |
VRX
-
NYSE
Valeant Pharmaceuticals
DRUGS - Drug Manufacturers - Other
|
$66.91
|
+0.27
0.41% |
$66.99
|
627,611
40.65% of 50 DAV
50 DAV is 1,544,100
|
$67.65
-1.09%
|
12/20/2012
|
$60.24
|
PP = $61.21
|
|
MB = $64.27
|
Most Recent Note - 2/4/2013 6:35:07 PM
G - Retreated from its 52-week high with higher (near average) volume behind today's loss. It is extended from its prior base, and its 50 DMA coincides with prior highs near $61 defining near-term chart support to watch on pullbacks.
>>> The latest Featured Stock Update with an annotated graph appeared on 1/28/2013. Click here.
View all notes |
Alert me of new notes |
CANSLIM.net Company Profile |
SEC |
Zacks Reports |
StockTalk |
News |
Chart |
Request a new note
C
A N
S L
I M
|
|
|
|
THESE ARE NOT BUY RECOMMENDATIONS!
Comments contained in the body of this report are technical
opinions only. The material herein has been obtained
from sources believed to be reliable and accurate, however,
its accuracy and completeness cannot be guaranteed.
This site is not an investment advisor, hence it does
not endorse or recommend any securities or other investments.
Any recommendation contained in this report may not
be suitable for all investors and it is not to be deemed
an offer or solicitation on our part with respect to
the purchase or sale of any securities. All trademarks,
service marks and trade names appearing in this report
are the property of their respective owners, and are
likewise used for identification purposes only.
This report is a service available
only to active Paid Premium Members.
You may opt-out of receiving report notifications
at any time. Questions or comments may be submitted
by writing to Premium Membership Services 665 S.E. 10 Street, Suite 201 Deerfield Beach, FL 33441-5634 or by calling 1-800-965-8307
or 954-785-1121.
|
|
|

