***Last / Change / Volume data in this table is the closing quote data***
Symbol/Exchange
Company Name
Industry Group |
PRICE |
CHANGE
(%Change) |
Day High |
Volume
(% DAV)
(% 50 day avg vol) |
52 Wk Hi
% From Hi |
Featured
Date |
Price
Featured |
Pivot Featured |
|
Max Buy |
ADS
-
NYSE
Alliance Data Sys Corp
COMPUTER SOFTWARE and SERVICES - Information and Delivery Service
|
$115.97
|
+0.40
0.35% |
$116.71
|
738,016
105.57% of 50 DAV
50 DAV is 699,100
|
$116.05
-0.07%
|
1/17/2012
|
$108.24
|
PP = $107.43
|
|
MB = $112.80
|
Most Recent Note - 2/3/2012 6:14:04 PM
G - Color code is changed to green after rallying to new all-time highs above its "max buy" level with volume-driven gains. Getting extended from its latest base.
>>> The latest Featured Stock Update with an annotated graph appeared on 1/17/2012. Click here.
View all notes |
Alert me of new notes |
CANSLIM.net Company Profile |
SEC |
Zacks Reports |
StockTalk |
News |
Chart |
Request a new note
C
A N
S L
I M


|
ALXN
-
NASDAQ
Alexion Pharmaceuticals
DRUGS - Drug Manufacturers - Other
|
$79.75
|
+0.88
1.11% |
$80.08
|
897,114
78.78% of 50 DAV
50 DAV is 1,138,800
|
$80.97
-1.51%
|
11/30/2011
|
$68.66
|
PP = $70.52
|
|
MB = $74.05
|
Most Recent Note - 2/3/2012 6:16:05 PM
G - Hit a new 52-week high today with its 4th consecutive gain. Extended from its prior base, while prior resistance in the $70 area defines chart support coinciding with its 50 DMA line.
>>> The latest Featured Stock Update with an annotated graph appeared on 1/13/2012. Click here.
View all notes |
Alert me of new notes |
CANSLIM.net Company Profile |
SEC |
Zacks Reports |
StockTalk |
News |
Chart |
Request a new note
C
A N
S L
I M
|
BODY
-
NASDAQ
Body Central Corp
RETAIL - Catalog andamp; Mail Order Houses
|
$25.00
|
-0.37
-1.46% |
$25.47
|
94,919
63.03% of 50 DAV
50 DAV is 150,600
|
$27.24
-8.22%
|
1/27/2012
|
$26.69
|
PP = $25.46
|
|
MB = $26.73
|
Most Recent Note - 2/3/2012 6:19:14 PM
Y - Pulled back from its 52-week high with a 3rd consecutive loss with above average volume today. It has slumped just under its pivot point, trading near its prior highs noted as initial support to watch on pullbacks.
>>> The latest Featured Stock Update with an annotated graph appeared on 1/27/2012. Click here.
View all notes |
Alert me of new notes |
CANSLIM.net Company Profile |
SEC |
Zacks Reports |
StockTalk |
News |
Chart |
Request a new note
C
A N
S L
I M
|
CATM
-
NASDAQ
Cardtronics Inc
DIVERSIFIED SERVICES - Business/Management Services
|
$26.27
|
+0.91
3.59% |
$26.31
|
628,430
154.44% of 50 DAV
50 DAV is 406,900
|
$28.74
-8.59%
|
12/23/2011
|
$28.64
|
PP = $28.56
|
|
MB = $29.99
|
 Most Recent Note - 2/6/2012 2:10:43 PM
G - Gapped down today then managed a positive reversal. Found support after it tested its 200 DMA line last week. Reported earnings +38% on +29% sales revenues for the quarter ended December 31, 2011 versus the year ago period. A rebound above its 50 DMA line is needed for its technical stance and outlook to improve.
>>> The latest Featured Stock Update with an annotated graph appeared on 1/30/2012. Click here.
View all notes |
Alert me of new notes |
CANSLIM.net Company Profile |
SEC |
Zacks Reports |
StockTalk |
News |
Chart |
Request a new note
C
A N
S L
I M
|
CDNS
-
NASDAQ
Cadence Design Systems
COMPUTER SOFTWARE and SERVICES - Technical and System Software
|
$11.62
|
-0.11
-0.94% |
$11.75
|
2,903,829
101.62% of 50 DAV
50 DAV is 2,857,400
|
$11.84
-1.86%
|
2/3/2012
|
$11.66
|
PP = $11.15
|
|
MB = $11.71
|
Most Recent Note - 2/6/2012 2:13:48 PM
Y - Quietly holding its ground today perched near its 52-week high and no resistance remains due to overhead supply following strong technical action. See the latest FSU analysis for more details and a new annotated graph.
>>> The latest Featured Stock Update with an annotated graph appeared on 2/3/2012. Click here.
View all notes |
Alert me of new notes |
CANSLIM.net Company Profile |
SEC |
Zacks Reports |
StockTalk |
News |
Chart |
Request a new note
C
A N
S L
I M
|
Symbol/Exchange
Company Name
Industry Group |
PRICE |
CHANGE
(%Change) |
Day High |
Volume
(% DAV)
(% 50 day avg vol) |
52 Wk Hi
% From Hi |
Featured
Date |
Price
Featured |
Pivot Featured |
|
Max Buy |
CELG
-
NASDAQ
Celgene Corp
DRUGS - Drug Manufacturers - Major
|
$73.53
|
+0.32
0.43% |
$73.85
|
2,060,785
60.05% of 50 DAV
50 DAV is 3,432,000
|
$75.11
-2.11%
|
2/2/2012
|
$74.16
|
PP = $75.21
|
|
MB = $78.97
|
Most Recent Note - 2/3/2012 6:25:20 PM
Y - Color code was changed to yellow while forming an advanced "3-weeks tight" base pattern and stubbornly holding its ground within close striking distance of its all-time high ($77.39 in Aug '08). See the latest FSU analysis for more details and a new annotated weekly graph.
>>> The latest Featured Stock Update with an annotated graph appeared on 2/2/2012. Click here.
View all notes |
Alert me of new notes |
CANSLIM.net Company Profile |
SEC |
Zacks Reports |
StockTalk |
News |
Chart |
Request a new note
C
A N
S L
I M
|
FEIC
-
NASDAQ
F E I Co
ELECTRONICS - Diversified Electronics
|
$45.83
|
-0.65
-1.40% |
$46.30
|
174,579
67.22% of 50 DAV
50 DAV is 259,700
|
$47.04
-2.57%
|
12/7/2011
|
$41.41
|
PP = $42.35
|
|
MB = $44.47
|
Most Recent Note - 2/3/2012 6:26:41 PM
G - Finished at its best-ever close with today's 4th consecutive gain, getting more extended from its prior base. Prior highs in the $43 area define initial chart support.
>>> The latest Featured Stock Update with an annotated graph appeared on 1/25/2012. Click here.
View all notes |
Alert me of new notes |
CANSLIM.net Company Profile |
SEC |
Zacks Reports |
StockTalk |
News |
Chart |
Request a new note
C
A N
S L
I M
|
GNC
-
NYSE
G N C Holdings Inc
RETAIL - Drug Stores
|
$28.47
|
+0.10
0.35% |
$28.84
|
657,183
63.39% of 50 DAV
50 DAV is 1,036,700
|
$29.67
-4.04%
|
1/19/2012
|
$28.99
|
PP = $29.60
|
|
MB = $31.08
|
Most Recent Note - 2/3/2012 6:28:26 PM
Y - Color code is changed to yellow after rebounding above its 50 DMA line with today's gain, helping its technical stance and outlook to improve.
>>> The latest Featured Stock Update with an annotated graph appeared on 1/19/2012. Click here.
View all notes |
Alert me of new notes |
CANSLIM.net Company Profile |
SEC |
Zacks Reports |
StockTalk |
News |
Chart |
Request a new note
C
A N
S L
I M
|
HMSY
-
NASDAQ
H M S Holdings Corp
COMPUTER SOFTWARE and SERVICES - Healthcare Information Service
|
$34.34
|
-0.04
-0.12% |
$34.72
|
347,510
39.60% of 50 DAV
50 DAV is 877,600
|
$34.77
-1.24%
|
10/27/2011
|
$26.44
|
PP = $28.37
|
|
MB = $29.79
|
Most Recent Note - 2/3/2012 6:29:02 PM
G - Today's gain with below average volume led to its best-ever close. No resistance remains to hinder its progress, but it is extended from its prior base. Its 50 DMA line and prior highs near $32 define near-term chart support to watch.
>>> The latest Featured Stock Update with an annotated graph appeared on 12/28/2011. Click here.
View all notes |
Alert me of new notes |
CANSLIM.net Company Profile |
SEC |
Zacks Reports |
StockTalk |
News |
Chart |
Request a new note
C
A N
S L
I M
|
ISRG
-
NASDAQ
Intuitive Surgical Inc
HEALTH SERVICES - Medical Appliances and Equipment
|
$491.39
|
-0.62
-0.13% |
$494.26
|
357,894
95.18% of 50 DAV
50 DAV is 376,000
|
$495.53
-0.84%
|
12/20/2011
|
$442.43
|
PP = $449.16
|
|
MB = $471.62
|
Most Recent Note - 2/3/2012 1:23:41 PM
G - Up again today for its 4th consecutive gain and another new all-time high. Color code was changed to green after rallying beyond the "max buy" level that was cited. Reported earnings +24% on +28% sales revenues for the quarter ended December 31, 2011 versus the year ago period.
>>> The latest Featured Stock Update with an annotated graph appeared on 1/18/2012. Click here.
View all notes |
Alert me of new notes |
CANSLIM.net Company Profile |
SEC |
Zacks Reports |
StockTalk |
News |
Chart |
Request a new note
C
A N
S L
I M
|
Symbol/Exchange
Company Name
Industry Group |
PRICE |
CHANGE
(%Change) |
Day High |
Volume
(% DAV)
(% 50 day avg vol) |
52 Wk Hi
% From Hi |
Featured
Date |
Price
Featured |
Pivot Featured |
|
Max Buy |
LULU
-
NASDAQ
Lululemon Athletica
MANUFACTURING - Textile Manufacturing
|
$64.94
|
+0.36
0.56% |
$65.27
|
1,325,071
34.99% of 50 DAV
50 DAV is 3,787,400
|
$65.09
-0.23%
|
1/10/2012
|
$60.97
|
PP = $59.46
|
|
MB = $62.43
|
Most Recent Note - 2/3/2012 6:30:41 PM
G - Inched up for its best-ever close with another gain today backed by below average volume. No resistance remains due to overhead supply, but it is extended from the base pattern previously noted.
>>> The latest Featured Stock Update with an annotated graph appeared on 1/10/2012. Click here.
View all notes |
Alert me of new notes |
CANSLIM.net Company Profile |
SEC |
Zacks Reports |
StockTalk |
News |
Chart |
Request a new note
C
A N
S L
I M
|
MA
-
NYSE
Mastercard Inc Cl A
DIVERSIFIED SERVICES - Business/Management Services
|
$391.31
|
+0.99
0.25% |
$393.00
|
1,125,205
103.53% of 50 DAV
50 DAV is 1,086,800
|
$391.30
0.00%
|
2/2/2012
|
$379.05
|
PP = $381.32
|
|
MB = $400.39
|
Most Recent Note - 2/3/2012 6:32:14 PM
Y - Hit new 52-week and all-time highs with above average volume behind today's 6th consecutive gain. It rallied above the new pivot point cited and triggered a technical buy signal, breaking out from a "double bottom" base pattern. Reported earnings +28% on +20% sales revenues for the quarter ended December 31, 2011 versus the year ago period.
>>> The latest Featured Stock Update with an annotated graph appeared on 1/3/2012. Click here.
View all notes |
Alert me of new notes |
CANSLIM.net Company Profile |
SEC |
Zacks Reports |
StockTalk |
News |
Chart |
Request a new note
C
A N
S L
I M
|
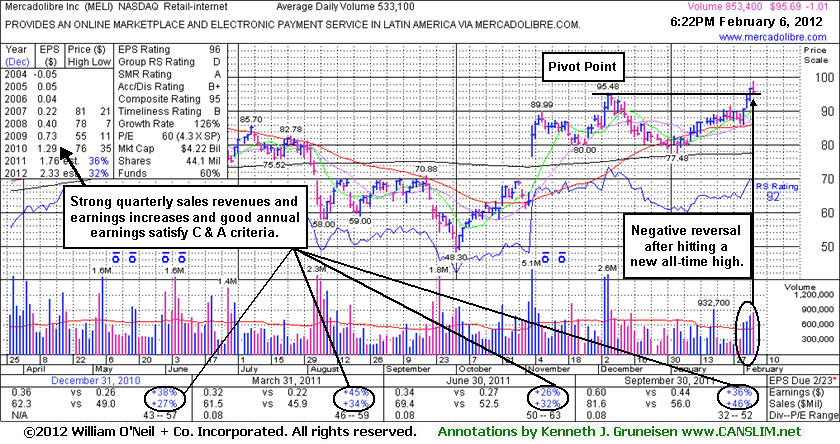
MELI
-
NASDAQ
Mercadolibre Inc
INTERNET - Internet Software and; Services
|
$95.69
|
-1.01
-1.04% |
$98.75
|
853,430
160.09% of 50 DAV
50 DAV is 533,100
|
$96.89
-1.24%
|
2/6/2012
|
$97.09
|
PP = $95.58
|
|
MB = $100.36
|
Most Recent Note - 2/6/2012 6:47:17 PM
Y - Color code was changed to yellow with new pivot point cited based on its 12/06/11 high plus 10 cents after an 8-week cup shaped base without a handle. Reversed into the red after touching a new all-time high today following 3 consecutive gains with above average volume. Technically it broke out on 2/03/12 with its volume-driven gain and strong close. See the latest FSU analysis for more details and a new annotated graph.
>>> The latest Featured Stock Update with an annotated graph appeared on 2/6/2012. Click here.
View all notes |
Alert me of new notes |
CANSLIM.net Company Profile |
SEC |
Zacks Reports |
StockTalk |
News |
Chart |
Request a new note
C
A N
S L
I M
|
MKTX
-
NASDAQ
Marketaxess Holdings Inc
FINANCIAL SERVICES - Investment Brokerage - Nationa
|
$32.91
|
-1.44
-4.19% |
$34.13
|
167,776
91.53% of 50 DAV
50 DAV is 183,300
|
$35.42
-7.09%
|
10/28/2011
|
$29.79
|
PP = $31.05
|
|
MB = $32.60
|
Most Recent Note - 2/6/2012 2:07:45 PM
G - Pulling back today following a streak of 4 consecutive gains into new high territory. Prior highs in the $31-32 area define initial chart support to watch.
>>> The latest Featured Stock Update with an annotated graph appeared on 1/24/2012. Click here.
View all notes |
Alert me of new notes |
CANSLIM.net Company Profile |
SEC |
Zacks Reports |
StockTalk |
News |
Chart |
Request a new note
C
A N
S L
I M
|
OSIS
-
NASDAQ
O S I Systems Inc
ELECTRONICS - Semiconductor Equipment and Mate
|
$55.56
|
-1.27
-2.23% |
$56.90
|
61,355
62.23% of 50 DAV
50 DAV is 98,600
|
$57.51
-3.39%
|
11/1/2011
|
$42.07
|
PP = $45.57
|
|
MB = $47.85
|
Most Recent Note - 2/6/2012 4:30:11 PM
G - Down today on quieter volume after 4 consecutive gains, hovering near its all-time high. Results below the +25% minimum earnings guideline for the Dec '11 quarter raised concerns.
>>> The latest Featured Stock Update with an annotated graph appeared on 1/31/2012. Click here.
View all notes |
Alert me of new notes |
CANSLIM.net Company Profile |
SEC |
Zacks Reports |
StockTalk |
News |
Chart |
Request a new note
C
A N
S L
I M
|
Symbol/Exchange
Company Name
Industry Group |
PRICE |
CHANGE
(%Change) |
Day High |
Volume
(% DAV)
(% 50 day avg vol) |
52 Wk Hi
% From Hi |
Featured
Date |
Price
Featured |
Pivot Featured |
|
Max Buy |
PRGO
-
NASDAQ
Perrigo Co
DRUGS - Drug Related Products
|
$94.01
|
+0.35
0.37% |
$95.07
|
1,637,608
125.41% of 50 DAV
50 DAV is 1,305,800
|
$104.70
-10.21%
|
12/9/2011
|
$99.54
|
PP = $101.56
|
|
MB = $106.64
|
Most Recent Note - 2/3/2012 6:40:09 PM
G - Halted its slide today with a gain on higher volume, meanwhile its Relative Strength rank slumped to 77, falling below the minimum guideline for buy candidates under the fact-based system and raising concerns. Its 200 DMA line defines important near-term support, as that long-term average acted as support in prior months while it endured distributional pressure.
>>> The latest Featured Stock Update with an annotated graph appeared on 1/9/2012. Click here.
View all notes |
Alert me of new notes |
CANSLIM.net Company Profile |
SEC |
Zacks Reports |
StockTalk |
News |
Chart |
Request a new note
C
A N
S L
I M
|
RAX
-
NYSE
Rackspace Hosting Inc
INTERNET - Internet Software and; Services
|
$48.40
|
+1.21
2.56% |
$48.49
|
2,425,106
156.16% of 50 DAV
50 DAV is 1,553,000
|
$47.97
0.90%
|
2/2/2012
|
$46.69
|
PP = $45.55
|
|
MB = $47.83
|
Most Recent Note - 2/6/2012 2:21:11 PM
G - Up again today for another new all-time high and its color code is changed to green after getting slightly extended from the previously noted orderly flat base. Prior highs in the $45 area define initial support to watch on pullbacks.
>>> The latest Featured Stock Update with an annotated graph appeared on 1/5/2012. Click here.
View all notes |
Alert me of new notes |
CANSLIM.net Company Profile |
SEC |
Zacks Reports |
StockTalk |
News |
Chart |
Request a new note
C
A N
S L
I M
|
SWI
-
NYSE
Solarwinds Inc
COMPUTER SOFTWARE and SERVICES - Application Software
|
$33.27
|
-1.39
-4.01% |
$36.99
|
3,557,588
371.67% of 50 DAV
50 DAV is 957,200
|
$35.35
-5.88%
|
1/26/2012
|
$32.36
|
PP = $33.78
|
|
MB = $35.47
|
Most Recent Note - 2/6/2012 1:13:39 PM
Y - Gapped up today for another new high then reversed into the red. The prior session's gain with nearly 3 times average volume triggered a technical buy signal. No resistance remains due to overhead supply.
>>> The latest Featured Stock Update with an annotated graph appeared on 1/26/2012. Click here.
View all notes |
Alert me of new notes |
CANSLIM.net Company Profile |
SEC |
Zacks Reports |
StockTalk |
News |
Chart |
Request a new note
C
A N
S L
I M
|
SXCI
-
NASDAQ
S X C Health Solutions
COMPUTER SOFTWARE and SERVICES - Healthcare Information Service
|
$61.12
|
-2.73
-4.28% |
$63.67
|
811,266
248.85% of 50 DAV
50 DAV is 326,000
|
$66.40
-7.95%
|
1/10/2012
|
$62.05
|
PP = $60.10
|
|
MB = $63.11
|
Most Recent Note - 2/6/2012 4:26:24 PM
G - Considerable loss today on heavy volume, slumping near prior highs in the $60 area and its 50 DMA line previously noted as chart support to watch on pullbacks.
>>> The latest Featured Stock Update with an annotated graph appeared on 1/20/2012. Click here.
View all notes |
Alert me of new notes |
CANSLIM.net Company Profile |
SEC |
Zacks Reports |
StockTalk |
News |
Chart |
Request a new note
C
A N
S L
I M
|
TDG
-
NYSE
Transdigm Group Inc
AEROSPACE/DEFENSE - Aerospace/Defense Products and; Services
|
$107.42
|
-0.41
-0.38% |
$109.02
|
530,672
168.52% of 50 DAV
50 DAV is 314,900
|
$108.18
-0.70%
|
1/10/2012
|
$98.83
|
PP = $102.83
|
|
MB = $107.97
|
Most Recent Note - 2/6/2012 4:32:07 PM
Y - Reversed into the red today after reaching another new all-time high. No overhead supply remains to act as resistance. Prior highs near $102 define the initial support level to watch above its 50 DMA line.
>>> The latest Featured Stock Update with an annotated graph appeared on 1/4/2012. Click here.
View all notes |
Alert me of new notes |
CANSLIM.net Company Profile |
SEC |
Zacks Reports |
StockTalk |
News |
Chart |
Request a new note
C
A N
S L
I M
|
Symbol/Exchange
Company Name
Industry Group |
PRICE |
CHANGE
(%Change) |
Day High |
Volume
(% DAV)
(% 50 day avg vol) |
52 Wk Hi
% From Hi |
Featured
Date |
Price
Featured |
Pivot Featured |
|
Max Buy |
TSCO
-
NASDAQ
Tractor Supply Co
SPECIALTY RETAIL - Specialty Retail, Other
|
$82.05
|
+0.84
1.03% |
$82.07
|
1,165,078
164.28% of 50 DAV
50 DAV is 709,200
|
$82.50
-0.55%
|
1/12/2012
|
$79.12
|
PP = $75.58
|
|
MB = $79.36
|
Most Recent Note - 2/6/2012 4:35:15 PM
G - Gain today with above average volume for a best-ever close. Prior highs in the mid-$70s which were a resistance area now define initial support to watch on pullbacks.
>>> The latest Featured Stock Update with an annotated graph appeared on 1/12/2012. Click here.
View all notes |
Alert me of new notes |
CANSLIM.net Company Profile |
SEC |
Zacks Reports |
StockTalk |
News |
Chart |
Request a new note
C
A N
S L
I M
|
UBNT
-
NASDAQ
Ubiquiti Networks Inc
TELECOMMUNICATIONS - Diversified Communication Serv
|
$23.76
|
-1.24
-4.96% |
$25.45
|
314,625
120.68% of 50 DAV
50 DAV is 260,700
|
$27.23
-12.74%
|
1/27/2012
|
$22.25
|
PP = $23.14
|
|
MB = $24.30
|
Most Recent Note - 2/6/2012 2:04:20 PM
G - Down again today following a negative reversal on the prior session from a new all-time high. Prior highs in the $23 area define initial support to watch on pullbacks.
>>> The latest Featured Stock Update with an annotated graph appeared on 2/1/2012. Click here.
View all notes |
Alert me of new notes |
CANSLIM.net Company Profile |
SEC |
Zacks Reports |
StockTalk |
News |
Chart |
Request a new note
C
A N
S L
I M
|
ULTA
-
NASDAQ
Ulta Salon Cosm & Frag
SPECIALTY RETAIL - Specialty Retail, Other
|
$78.68
|
+0.57
0.73% |
$78.88
|
492,268
55.42% of 50 DAV
50 DAV is 888,300
|
$79.64
-1.21%
|
1/11/2012
|
$71.97
|
PP = $75.80
|
|
MB = $79.59
|
Most Recent Note - 2/3/2012 6:54:39 PM
Y - Still quietly consolidating near its all-time high. Recently wedged up from a riskier late-stage base without sufficient volume to trigger a proper technical buy signal. Prior lows near $64 define important chart support above its 200 DMA line.
>>> The latest Featured Stock Update with an annotated graph appeared on 1/11/2012. Click here.
View all notes |
Alert me of new notes |
CANSLIM.net Company Profile |
SEC |
Zacks Reports |
StockTalk |
News |
Chart |
Request a new note
C
A N
S L
I M
|
V
-
NYSE
Visa Inc Cl A
DIVERSIFIED SERVICES - Business/Management Services
|
$107.36
|
+0.33
0.31% |
$108.27
|
3,335,468
85.88% of 50 DAV
50 DAV is 3,884,000
|
$107.82
-0.43%
|
2/2/2012
|
$105.43
|
PP = $104.30
|
|
MB = $109.52
|
Most Recent Note - 2/3/2012 6:58:28 PM
Y - Gapped up again today for another new all-time high amid more strength in the group of Finance -Credit Card Payment Processing firms. Technically, its volume-driven gain above the new pivot point cited triggered a new (or add-on) buy signal. Prior highs in the $103-104 area define initial support.
>>> The latest Featured Stock Update with an annotated graph appeared on 1/23/2012. Click here.
View all notes |
Alert me of new notes |
CANSLIM.net Company Profile |
SEC |
Zacks Reports |
StockTalk |
News |
Chart |
Request a new note
C
A N
S L
I M
|