You are not logged in.
This means you
CAN ONLY VIEW reports that were published prior to Monday, April 14, 2025.
You
MUST UPGRADE YOUR MEMBERSHIP if you want to see any current reports.
AFTER MARKET UPDATE - TUESDAY, FEBRUARY 5TH, 2013
Previous After Market Report Next After Market Report >>>
|
|
|
|
DOW |
+99.22 |
13,979.30 |
+0.71% |
|
Volume |
701,946,900 |
+1% |
|
Volume |
2,080,297,340 |
+15% |
|
NASDAQ |
+40.41 |
3,171.58 |
+1.29% |
|
Advancers |
2,199 |
71% |
|
Advancers |
1,809 |
70% |
|
S&P 500 |
+15.57 |
1,511.28 |
+1.04% |
|
Decliners |
810 |
26% |
|
Decliners |
683 |
27% |
|
Russell 2000 |
+8.93 |
908.21 |
+0.99% |
|
52 Wk Highs |
249 |
|
|
52 Wk Highs |
137 |
|
|
S&P 600 |
+4.70 |
507.76 |
+0.93% |
|
52 Wk Lows |
14 |
|
|
52 Wk Lows |
8 |
|
|
 |
Major Averages Repaired Most of Monday's Losses
Kenneth J. Gruneisen - Passed the CAN SLIM® Master's Exam
The major averages rebounded and nearly repaired their losses from Monday. The volume totals were reported higher on the NYSE and on the Nasdaq exchange, indicating better buying demand returning from the institutional crowd. Breadth was positive as advancers led decliners by 11-4 on the NYSE and on the Nasdaq exchange. The total number of stocks hitting new 52-week highs still easily outnumbered new 52-week lows on the NYSE and on the Nasdaq exchange. There were 82 high-ranked companies from the CANSLIM.net Leaders List making new 52-week highs and appearing on the CANSLIM.net BreakOuts Page, nearly doubling the prior session total of 42 stocks. There were gains for 10 of the 11 high-ranked companies currently included on the Featured Stocks Page.
The major averages closed near five-year highs amid a batch of encouraging profit tallies. Overseas economic data added to the positive tone. China’s services industries expanded in January at the fastest pace in four months and a survey of euro zone business optimism advanced to a 10-month high.
All sectors were higher led by gains in technology. Dell Inc (DELL +1.33%) rose after agreeing to be taken private in the largest leveraged buyout in over five years. Computer Sciences Corp (CSC +9.16%) led S&P 500 gainers after boosting its full-year profit forecast. Apple Inc (AAPL +3.51%) also helped lift the market. Financials and health care were also notable performers as Bank of America Corp (BAC +3.48%) and Pfizer Inc (PFE +1.25%) rose. Shares of The McGraw-Hill Companies Inc (MHP -10.70%) faced more pressure after the Department of Justice filed a civil suit against the company's Standard & Poor's unit related to its mortgage bond ratings prior to the 2007 financial crisis. YUM! Brands Inc (YUM -2.91%) fell after its earnings release.
Earnings results remained in focus after the closing bell with The Walt Disney Co (DIS +0.72%), Chipotle Mexican Grill Inc (CMG -1.67%), Panera Bread Co (PNRA -0.26%) and Zynga Inc (ZNGA +7.03%) all reporting.
In fixed-income, Treasury prices were lower as the 10-year note lost 13/32 to yield 2.00%.
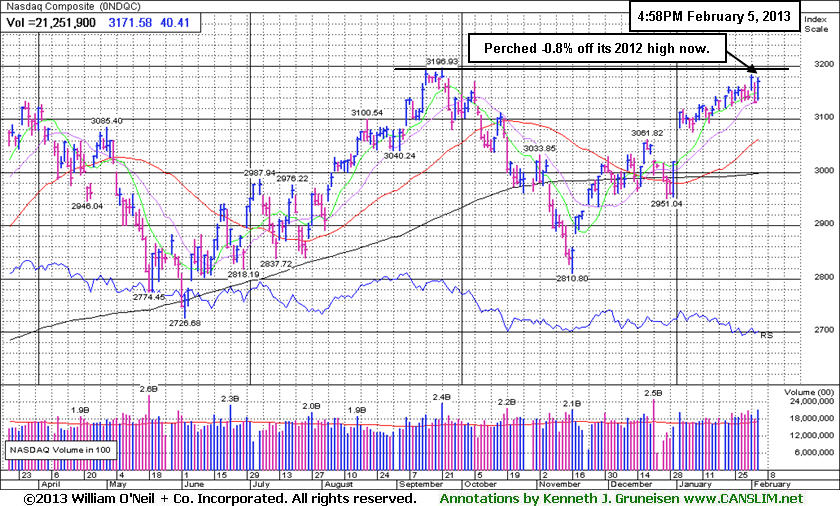
The latest rally has produced a few action worthy candidates meeting all of the fact-based investment system's criteria. Selectivity and discipline are required, as always. Investors may consider new buying efforts in stocks meeting all key criteria, as the market's (M criteria) confirmed uptrend has been comprised by great leadership (stocks hitting new 52-week highs) in the broader market. Widespread gains helped all of the major averages blast higher, and the benchmark S&P 500 Index is perched at its best level in more than five years.
Watch for an announcement via email concerning the next WEBCAST. The webcast will also be available via an updated link highlighted at the top of the Premium Member Homepage.
PICTURED: The Nasdaq Composite Index is perched -0.8% off its 2012 high now.
|
 Kenneth J. Gruneisen started out as a licensed stockbroker in August 1987, a couple of months prior to the historic stock market crash that took the Dow Jones Industrial Average down -22.6% in a single day. He has published daily fact-based fundamental and technical analysis on high-ranked stocks online for two decades. Through FACTBASEDINVESTING.COM, Kenneth provides educational articles, news, market commentary, and other information regarding proven investment systems that work in good times and bad.
Comments contained in the body of this report are technical opinions only and are not necessarily those of Gruneisen Growth Corp. The material herein has been obtained from sources believed to be reliable and accurate, however, its accuracy and completeness cannot be guaranteed. Our firm, employees, and customers may effect transactions, including transactions contrary to any recommendation herein, or have positions in the securities mentioned herein or options with respect thereto. Any recommendation contained in this report may not be suitable for all investors and it is not to be deemed an offer or solicitation on our part with respect to the purchase or sale of any securities. |
|
 |
Retail, Tech, Healthcare, and Financial Indexes Underpinned Rally
Kenneth J. Gruneisen - Passed the CAN SLIM® Master's Exam
Gains from the Retail Index ($RLX +1.43%) and financial indexes were positive influences on the major averages as the Broker/Dealer Index ($XBD +1.39%) and the Bank Index ($BKX +1.55%) rallied higher. The Healthcare Index ($HMO +2.38%) was a standout gainer. The tech sector was strong with unanimous gains from the Semiconductor Index ($SOX +1.57%), Biotechnology Index ($BTK +1.43%), Networking Index ($NWX +1.26%), and the Internet Index ($IIX +0.84%). Meanwhile, commodity-linked groups were little changed as the Gold & Silver Index ($XAU -0.03%) finished flat, and the Integrated Oil Index ($XOI +0.31%) posted a small gain while the Oil Services Index ($OSX -0.27%) edged lower.
Charts courtesy www.stockcharts.com
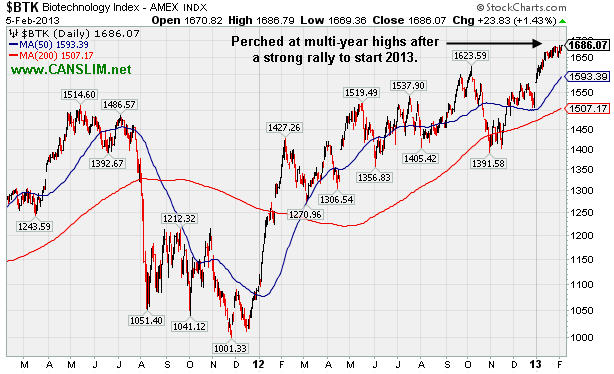
PICTURED: The Biotechnology Index ($BTK +1.43%) is perched at multi-year highs after a strong rally to start 2013.
| Oil Services |
$OSX |
247.40 |
-0.68 |
-0.27% |
+12.37% |
| Healthcare |
$HMO |
2,751.76 |
+64.09 |
+2.38% |
+9.45% |
| Integrated Oil |
$XOI |
1,354.15 |
+4.24 |
+0.31% |
+9.04% |
| Semiconductor |
$SOX |
420.69 |
+6.51 |
+1.57% |
+9.54% |
| Networking |
$NWX |
246.45 |
+3.07 |
+1.26% |
+8.78% |
| Internet |
$IIX |
357.04 |
+2.97 |
+0.84% |
+9.19% |
| Broker/Dealer |
$XBD |
106.51 |
+1.46 |
+1.39% |
+12.91% |
| Retail |
$RLX |
701.84 |
+9.92 |
+1.43% |
+7.47% |
| Gold & Silver |
$XAU |
152.01 |
-0.05 |
-0.03% |
-8.21% |
| Bank |
$BKX |
54.90 |
+0.84 |
+1.55% |
+7.06% |
| Biotech |
$BTK |
1,686.07 |
+23.83 |
+1.43% |
+8.99% |
|
|
|
 |
Fundamental Flaw and Negative Reversal at High Raised Concerns
Kenneth J. Gruneisen - Passed the CAN SLIM® Master's Exam
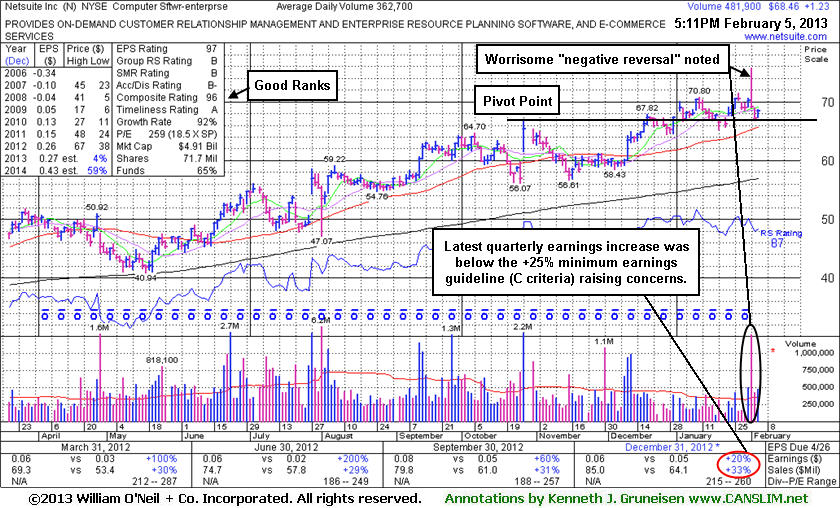
Netsuite Inc (N +$1.23 or +1.83% to $68.46) posted a gain today with above average volume after slumping toward its 50-day moving average (DMA) line, and it finished the session -9.6% off its 52-week high. There was a worrisome "negative reversal" noted on 2/01/13 after gapping up for a new 52-week high as the mid-day report cautioned - "Reported earnings +20% on +33% sales revenues for the Dec '12 quarter, below the +25% minimum earnings guideline (C criteria) raising fundamental concerns."
Netsuite was last shown in this FSU section on 1/18/13 with an annotated graph under the headline, "Encountering Mild Distributional Pressure". It held its ground and on 1/31/2013 a gain with +48% above average volume lifted it near its "max buy" level and gave investors a reassuring hint that institutional buying demand was lurking. However, after the disappointing earnings news, the negative reversal and high volume with lack of meaningful price progress was a sign that it encountered more serious distributional pressure.
Most of the recent gains above its pivot point were marked by below average volume, and it was observed - "That kind of action is technically termed 'wedging' and it does not have the look of hearty buying demand coming from the institutional crowd. Disciplined investors know that volume must be at least +40% above average behind gains above the pivot point to trigger a proper technical buy signal. Without heavy volume behind a stock's breakout investors have little reason to believe sufficient buying demand is lurking to allow for it to make a meaningful and sustained advance in price."
Netsuite Inc was highlighted in yellow in the 12/12/12 mid-day report with a pivot point cited based on its 10/26/12 high plus 10 cents (read here). The high-ranked Computer Software -Enterprise firm had reported earnings increases above the +25% minimum earnings guideline (C criteria) in the 5 prior quarterly comparisons. Its annual earnings (A criteria) history improved from losses prior to FY '09. The number of top-rated funds owning its shares rose from 201 in Jun '11 to 303 in Dec '12, a reassuring sign concerning the I criteria. The Computer Software -Enterprise group has a Group Relative Strength Rating of B, a somewhat reassuring sign concerning the L criteria.
Disciplined investors watch out when fundamental flaws develop, and they always limit losses by selling if any stock falls more than -7% from the purchase price, if not selling sooner. Following strict selling rules is what keeps an investor from letting a small loss become a more devastating loss.
|
|
|
Color Codes Explained :
Y - Better candidates highlighted by our
staff of experts.
G - Previously featured
in past reports as yellow but may no longer be buyable under the
guidelines.
***Last / Change / Volume data in this table is the closing quote data***
Symbol/Exchange
Company Name
Industry Group |
PRICE |
CHANGE
(%Change) |
Day High |
Volume
(% DAV)
(% 50 day avg vol) |
52 Wk Hi
% From Hi |
Featured
Date |
Price
Featured |
Pivot Featured |
|
Max Buy |
CELG
-
NASDAQ
Celgene Corp
DRUGS - Drug Manufacturers - Major
|
$99.76
|
+1.17
1.19% |
$100.10
|
2,717,198
74.05% of 50 DAV
50 DAV is 3,669,600
|
$102.29
-2.47%
|
12/11/2012
|
$82.24
|
PP = $81.34
|
|
MB = $85.41
|
Most Recent Note - 2/4/2013 6:19:32 PM
G - Perched near its all-time high, very extended from its prior base. See latest FSU analysis for more details and a new annotated graph.
>>> The latest Featured Stock Update with an annotated graph appeared on 2/4/2013. Click here.
View all notes |
Alert me of new notes |
CANSLIM.net Company Profile |
SEC |
Zacks Reports |
StockTalk |
News |
Chart |
Request a new note
C
A N
S L
I M


|
CFNL
-
NASDAQ
Cardinal Financial Corp
BANKING - Regional - Southeast Banks
|
$16.42
|
+0.35
2.18% |
$16.50
|
139,776
63.88% of 50 DAV
50 DAV is 218,800
|
$16.90
-2.84%
|
12/3/2012
|
$15.20
|
PP = $16.31
|
|
MB = $17.13
|
 Most Recent Note - 2/5/2013 3:49:27 PM
Y - Rebounding today with below average volume while rising back above its pivot point and still consolidating just above its 50 DMA line defining important near-term support. Subsequent losses leading to a damaging violation and a slump below the recent low ($15.74 on 1/18/13) would raise concerns and trigger technical sell signals.
>>> The latest Featured Stock Update with an annotated graph appeared on 1/31/2013. Click here.
View all notes |
Alert me of new notes |
CANSLIM.net Company Profile |
SEC |
Zacks Reports |
StockTalk |
News |
Chart |
Request a new note
C
A N
S L
I M
|
CMCSA
-
NASDAQ
Comcast Corp Cl A
MEDIA - CATV Systems
|
$39.24
|
+1.05
2.75% |
$39.48
|
16,350,839
141.02% of 50 DAV
50 DAV is 11,595,100
|
$40.28
-2.58%
|
12/3/2012
|
$37.08
|
PP = $38.06
|
|
MB = $39.96
|
Most Recent Note - 2/5/2013 3:39:08 PM
Y - Rallying up from support near prior highs and its 50 DMA line with a solid volume-driven gain today. A subsequent violation of the latest low ($37.81 on 2/04/13) would trigger a technical sell signal.
>>> The latest Featured Stock Update with an annotated graph appeared on 1/29/2013. Click here.
View all notes |
Alert me of new notes |
CANSLIM.net Company Profile |
SEC |
Zacks Reports |
StockTalk |
News |
Chart |
Request a new note
C
A N
S L
I M
|
KORS
-
NYSE
Michael Kors Hldgs Ltd
RETAIL - Apparel Stores
|
$55.38
|
+0.47
0.86% |
$55.90
|
7,641,982
225.33% of 50 DAV
50 DAV is 3,391,400
|
$60.00
-7.70%
|
1/23/2013
|
$54.98
|
PP = $58.72
|
|
MB = $61.66
|
Most Recent Note - 2/5/2013 3:54:39 PM
Y - Managed an impressive "positive reversal" with a gain on heavy volume after a weak start today that tested support at its 50 DMA line following 6 consecutive losses. It slumped since a noted "negative reversal" after touching a new 52-week high on 1/28/13, and it was previously noted with caution - "Disciplined investors may watch for volume-driven gains above the pivot point to trigger a proper technical buy signal before taking action. See the latest FSU analysis under the headline, 'High-Ranked Luxury Apparel Firm Worthy For Watchlist - Wednesday, January 23, 2013', for more details and an annotated weekly graph."
>>> The latest Featured Stock Update with an annotated graph appeared on 1/23/2013. Click here.
View all notes |
Alert me of new notes |
CANSLIM.net Company Profile |
SEC |
Zacks Reports |
StockTalk |
News |
Chart |
Request a new note
C
A N
S L
I M
|
MIDD
-
NASDAQ
Middleby Corp
MANUFACTURING - Diversified Machinery
|
$147.52
|
+4.91
3.44% |
$148.40
|
170,942
193.59% of 50 DAV
50 DAV is 88,300
|
$146.46
0.72%
|
10/8/2012
|
$118.46
|
PP = $122.67
|
|
MB = $128.80
|
Most Recent Note - 2/5/2013 3:36:13 PM
G - Volume is above average while rallying and hitting another new all-time high today, getting even more extended from any sound base. Prior highs and its 50 DMA line define important near-term chart support in the $132-134 area.
>>> The latest Featured Stock Update with an annotated graph appeared on 1/30/2013. Click here.
View all notes |
Alert me of new notes |
CANSLIM.net Company Profile |
SEC |
Zacks Reports |
StockTalk |
News |
Chart |
Request a new note
C
A N
S L
I M
|
Symbol/Exchange
Company Name
Industry Group |
PRICE |
CHANGE
(%Change) |
Day High |
Volume
(% DAV)
(% 50 day avg vol) |
52 Wk Hi
% From Hi |
Featured
Date |
Price
Featured |
Pivot Featured |
|
Max Buy |
N
-
NYSE
Netsuite Inc
DIVERSIFIED SERVICES - Business/Management Services
|
$68.46
|
+1.23
1.83% |
$68.70
|
481,969
132.88% of 50 DAV
50 DAV is 362,700
|
$75.75
-9.62%
|
12/12/2012
|
$64.75
|
PP = $67.12
|
|
MB = $70.48
|
Most Recent Note - 2/5/2013 5:48:32 PM
G - Posted a gain today after slumping toward its 50 DMA line. Following a worrisome "negative reversal" on 2/01/13 after initially gapping up for a new 52-week high, the mid-day report cautioned - "Reported earnings +20% on +33% sales revenues for the Dec '12 quarter, below the +25% minimum earnings guideline (C criteria) raising fundamental concerns." See the latest FSU analysis for more details and a new annotated graph.
>>> The latest Featured Stock Update with an annotated graph appeared on 2/5/2013. Click here.
View all notes |
Alert me of new notes |
CANSLIM.net Company Profile |
SEC |
Zacks Reports |
StockTalk |
News |
Chart |
Request a new note
C
A N
S L
I M
|
NP
-
NYSE
Neenah Paper Inc
CONSUMER NON-DURABLES - Paper and Paper Products
|
$30.44
|
-0.39
-1.27% |
$31.15
|
86,622
112.06% of 50 DAV
50 DAV is 77,300
|
$32.57
-6.54%
|
1/25/2013
|
$31.80
|
PP = $31.76
|
|
MB = $33.35
|
Most Recent Note - 2/4/2013 6:39:09 PM
Y - Remains below its pivot point today, consolidating following a spurt of volume-driven losses. A "negative reversal" for a loss on heavy volume after hitting a new 52-week high on 1/25/13 was noted as a worrisome sign of distributional pressure as it failed to finish strong and did not clinch a technical buy signal.
>>> The latest Featured Stock Update with an annotated graph appeared on 1/25/2013. Click here.
View all notes |
Alert me of new notes |
CANSLIM.net Company Profile |
SEC |
Zacks Reports |
StockTalk |
News |
Chart |
Request a new note
C
A N
S L
I M
|
NSR
-
NYSE
Neustar Inc
TELECOMMUNICATIONS - Diversified Communication Serv
|
$45.00
|
+0.04
0.09% |
$45.65
|
562,918
132.45% of 50 DAV
50 DAV is 425,000
|
$46.49
-3.20%
|
12/11/2012
|
$41.85
|
PP = $41.41
|
|
MB = $43.48
|
Most Recent Note - 2/5/2013 3:42:48 PM
G - Holding its ground today after another worrisome "negative reversal" on the prior session, finishing with a volume-driven loss after early gains touching another new 52-week high. Extended from its prior base. Its 50 DMA line defines near-term support above its prior base..
>>> The latest Featured Stock Update with an annotated graph appeared on 2/1/2013. Click here.
View all notes |
Alert me of new notes |
CANSLIM.net Company Profile |
SEC |
Zacks Reports |
StockTalk |
News |
Chart |
Request a new note
C
A N
S L
I M
|
RAX
-
NYSE
Rackspace Hosting Inc
INTERNET - Internet Software and; Services
|
$75.64
|
+0.71
0.95% |
$76.05
|
1,432,919
125.35% of 50 DAV
50 DAV is 1,143,100
|
$81.36
-7.03%
|
12/18/2012
|
$71.88
|
PP = $70.10
|
|
MB = $73.61
|
Most Recent Note - 2/5/2013 3:43:54 PM
G - Still consolidating above important support at its 50 DMA line, tallying another small gain today on slightly above average volume. Recently noted with caution - "It is extended from the previously noted base. Company will announce its fourth quarter 2012 financial results on Tuesday, February 12, 2013 after the close."
>>> The latest Featured Stock Update with an annotated graph appeared on 1/22/2013. Click here.
View all notes |
Alert me of new notes |
CANSLIM.net Company Profile |
SEC |
Zacks Reports |
StockTalk |
News |
Chart |
Request a new note
C
A N
S L
I M
|
RNF
-
NYSE
Rentech Nitrogen Ptnr Lp
CHEMICALS - Agricultural Chemicals
|
$47.73
|
+0.08
0.17% |
$48.40
|
525,346
172.70% of 50 DAV
50 DAV is 304,200
|
$49.18
-2.95%
|
11/1/2012
|
$39.11
|
PP = $40.15
|
|
MB = $42.16
|
Most Recent Note - 2/5/2013 3:47:45 PM
G - Retreating from its 52-week high today with its 2nd loss on above average volume in the span of 3 sessions, a sign it is encountering more distributional pressure. Previously noted - "Extended from its prior base. Prior highs and 50 DMA line coincide near $41 defining important chart support to watch on pullbacks."
>>> The latest Featured Stock Update with an annotated graph appeared on 1/24/2013. Click here.
View all notes |
Alert me of new notes |
CANSLIM.net Company Profile |
SEC |
Zacks Reports |
StockTalk |
News |
Chart |
Request a new note
C
A N
S L
I M
|
Symbol/Exchange
Company Name
Industry Group |
PRICE |
CHANGE
(%Change) |
Day High |
Volume
(% DAV)
(% 50 day avg vol) |
52 Wk Hi
% From Hi |
Featured
Date |
Price
Featured |
Pivot Featured |
|
Max Buy |
VRX
-
NYSE
Valeant Pharmaceuticals
DRUGS - Drug Manufacturers - Other
|
$66.64
|
+0.23
0.35% |
$67.30
|
1,030,862
67.10% of 50 DAV
50 DAV is 1,536,400
|
$67.65
-1.49%
|
12/20/2012
|
$60.24
|
PP = $61.21
|
|
MB = $64.27
|
Most Recent Note - 2/4/2013 6:35:07 PM
G - Retreated from its 52-week high with higher (near average) volume behind today's loss. It is extended from its prior base, and its 50 DMA coincides with prior highs near $61 defining near-term chart support to watch on pullbacks.
>>> The latest Featured Stock Update with an annotated graph appeared on 1/28/2013. Click here.
View all notes |
Alert me of new notes |
CANSLIM.net Company Profile |
SEC |
Zacks Reports |
StockTalk |
News |
Chart |
Request a new note
C
A N
S L
I M
|
|
|
|
THESE ARE NOT BUY RECOMMENDATIONS!
Comments contained in the body of this report are technical
opinions only. The material herein has been obtained
from sources believed to be reliable and accurate, however,
its accuracy and completeness cannot be guaranteed.
This site is not an investment advisor, hence it does
not endorse or recommend any securities or other investments.
Any recommendation contained in this report may not
be suitable for all investors and it is not to be deemed
an offer or solicitation on our part with respect to
the purchase or sale of any securities. All trademarks,
service marks and trade names appearing in this report
are the property of their respective owners, and are
likewise used for identification purposes only.
This report is a service available
only to active Paid Premium Members.
You may opt-out of receiving report notifications
at any time. Questions or comments may be submitted
by writing to Premium Membership Services 665 S.E. 10 Street, Suite 201 Deerfield Beach, FL 33441-5634 or by calling 1-800-965-8307
or 954-785-1121.
|
|
|

