You are not logged in.
This means you
CAN ONLY VIEW reports that were published prior to Monday, April 14, 2025.
You
MUST UPGRADE YOUR MEMBERSHIP if you want to see any current reports.
AFTER MARKET UPDATE - MONDAY, FEBRUARY 4TH, 2013
Previous After Market Report Next After Market Report >>>
|
|
|
|
DOW |
-129.71 |
13,880.08 |
-0.93% |
|
Volume |
693,843,150 |
-8% |
|
Volume |
1,808,320,620 |
-7% |
|
NASDAQ |
-47.93 |
3,131.17 |
-1.51% |
|
Advancers |
645 |
20% |
|
Advancers |
582 |
22% |
|
S&P 500 |
-17.46 |
1,495.71 |
-1.15% |
|
Decliners |
2,398 |
76% |
|
Decliners |
1,921 |
74% |
|
Russell 2000 |
-11.92 |
899.28 |
-1.31% |
|
52 Wk Highs |
125 |
|
|
52 Wk Highs |
124 |
|
|
S&P 600 |
-6.37 |
503.06 |
-1.25% |
|
52 Wk Lows |
11 |
|
|
52 Wk Lows |
13 |
|
|
 |
Major Averages Retreated on Lighter Volume
Kenneth J. Gruneisen - Passed the CAN SLIM® Master's Exam
The major averages traded down on Monday amid renewed political uncertainty out of Europe. The volume totals were reported lighter on the NYSE and on the Nasdaq exchange, not indicating any worrisome increase in selling pressure from the institutional crowd. Breadth was negative as decliners led advancers by more than 3-1 on the NYSE and on the Nasdaq exchange. The total number of stocks hitting new 52-week highs still easily outnumbered new 52-week lows on the NYSE and on the Nasdaq exchange. There were 42 high-ranked companies from the CANSLIM.net Leaders List making new 52-week highs and appearing on the CANSLIM.net BreakOuts Page, down from the prior session total of 110 stocks. There were losses for 10 of the 11 high-ranked companies currently included on the Featured Stocks Page.
The market declined on concerns over calls for Spain's Prime Minister Mariano Rajoy to resign and reports former Italian premier Silvio Berlusconi is gaining in the polls before elections later this month. On the economic front, factory orders rose +1.8% in December, below the consensus estimate for a +2.3% increase.
All 10 sectors in the S&P 500 ended the session in negative territory, led by declines in decline in technology and consumer discretionary areas. Gannett Co Inc (GCI -6.70%) fell after the media company reduced its first-quarter forecast. Technology also underperformed with Oracle Corp (ORCL -2.97%) falling after announcing it would acquire Acme Packet (APKT +23.65%) for $1.7 billion. Positive earnings results lifted shares of The Clorox Corp (CLX +0.71%). Humana Inc (HUM +4.66%) gained after profits topped analyst projections. In other news, shares of The McGraw-Hill Companies Inc (MHP -13.78%) dove on reports the Department of Justice plans to file a civil suit against the company's Standard & Poor's unit related to its mortgage bond ratings prior to the 2007 financial crisis. YUM! Brands Inc (YUM -3.02%) fell ahead of its earnings release after the close.
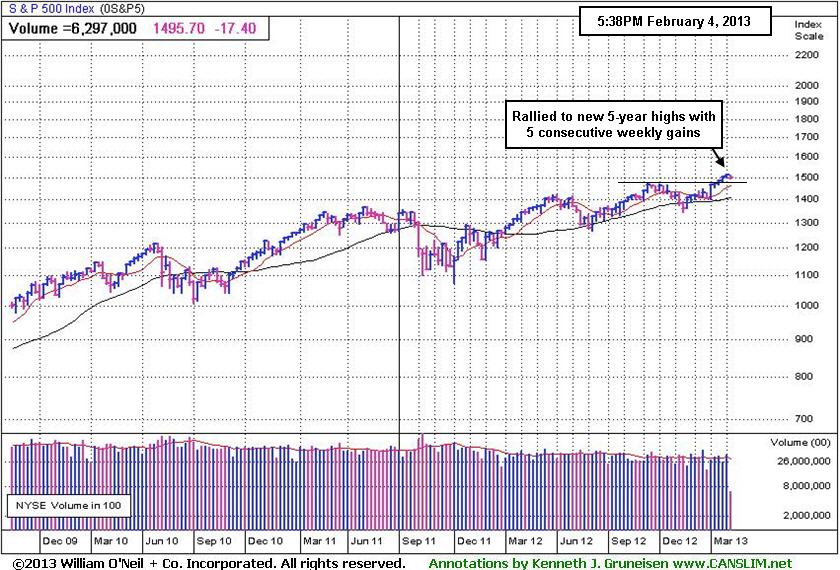
The latest rally has produced a few action worthy candidates meeting all of the fact-based investment system's criteria. Selectivity and discipline are required, as always. Investors may consider new buying efforts in stocks meeting all key criteria, as the market's (M criteria) confirmed uptrend has been comprised by great leadership (stocks hitting new 52-week highs) in the broader market. Widespread gains helped all of the major averages blast higher, and the benchmark S&P 500 Index is perched at its best level in more than five years.
Watch for an announcement via email concerning the next WEBCAST. The webcast will also be available via an updated link highlighted at the top of the Premium Member Homepage.
PICTURED: The weekly graph of the S&P 500 Index shows it at a new 5-year high after a streak of 5 consecutive weekly gains.
|
 Kenneth J. Gruneisen started out as a licensed stockbroker in August 1987, a couple of months prior to the historic stock market crash that took the Dow Jones Industrial Average down -22.6% in a single day. He has published daily fact-based fundamental and technical analysis on high-ranked stocks online for two decades. Through FACTBASEDINVESTING.COM, Kenneth provides educational articles, news, market commentary, and other information regarding proven investment systems that work in good times and bad.
Comments contained in the body of this report are technical opinions only and are not necessarily those of Gruneisen Growth Corp. The material herein has been obtained from sources believed to be reliable and accurate, however, its accuracy and completeness cannot be guaranteed. Our firm, employees, and customers may effect transactions, including transactions contrary to any recommendation herein, or have positions in the securities mentioned herein or options with respect thereto. Any recommendation contained in this report may not be suitable for all investors and it is not to be deemed an offer or solicitation on our part with respect to the purchase or sale of any securities. |
|
 |
Tech, Retail, Financial and Energy-Related Groups Fell
Kenneth J. Gruneisen - Passed the CAN SLIM® Master's Exam
The Networking Index ($NWX +0.33%) eked out a small gain while the Semiconductor Index ($SOX -1.51%), Biotechnology Index ($BTK -1.19%), and the Internet Index ($IIX -0.76%) lost ground. Weakness in the Retail Index ($RLX -1.19%) and influential financial groups weighed on the major averages as the Broker/Dealer Index ($XBD -0.90%) and the Bank Index ($BKX -1.22%) pulled back. Energy-related shares also retreated as the Integrated Oil Index ($XOI -1.34%) and the Oil Services Index ($OSX -1.03%) rounded out Monday's mostly negative session. The Gold & Silver Index ($XAU +0.08%) finished flat and the Healthcare Index ($HMO -0.31%) edged lower, giving defensively positioned investors nothing to cheer about.
Charts courtesy www.stockcharts.com
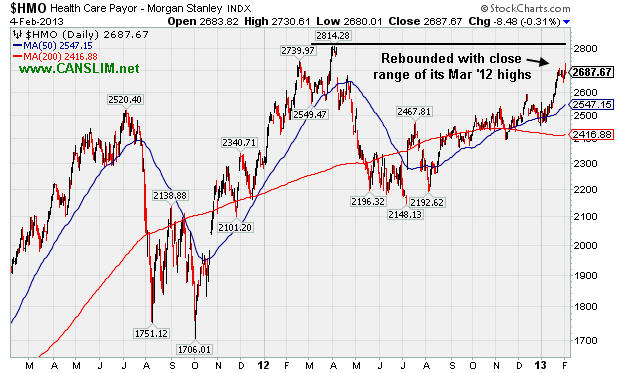
PICTURED: The Healthcare Index ($HMO -0.31%) edged lower today. It has recently rebounded within close range of its Mar '12 highs.
| Oil Services |
$OSX |
248.08 |
-2.59 |
-1.03% |
+12.68% |
| Healthcare |
$HMO |
2,687.67 |
-8.48 |
-0.31% |
+6.90% |
| Integrated Oil |
$XOI |
1,349.92 |
-18.32 |
-1.34% |
+8.70% |
| Semiconductor |
$SOX |
414.18 |
-6.37 |
-1.51% |
+7.84% |
| Networking |
$NWX |
243.38 |
+0.79 |
+0.33% |
+7.43% |
| Internet |
$IIX |
354.07 |
-2.70 |
-0.76% |
+8.28% |
| Broker/Dealer |
$XBD |
105.04 |
-0.96 |
-0.90% |
+11.36% |
| Retail |
$RLX |
691.92 |
-8.36 |
-1.19% |
+5.95% |
| Gold & Silver |
$XAU |
152.06 |
+0.12 |
+0.08% |
-8.18% |
| Bank |
$BKX |
54.06 |
-0.67 |
-1.22% |
+5.42% |
| Biotech |
$BTK |
1,662.24 |
-20.08 |
-1.19% |
+7.45% |
|
|
|
 |
Extended From Prior Base Following Bullish Action
Kenneth J. Gruneisen - Passed the CAN SLIM® Master's Exam
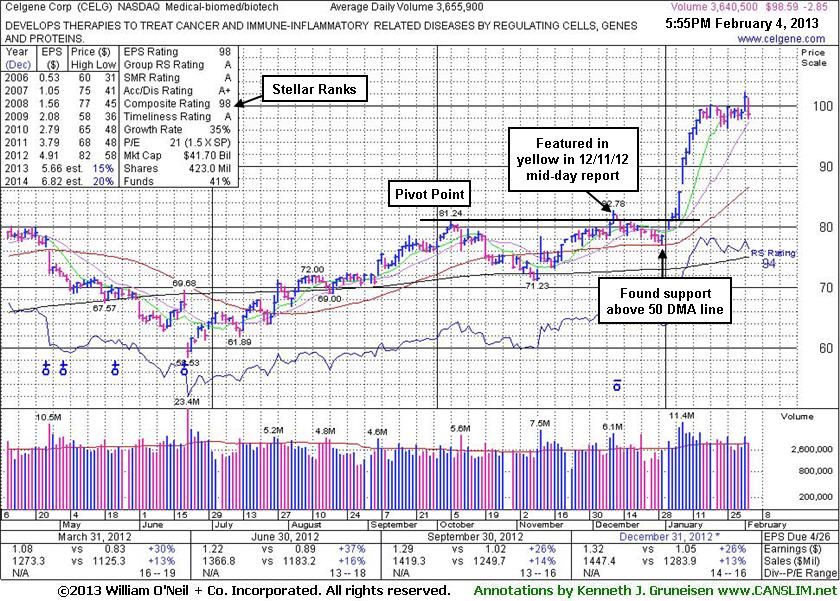
Celgene Corp (CELG -$2.85 or -2.81% to $98.59) pulled back today from new 52-week and all-time highs hit on the prior session with a volume-driven gain. It recently hovered in a tight range near its all-time high, but did not form a base of sufficient length. Technically, it is very extended from its prior base, as shown on the annotated weekly graph below.
The Medical -Biomed/Biotech firm's last appearance in this FSU section was on 1/17/13 with an annotated graph under the headline, "Rule Suggests Letting Explosive Winners Have Time For Greater Gains". It was then holding its ground near its 52-week high following a streak of 11 consecutive gains marked by above average volume. It has been 5 weeks since it technically broke out with confirming gains on heavy volume on 1/07/13. The prior analysis noted - "Having quickly rallied more than +20% in the first 2-3 weeks after its technical breakout, the investment system rules suggest holding such explosive winners for a minimum of 8 weeks to allow for potentially greater gains. Disciplined investors never hold any stock if it fails badly however, or if it falls more than -7% from their purchase price."
CELG has maintained a strong earnings history (C and A criteria), and it recently reported earnings +26% on +13% sales revenues for the Dec '12 quarter. The number of top-rated funds owning its shares rose from 1,623 in Dec '11 to 1,692 in Dec '12, a reassuring trend concerning the I criteria. Its current Up/Down Volume Ratio of 1.8 also offers an unbiased indication its shares have been under accumulation over the past 50 days. However, the company is already well-known by the institutional crowd.
|
|
|
Color Codes Explained :
Y - Better candidates highlighted by our
staff of experts.
G - Previously featured
in past reports as yellow but may no longer be buyable under the
guidelines.
***Last / Change / Volume data in this table is the closing quote data***
Symbol/Exchange
Company Name
Industry Group |
PRICE |
CHANGE
(%Change) |
Day High |
Volume
(% DAV)
(% 50 day avg vol) |
52 Wk Hi
% From Hi |
Featured
Date |
Price
Featured |
Pivot Featured |
|
Max Buy |
CELG
-
NASDAQ
Celgene Corp
DRUGS - Drug Manufacturers - Major
|
$98.59
|
-2.85
-2.81% |
$101.33
|
3,654,497
99.96% of 50 DAV
50 DAV is 3,655,900
|
$102.29
-3.62%
|
12/11/2012
|
$82.24
|
PP = $81.34
|
|
MB = $85.41
|
 Most Recent Note - 2/4/2013 6:19:32 PM
G - Perched near its all-time high, very extended from its prior base. See latest FSU analysis for more details and a new annotated graph.
>>> The latest Featured Stock Update with an annotated graph appeared on 2/4/2013. Click here.
View all notes |
Alert me of new notes |
CANSLIM.net Company Profile |
SEC |
Zacks Reports |
StockTalk |
News |
Chart |
Request a new note
C
A N
S L
I M


|
CFNL
-
NASDAQ
Cardinal Financial Corp
BANKING - Regional - Southeast Banks
|
$16.07
|
-0.33
-2.01% |
$16.43
|
157,317
71.09% of 50 DAV
50 DAV is 221,300
|
$16.90
-4.91%
|
12/3/2012
|
$15.20
|
PP = $16.31
|
|
MB = $17.13
|
Most Recent Note - 2/4/2013 6:23:26 PM
Y - Loss today with below average volume, finishing below its pivot point and near its 50 DMA line defining important near-term support. Subsequent losses leading to a damaging violation and a slump below the recent low ($15.74 on 1/18/13) would raise concerns and trigger technical sell signals.
>>> The latest Featured Stock Update with an annotated graph appeared on 1/31/2013. Click here.
View all notes |
Alert me of new notes |
CANSLIM.net Company Profile |
SEC |
Zacks Reports |
StockTalk |
News |
Chart |
Request a new note
C
A N
S L
I M
|
CMCSA
-
NASDAQ
Comcast Corp Cl A
MEDIA - CATV Systems
|
$38.19
|
-0.41
-1.06% |
$38.51
|
16,171,231
140.71% of 50 DAV
50 DAV is 11,492,800
|
$40.28
-5.19%
|
12/3/2012
|
$37.08
|
PP = $38.06
|
|
MB = $39.96
|
Most Recent Note - 1/31/2013 12:05:25 PM
Y - Encountering recent distributional pressure and today's 4th consecutive loss has it retreating near prior highs and its 50 DMA line defining important chart support. Subsequent violations may trigger technical sell signals.
>>> The latest Featured Stock Update with an annotated graph appeared on 1/29/2013. Click here.
View all notes |
Alert me of new notes |
CANSLIM.net Company Profile |
SEC |
Zacks Reports |
StockTalk |
News |
Chart |
Request a new note
C
A N
S L
I M
|
KORS
-
NYSE
Michael Kors Hldgs Ltd
RETAIL - Apparel Stores
|
$54.91
|
-0.81
-1.45% |
$56.22
|
3,009,259
88.64% of 50 DAV
50 DAV is 3,394,800
|
$60.00
-8.48%
|
1/23/2013
|
$54.98
|
PP = $58.72
|
|
MB = $61.66
|
Most Recent Note - 2/4/2013 6:31:41 PM
Y - Slumped today for a 6th consecutive loss since a noted "negative reversal" after touching a new 52-week high on 1/28/13. Recently tallied gains with ever-increasing volume as it approached its 52-week high and pivot point and noted - "Disciplined investors may watch for volume-driven gains above the pivot point to trigger a proper technical buy signal before taking action. See the latest FSU analysis under the headline, 'High-Ranked Luxury Apparel Firm Worthy For Watchlist - Wednesday, January 23, 2013', for more details and an annotated weekly graph."
>>> The latest Featured Stock Update with an annotated graph appeared on 1/23/2013. Click here.
View all notes |
Alert me of new notes |
CANSLIM.net Company Profile |
SEC |
Zacks Reports |
StockTalk |
News |
Chart |
Request a new note
C
A N
S L
I M
|
MIDD
-
NASDAQ
Middleby Corp
MANUFACTURING - Diversified Machinery
|
$142.61
|
-1.88
-1.30% |
$144.09
|
81,740
93.42% of 50 DAV
50 DAV is 87,500
|
$146.46
-2.63%
|
10/8/2012
|
$118.46
|
PP = $122.67
|
|
MB = $128.80
|
Most Recent Note - 2/1/2013 12:32:03 PM
G - Hitting another new all-time high today, getting even more extended from any sound base. See the latest FSU analysis for more details and a new annotated graph.
>>> The latest Featured Stock Update with an annotated graph appeared on 1/30/2013. Click here.
View all notes |
Alert me of new notes |
CANSLIM.net Company Profile |
SEC |
Zacks Reports |
StockTalk |
News |
Chart |
Request a new note
C
A N
S L
I M
|
Symbol/Exchange
Company Name
Industry Group |
PRICE |
CHANGE
(%Change) |
Day High |
Volume
(% DAV)
(% 50 day avg vol) |
52 Wk Hi
% From Hi |
Featured
Date |
Price
Featured |
Pivot Featured |
|
Max Buy |
N
-
NYSE
Netsuite Inc
DIVERSIFIED SERVICES - Business/Management Services
|
$67.23
|
-1.91
-2.76% |
$69.00
|
435,528
120.41% of 50 DAV
50 DAV is 361,700
|
$75.75
-11.25%
|
12/12/2012
|
$64.75
|
PP = $67.12
|
|
MB = $70.48
|
Most Recent Note - 2/4/2013 6:37:43 PM
G - Lost more ground today, slumping toward its 50 DMA line following a worrisome "negative reversal" on the prior session after gapping up for a new 52-week high. The 2/01/13 mid-day report cautioned - "Reported earnings +20% on +33% sales revenues for the Dec '12 quarter, below the +25% minimum earnings guideline (C criteria) raising fundamental concerns."
>>> The latest Featured Stock Update with an annotated graph appeared on 1/18/2013. Click here.
View all notes |
Alert me of new notes |
CANSLIM.net Company Profile |
SEC |
Zacks Reports |
StockTalk |
News |
Chart |
Request a new note
C
A N
S L
I M
|
NP
-
NYSE
Neenah Paper Inc
CONSUMER NON-DURABLES - Paper and Paper Products
|
$30.83
|
-0.62
-1.97% |
$31.43
|
81,466
106.35% of 50 DAV
50 DAV is 76,600
|
$32.57
-5.34%
|
1/25/2013
|
$31.80
|
PP = $31.76
|
|
MB = $33.35
|
Most Recent Note - 2/4/2013 6:39:09 PM
Y - Remains below its pivot point today, consolidating following a spurt of volume-driven losses. A "negative reversal" for a loss on heavy volume after hitting a new 52-week high on 1/25/13 was noted as a worrisome sign of distributional pressure as it failed to finish strong and did not clinch a technical buy signal.
>>> The latest Featured Stock Update with an annotated graph appeared on 1/25/2013. Click here.
View all notes |
Alert me of new notes |
CANSLIM.net Company Profile |
SEC |
Zacks Reports |
StockTalk |
News |
Chart |
Request a new note
C
A N
S L
I M
|
NSR
-
NYSE
Neustar Inc
TELECOMMUNICATIONS - Diversified Communication Serv
|
$44.96
|
-0.88
-1.92% |
$46.49
|
639,043
153.14% of 50 DAV
50 DAV is 417,300
|
$46.36
-3.02%
|
12/11/2012
|
$41.85
|
PP = $41.41
|
|
MB = $43.48
|
Most Recent Note - 2/1/2013 6:11:45 PM
G - Hit a new 52-week high today with a 2nd consecutive volume-driven gain, getting more extended from its prior base. See the latest FSU analysis for more details and a new annotated graph.
>>> The latest Featured Stock Update with an annotated graph appeared on 2/1/2013. Click here.
View all notes |
Alert me of new notes |
CANSLIM.net Company Profile |
SEC |
Zacks Reports |
StockTalk |
News |
Chart |
Request a new note
C
A N
S L
I M
|
RAX
-
NYSE
Rackspace Hosting Inc
INTERNET - Internet Software and; Services
|
$74.93
|
-1.38
-1.81% |
$76.15
|
872,497
75.79% of 50 DAV
50 DAV is 1,151,200
|
$81.36
-7.90%
|
12/18/2012
|
$71.88
|
PP = $70.10
|
|
MB = $73.61
|
Most Recent Note - 2/1/2013 6:17:10 PM
G - Consolidating above important support at its 50 DMA line, it tallied a gain today on higher volume. Recently noted with caution - "It is extended from the previously noted base. Company will announce its fourth quarter 2012 financial results on Tuesday, February 12, 2013 after the close."
>>> The latest Featured Stock Update with an annotated graph appeared on 1/22/2013. Click here.
View all notes |
Alert me of new notes |
CANSLIM.net Company Profile |
SEC |
Zacks Reports |
StockTalk |
News |
Chart |
Request a new note
C
A N
S L
I M
|
RNF
-
NYSE
Rentech Nitrogen Ptnr Lp
CHEMICALS - Agricultural Chemicals
|
$48.40
|
+0.51
1.06% |
$48.60
|
464,168
155.45% of 50 DAV
50 DAV is 298,600
|
$49.18
-1.59%
|
11/1/2012
|
$39.11
|
PP = $40.15
|
|
MB = $42.16
|
Most Recent Note - 2/4/2013 12:51:30 PM
G - Hovering at its 52-week high today, extended from its prior base. Prior highs and 50 DMA line coincide near $41 defining important chart support to watch on pullbacks.
>>> The latest Featured Stock Update with an annotated graph appeared on 1/24/2013. Click here.
View all notes |
Alert me of new notes |
CANSLIM.net Company Profile |
SEC |
Zacks Reports |
StockTalk |
News |
Chart |
Request a new note
C
A N
S L
I M
|
Symbol/Exchange
Company Name
Industry Group |
PRICE |
CHANGE
(%Change) |
Day High |
Volume
(% DAV)
(% 50 day avg vol) |
52 Wk Hi
% From Hi |
Featured
Date |
Price
Featured |
Pivot Featured |
|
Max Buy |
VRX
-
NYSE
Valeant Pharmaceuticals
DRUGS - Drug Manufacturers - Other
|
$66.41
|
-0.84
-1.25% |
$67.16
|
1,606,077
105.73% of 50 DAV
50 DAV is 1,519,000
|
$67.65
-1.83%
|
12/20/2012
|
$60.24
|
PP = $61.21
|
|
MB = $64.27
|
Most Recent Note - 2/4/2013 6:35:07 PM
G - Retreated from its 52-week high with higher (near average) volume behind today's loss. It is extended from its prior base, and its 50 DMA coincides with prior highs near $61 defining near-term chart support to watch on pullbacks.
>>> The latest Featured Stock Update with an annotated graph appeared on 1/28/2013. Click here.
View all notes |
Alert me of new notes |
CANSLIM.net Company Profile |
SEC |
Zacks Reports |
StockTalk |
News |
Chart |
Request a new note
C
A N
S L
I M
|
|
|
|
THESE ARE NOT BUY RECOMMENDATIONS!
Comments contained in the body of this report are technical
opinions only. The material herein has been obtained
from sources believed to be reliable and accurate, however,
its accuracy and completeness cannot be guaranteed.
This site is not an investment advisor, hence it does
not endorse or recommend any securities or other investments.
Any recommendation contained in this report may not
be suitable for all investors and it is not to be deemed
an offer or solicitation on our part with respect to
the purchase or sale of any securities. All trademarks,
service marks and trade names appearing in this report
are the property of their respective owners, and are
likewise used for identification purposes only.
This report is a service available
only to active Paid Premium Members.
You may opt-out of receiving report notifications
at any time. Questions or comments may be submitted
by writing to Premium Membership Services 665 S.E. 10 Street, Suite 201 Deerfield Beach, FL 33441-5634 or by calling 1-800-965-8307
or 954-785-1121.
|
|
|

