You are not logged in.
This means you
CAN ONLY VIEW reports that were published prior to Monday, April 14, 2025.
You
MUST UPGRADE YOUR MEMBERSHIP if you want to see any current reports.
AFTER MARKET UPDATE - FRIDAY, FEBRUARY 4TH, 2011
Previous After Market Report Next After Market Report >>>
|
|
|
|
DOW |
+29.89 |
12,092.15 |
+0.25% |
|
Volume |
920,365,140 |
-8% |
|
Volume |
1,915,685,370 |
+1% |
|
NASDAQ |
+15.42 |
2,769.30 |
+0.56% |
|
Advancers |
1,482 |
48% |
|
Advancers |
1,281 |
46% |
|
S&P 500 |
+3.77 |
1,310.87 |
+0.29% |
|
Decliners |
1,515 |
49% |
|
Decliners |
1,361 |
49% |
|
Russell 2000 |
+1.48 |
800.11 |
+0.19% |
|
52 Wk Highs |
221 |
|
|
52 Wk Highs |
167 |
|
|
S&P 600 |
+0.66 |
424.22 |
+0.16% |
|
52 Wk Lows |
12 |
|
|
52 Wk Lows |
25 |
|
|
 |
Major Averages Continue Charging To New Recovery Highs
Kenneth J. Gruneisen - Passed the CAN SLIM® Master's Exam
For the week, the Dow Jones Industrial Average gained +2.2%, the S&P 500 Index rose +2.7%, and the tech-heavy Nasdaq Composite Index closed up +3.1%. The volume totals were reported slightly higher on the Nasdaq and slightly lower on the NYSE versus the prior session totals. Declining issues narrowly outnumbered advancers New 52-week highs outnumbered new 52-week lows on the NYSE and on the Nasdaq exchange. There was a total of 85 high-ranked companies from the CANSLIM.net Leaders List that made new 52-week highs and appeared on the CANSLIM.net BreakOuts Page, up from the total of 54 on the prior session. On the Featured Stocks Page there were gains from 17 of the 21 high-ranked market leaders.
The major averages once again overcame early losses, and stocks continued tacking on gains in the final hour Friday while capping a positive week on Wall Street. The January unemployment rate fell to 9.0%, the lowest since April 2009. That was the good news. The bad news was that the number of new jobs increased less than expected. The Labor Department said severe winter weather distorted the figures.
Technology stocks were the star of the day. Makers of fiber-optic network gear advanced after JDS Uniphase (JDSU +27%) posted better-than-expected earnings. Aetna Inc (AET +12.5%) rallied after the insurer boosted its dividend and reported earnings that beat estimates. Meanwhile, energy stocks were under pressure as oil prices turned lower. The standoff in Egypt continued, but the possibility of a peaceful transition of power appeared to increase.
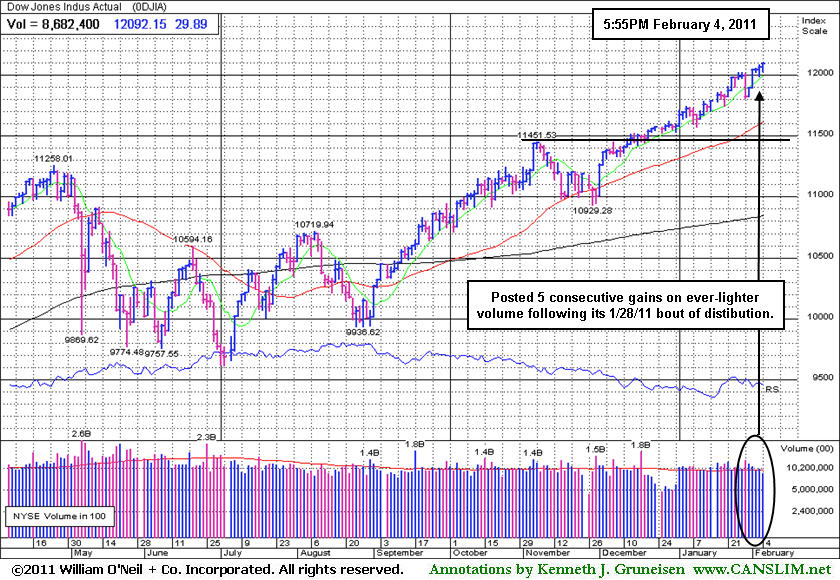
After the first positive January in four years, the stock market is off to the races in February while a strong rally remains in progress on Wall Street. This week the Dow Jones Industrial Average, Nasdaq Composite Index, S&P 500 Index, and the Mid-Cap S&P 400 Index collectively hit new recovery highs. Be ready to check out the soon-to-be published February 2011 issue of CANSLIM.net News for a comprehensive overview of current market conditions, leading groups, and the most recent featured stocks.
PICTURED: The Dow Jones Industrial Average has posted 5 consecutive gains on ever-lighter volume following its 1/28/11 bout of distribution.
|
 Kenneth J. Gruneisen started out as a licensed stockbroker in August 1987, a couple of months prior to the historic stock market crash that took the Dow Jones Industrial Average down -22.6% in a single day. He has published daily fact-based fundamental and technical analysis on high-ranked stocks online for two decades. Through FACTBASEDINVESTING.COM, Kenneth provides educational articles, news, market commentary, and other information regarding proven investment systems that work in good times and bad.
Comments contained in the body of this report are technical opinions only and are not necessarily those of Gruneisen Growth Corp. The material herein has been obtained from sources believed to be reliable and accurate, however, its accuracy and completeness cannot be guaranteed. Our firm, employees, and customers may effect transactions, including transactions contrary to any recommendation herein, or have positions in the securities mentioned herein or options with respect thereto. Any recommendation contained in this report may not be suitable for all investors and it is not to be deemed an offer or solicitation on our part with respect to the purchase or sale of any securities. |
|
 |
Networking Group Leading Tech Rally
Kenneth J. Gruneisen - Passed the CAN SLIM® Master's Exam
The tech sector saw solid gains from the Networking Index ($NWX +3.61%) and Semiconductor Index ($SOX +2.08%) on Friday, followed by smaller gains from the Internet Index ($IIX +1.01%) and Biotechnology Index ($BTK +0.22%). The Retail Index ($RLX +1.05%) and the Healthcare Index ($HMO +0.89%) had a positive bias. Financial shares were especially quiet as the Broker/Dealer Index ($XBD +0.02%) and Bank Index ($BKX +0.06%) both finished virtually unchanged. Meanwhile, commodity-linked groups faced pressure and the Oil Services Index ($OSX -0.84%), Integrated Oil Index ($XOI -0.61%), and Gold & Silver Index ($XAU -0.76%) collectively closed with modest losses.
Charts courtesy www.stockcharts.com
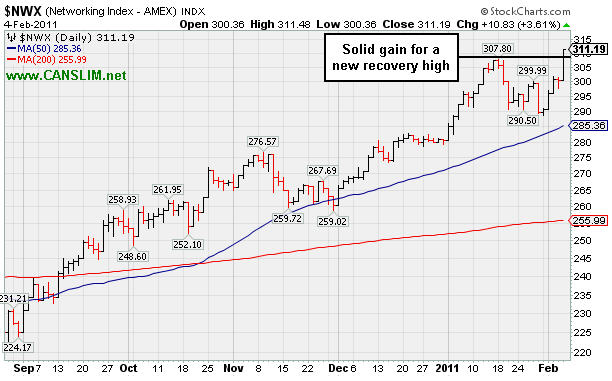
PICTURED: The Networking Index ($NWX +3.61%) posted a solid gain for a new recovery high. The action is reassuring concerning the L criteria for companies in the Computer Networking industry.
| Oil Services |
$OSX |
267.85 |
-2.28 |
-0.84% |
+9.27% |
| Healthcare |
$HMO |
1,928.48 |
+16.92 |
+0.89% |
+13.98% |
| Integrated Oil |
$XOI |
1,300.64 |
-7.99 |
-0.61% |
+7.21% |
| Semiconductor |
$SOX |
463.11 |
+9.45 |
+2.08% |
+12.45% |
| Networking |
$NWX |
311.19 |
+10.84 |
+3.61% |
+10.92% |
| Internet |
$IIX |
324.81 |
+3.26 |
+1.01% |
+5.55% |
| Broker/Dealer |
$XBD |
124.31 |
+0.03 |
+0.02% |
+2.30% |
| Retail |
$RLX |
507.22 |
+5.29 |
+1.05% |
-0.23% |
| Gold & Silver |
$XAU |
207.25 |
-1.59 |
-0.76% |
-8.53% |
| Bank |
$BKX |
54.14 |
+0.03 |
+0.06% |
+3.70% |
| Biotech |
$BTK |
1,292.28 |
+2.84 |
+0.22% |
-0.41% |
|
|
|
 |
Longer-Term Upward Trendline Recently Being Tested
Kenneth J. Gruneisen - Passed the CAN SLIM® Master's Exam
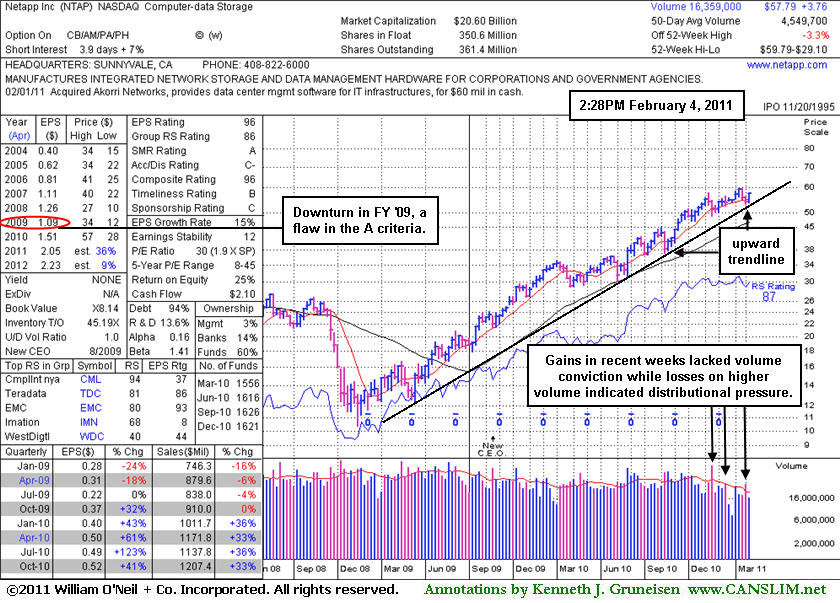
Network Appliance Inc's (NTAP +$0.92 or +1.61% to $57.93) quiet gains this week have it perched only -3.1% off its 52 week high after recently showing some resilience near its 50-day moving average (DMA) line. More damaging losses below the recently noted chart low ($53.14 on 1/25/11) could raise greater concerns and trigger more serious technical sell signals. It has recently traded near a longer-term upward trendline shown on its weekly graph below. Any subsequent violation of that longer-term trendline might be considered an ominous sign. Keep in mind it is still a couple of weeks away from reporting its earnings results (scheduled for Feb 16th after the close) and the latest results are likely to be a catalyst for more decisive action.
NTAP wedged to new highs without great volume conviction and then raised concerns. It endured distributional pressure and violated the shorter-term upward trendline shown on the daily graph included in this FSU section on 12/27/10 under the headline "Upward Trendline and 50 Day Average Line Define Near-Term Support".
Practitioners of this fact-based investment system know to look for stocks that are being discovered and accumulated by the institutional crowd. In this case, institutional ownership (I criteria) is already very substantial, and the number of top-rated funds owning its shares fell from 1,626 in Sept '10 to 1,621 in Dec '10. (NOTE: Prior notes on this and other stocks cited top-rated US funds, and now our source is including foreign funds and hedge funds in their totals reported).
Recent quarterly comparisons (C criteria) showed better sales revenues and strong earnings increases, but a down turn in its FY '09 earnings has been noted as a concern with respect to its annual earnings (A criteria) history. Long ago, this stock was featured on Thursday, March 30th, 2006 in the CANSLIM.net Mid Day Breakouts Report (read here). In May 2006, weak action resulted in it being dropped from the Featured Stocks list.
|
|
|
Color Codes Explained :
Y - Better candidates highlighted by our
staff of experts.
G - Previously featured
in past reports as yellow but may no longer be buyable under the
guidelines.
***Last / Change / Volume data in this table is the closing quote data***
Symbol/Exchange
Company Name
Industry Group |
PRICE |
CHANGE
(%Change) |
Day High |
Volume
(% DAV)
(% 50 day avg vol) |
52 Wk Hi
% From Hi |
Featured
Date |
Price
Featured |
Pivot Featured |
|
Max Buy |
BIDU
-
NASDAQ
Baidu Inc Ads
INTERNET - Internet Information Providers
|
$117.68
|
-0.82
-0.69% |
$118.90
|
4,826,849
61.75% of 50 DAV
50 DAV is 7,817,300
|
$119.21
-1.28%
|
2/1/2011
|
$117.74
|
PP = $112.08
|
|
MB = $117.68
|
Most Recent Note - 2/4/2011
Y - Holding its ground in a tight range since gapping up on 2/01/11 rising from a "double bottom" base pattern. Color code was changed to yellow with pivot point cited based upon its 12/07/10 high. It rebounded above its 50 DMA line in recent weeks. It stayed well above its 200 DMA line in the interim since it was dropped from the Featured Stocks list on 12/27/10.
>>> The latest Featured Stock Update with an annotated graph appeared on 2/2/2011. Click here.
View all notes |
Alert me of new notes |
CANSLIM.net Company Profile |
SEC |
Zacks Reports |
StockTalk |
News |
Chart |
Request a new note
C
A N
S L
I M


|
CRUS
-
NASDAQ
Cirrus Logic Inc
ELECTRONICS - Semiconductor - Specialized
|
$24.81
|
+1.20
5.08% |
$25.05
|
7,325,947
212.37% of 50 DAV
50 DAV is 3,449,600
|
$23.82
4.16%
|
1/28/2011
|
$20.69
|
PP = $19.17
|
|
MB = $20.13
|
 Most Recent Note - 2/4/2011 12:39:03 PM
G - Patience may allow for secondary buy points to develop. Rallying for a 5th consecutive volume-driven gain today, getting more extended from a sound base. Prior highs define chart support levels to watch on pullbacks.
>>> The latest Featured Stock Update with an annotated graph appeared on 1/28/2011. Click here.
View all notes |
Alert me of new notes |
CANSLIM.net Company Profile |
SEC |
Zacks Reports |
StockTalk |
News |
Chart |
Request a new note
C
A N
S L
I M
|
DECK
-
NASDAQ
Deckers Outdoor Corp
CONSUMER NON-DURABLES - Textile - Apparel Footwear
|
$80.94
|
+1.33
1.67% |
$81.44
|
1,204,608
63.62% of 50 DAV
50 DAV is 1,893,500
|
$87.88
-7.90%
|
2/3/2011
|
$79.61
|
PP = $82.67
|
|
MB = $86.80
|
Most Recent Note - 2/4/2011 4:16:00 PM
Y - A streak of 4 consecutive gains with below average volume helped it rise further above its 50 DMA line, helping its outlook improve. Color code was changed to yellow with new pivot point cited based on its 1/11/11 high while forming a double bottom base pattern.
>>> The latest Featured Stock Update with an annotated graph appeared on 1/26/2011. Click here.
View all notes |
Alert me of new notes |
CANSLIM.net Company Profile |
SEC |
Zacks Reports |
StockTalk |
News |
Chart |
Request a new note
C
A N
S L
I M
|
EZCH
-
NASDAQ
Ezchip Semiconductor Ltd
ELECTRONICS - Semiconductor - Specialized
|
$30.88
|
+0.10
0.32% |
$31.31
|
272,313
90.20% of 50 DAV
50 DAV is 301,900
|
$33.20
-6.99%
|
12/2/2010
|
$27.53
|
PP = $26.00
|
|
MB = $27.30
|
Most Recent Note - 2/4/2011 4:17:23 PM
G - Posted a 4th consecutive small gain today while consolidating above its 50 DMA line and prior chart highs in the $29 area which now coincide defining important support to watch.
>>> The latest Featured Stock Update with an annotated graph appeared on 1/21/2011. Click here.
View all notes |
Alert me of new notes |
CANSLIM.net Company Profile |
SEC |
Zacks Reports |
StockTalk |
News |
Chart |
Request a new note
C
A N
S L
I M
|
EZPW
-
NASDAQ
Ezcorp Inc Cl A
SPECIALTY RETAIL - Specialty Retail, Other
|
$27.29
|
-0.19
-0.67% |
$27.46
|
202,375
48.57% of 50 DAV
50 DAV is 416,700
|
$29.94
-8.85%
|
11/5/2010
|
$24.02
|
PP = $23.85
|
|
MB = $25.04
|
Most Recent Note - 2/4/2011 4:20:39 PM
G - Volume totals have been cooling while consolidating near its 50 DMA line, showing resilience after damaging distribution. It is not near any sound base, and its recent low ($25.56 on 1/25/11) defines an important support level now. See the latest FSU analysis for more details and an annotated graph.
>>> The latest Featured Stock Update with an annotated graph appeared on 2/3/2011. Click here.
View all notes |
Alert me of new notes |
CANSLIM.net Company Profile |
SEC |
Zacks Reports |
StockTalk |
News |
Chart |
Request a new note
C
A N
S L
I M
|
Symbol/Exchange
Company Name
Industry Group |
PRICE |
CHANGE
(%Change) |
Day High |
Volume
(% DAV)
(% 50 day avg vol) |
52 Wk Hi
% From Hi |
Featured
Date |
Price
Featured |
Pivot Featured |
|
Max Buy |
FOSL
-
NASDAQ
Fossil Inc
CONSUMER DURABLES - Recreational Goods, Other
|
$76.56
|
+2.41
3.25% |
$76.67
|
644,436
91.15% of 50 DAV
50 DAV is 707,000
|
$74.75
2.42%
|
2/1/2011
|
$73.30
|
PP = $74.44
|
|
MB = $78.16
|
Most Recent Note - 2/4/2011 4:25:40 PM
Y - Hit another new 52-week high today with a 2nd consecutive gain on light volume, inching up above its pivot point from an orderly 8-week flat base. Color code was changed to yellow with new pivot point cited, however it may be considered a riskier "late-stage" base. Great volume conviction is a critical element needed to confirm a new (or add-on) technical buy signal. Recent chart low ($66.05 on 1/25/11) defines important support
>>> The latest Featured Stock Update with an annotated graph appeared on 1/12/2011. Click here.
View all notes |
Alert me of new notes |
CANSLIM.net Company Profile |
SEC |
Zacks Reports |
StockTalk |
News |
Chart |
Request a new note
C
A N
S L
I M
|
HMSY
-
NASDAQ
H M S Holdings Corp
COMPUTER SOFTWARE and SERVICES - Healthcare Information Service
|
$65.98
|
+0.33
0.50% |
$66.10
|
128,850
89.11% of 50 DAV
50 DAV is 144,600
|
$67.42
-2.14%
|
11/19/2010
|
$61.89
|
PP = $63.01
|
|
MB = $66.16
|
Most Recent Note - 2/4/2011 4:27:23 PM
G - This week's gains with light volume helped it find support at its 50 DMA line and finish only -2.1% off its 52-week high. It is building a base-on-base type pattern, but its waning Relative Strength rank (now 72) has been noted as a concern.
>>> The latest Featured Stock Update with an annotated graph appeared on 1/3/2011. Click here.
View all notes |
Alert me of new notes |
CANSLIM.net Company Profile |
SEC |
Zacks Reports |
StockTalk |
News |
Chart |
Request a new note
C
A N
S L
I M
|
JOBS
-
NASDAQ
Fifty One Job Inc Ads
DIVERSIFIED SERVICES - Staffing and; Outsourcing Service
|
$57.95
|
+0.21
0.36% |
$58.00
|
33,005
23.26% of 50 DAV
50 DAV is 141,900
|
$61.28
-5.43%
|
10/13/2010
|
$42.07
|
PP = $40.60
|
|
MB = $42.63
|
Most Recent Note - 2/4/2011 4:35:44 PM
G - Posted 5 small gains on ever-lighter volume this week while rising up from its 50 DMA line that defines important support. More damaging losses would raise concerns and trigger a technical sell signal.
>>> The latest Featured Stock Update with an annotated graph appeared on 12/30/2010. Click here.
View all notes |
Alert me of new notes |
CANSLIM.net Company Profile |
SEC |
Zacks Reports |
StockTalk |
News |
Chart |
Request a new note
C
A N
S L
I M
|
LULU
-
NASDAQ
Lululemon Athletica
MANUFACTURING - Textile Manufacturing
|
$76.96
|
+4.95
6.87% |
$77.35
|
4,273,224
204.31% of 50 DAV
50 DAV is 2,091,500
|
$74.60
3.16%
|
1/26/2011
|
$68.11
|
PP = $74.70
|
|
MB = $78.44
|
Most Recent Note - 2/4/2011 4:39:00 PM
Y - Hit a new 52-week high while posting a convincing gain above its pivot point with more than 2 times average volume and finishing near the session high today, triggering a technical buy signal.
>>> The latest Featured Stock Update with an annotated graph appeared on 1/14/2011. Click here.
View all notes |
Alert me of new notes |
CANSLIM.net Company Profile |
SEC |
Zacks Reports |
StockTalk |
News |
Chart |
Request a new note
C
A N
S L
I M
|
MWIV
-
NASDAQ
M W I Veterinary Supply
HEALTH SERVICES - Medical Instruments and; Supplies
|
$65.85
|
+1.49
2.32% |
$66.00
|
71,651
127.04% of 50 DAV
50 DAV is 56,400
|
$67.13
-1.91%
|
11/4/2010
|
$61.79
|
PP = $59.60
|
|
MB = $62.58
|
Most Recent Note - 2/4/2011 4:42:01 PM
G - Closed near the session high with a gain on slightly above average volume. Reported earnings +38% on +55% sales revenues for the quarter ended December 31, 2010. Perched within close striking range of its all-time high after finding support near its 50 DMA line recently. Sales revenues acceleration (bigger percentage increases sequentially) is a very reassuring sign. See the latest FSU analysis for details and an annotated graph.
>>> The latest Featured Stock Update with an annotated graph appeared on 2/2/2011. Click here.
View all notes |
Alert me of new notes |
CANSLIM.net Company Profile |
SEC |
Zacks Reports |
StockTalk |
News |
Chart |
Request a new note
C
A N
S L
I M
|
Symbol/Exchange
Company Name
Industry Group |
PRICE |
CHANGE
(%Change) |
Day High |
Volume
(% DAV)
(% 50 day avg vol) |
52 Wk Hi
% From Hi |
Featured
Date |
Price
Featured |
Pivot Featured |
|
Max Buy |
NFLX
-
NASDAQ
Netflix Inc
SPECIALTY RETAIL - Music and Video Stores
|
$220.07
|
+8.58
4.06% |
$221.00
|
6,321,642
104.50% of 50 DAV
50 DAV is 6,049,600
|
$218.00
0.95%
|
1/10/2011
|
$187.88
|
PP = $209.34
|
|
MB = $219.81
|
Most Recent Note - 2/4/2011 4:44:01 PM
G - Gain today with average volume led to a close just above its "max buy" level, and its color code is changed to green. Prior highs define support to watch above its 50 DMA line.
>>> The latest Featured Stock Update with an annotated graph appeared on 1/10/2011. Click here.
View all notes |
Alert me of new notes |
CANSLIM.net Company Profile |
SEC |
Zacks Reports |
StockTalk |
News |
Chart |
Request a new note
C
A N
S L
I M
|
NTAP
-
NASDAQ
Netapp Inc
COMPUTER HARDWARE - Data Storage Devices
|
$57.93
|
+0.92
1.61% |
$58.13
|
3,336,404
72.10% of 50 DAV
50 DAV is 4,627,600
|
$59.79
-3.11%
|
1/6/2011
|
$57.49
|
PP = $58.06
|
|
MB = $60.96
|
Most Recent Note - 2/4/2011 4:46:31 PM
G - Gains this week with light volume have it trading up after finding support near its 50 DMA line. More damaging losses below its recent chart low ($53.14 on 1/25/11) could raise greater concerns and trigger a more serious technical sell signal.
>>> The latest Featured Stock Update with an annotated graph appeared on 2/4/2011. Click here.
View all notes |
Alert me of new notes |
CANSLIM.net Company Profile |
SEC |
Zacks Reports |
StockTalk |
News |
Chart |
Request a new note
C
A N
S L
I M
|
OPEN
-
NASDAQ
Opentable Inc
INTERNET - Internet Software and Services
|
$84.58
|
+0.82
0.98% |
$85.95
|
1,094,508
139.61% of 50 DAV
50 DAV is 784,000
|
$83.76
0.98%
|
1/5/2011
|
$74.05
|
PP = $76.79
|
|
MB = $80.63
|
Most Recent Note - 2/4/2011 4:47:52 PM
G - Gain today with above average volume, rising further above its "max buy" level for another new all-time high. Color code was changed to green after getting extended from its prior base. Recent lows and its 50 DMA line define near-term chart support.
>>> The latest Featured Stock Update with an annotated graph appeared on 1/5/2011. Click here.
View all notes |
Alert me of new notes |
CANSLIM.net Company Profile |
SEC |
Zacks Reports |
StockTalk |
News |
Chart |
Request a new note
C
A N
S L
I M
|
ORCL
-
NASDAQ
Oracle Corp
COMPUTER SOFTWARE and SERVICES - Application Software
|
$32.62
|
-0.37
-1.12% |
$32.98
|
38,688,579
137.30% of 50 DAV
50 DAV is 28,177,800
|
$33.56
-2.80%
|
1/20/2011
|
$32.31
|
PP = $32.37
|
|
MB = $33.99
|
Most Recent Note - 2/4/2011 4:49:44 PM
Y - Endured some distributional pressure today but still closed above its pivot point after hitting a new 52-week high this week. Near-term support to watch is its 50 DMA line.
>>> The latest Featured Stock Update with an annotated graph appeared on 1/7/2011. Click here.
View all notes |
Alert me of new notes |
CANSLIM.net Company Profile |
SEC |
Zacks Reports |
StockTalk |
News |
Chart |
Request a new note
C
A N
S L
I M
|
PAY
-
NYSE
Verifone Systems Inc
COMPUTER HARDWARE - Transaction Automation Systems
|
$42.98
|
+0.60
1.42% |
$43.19
|
723,988
46.95% of 50 DAV
50 DAV is 1,542,000
|
$44.87
-4.21%
|
1/27/2011
|
$41.77
|
PP = $44.00
|
|
MB = $46.20
|
Most Recent Note - 2/4/2011 4:50:43 PM
Y - Today it posted a 4th consecutive small gain on ever-lighter volume, inching up from support at its 50 DMA line. Color code was changed to yellow when a new pivot point was recently cited based on its 52-week high plus ten cents. Subsequent gains with heavy volume may trigger a new (or add-on) technical buy signal.
>>> The latest Featured Stock Update with an annotated graph appeared on 1/27/2011. Click here.
View all notes |
Alert me of new notes |
CANSLIM.net Company Profile |
SEC |
Zacks Reports |
StockTalk |
News |
Chart |
Request a new note
C
A N
S L
I M
|
Symbol/Exchange
Company Name
Industry Group |
PRICE |
CHANGE
(%Change) |
Day High |
Volume
(% DAV)
(% 50 day avg vol) |
52 Wk Hi
% From Hi |
Featured
Date |
Price
Featured |
Pivot Featured |
|
Max Buy |
PCLN
-
NASDAQ
Priceline.Com Inc
INTERNET - Internet Software and Services
|
$433.43
|
-2.56
-0.59% |
$440.00
|
1,114,134
119.08% of 50 DAV
50 DAV is 935,600
|
$444.95
-2.59%
|
11/1/2002
|
$399.55
|
PP = $428.20
|
|
MB = $449.61
|
Most Recent Note - 2/4/2011 4:53:44 PM
Y - Trading in a tight range near its 52-week high since its 1/05/11 technical breakout, consolidating above its 50 DMA line and above its pivot point yet below its "max buy" level.
>>> The latest Featured Stock Update with an annotated graph appeared on 1/2/2011. Click here.
View all notes |
Alert me of new notes |
CANSLIM.net Company Profile |
SEC |
Zacks Reports |
StockTalk |
News |
Chart |
Request a new note
C
A N
S L
I M
|
RAX
-
NYSE
Rackspace Hosting Inc
INTERNET - Internet Software and; Services
|
$36.09
|
+1.03
2.94% |
$36.14
|
1,423,074
82.78% of 50 DAV
50 DAV is 1,719,000
|
$36.53
-1.20%
|
1/10/2011
|
$22.84
|
PP = $32.76
|
|
MB = $34.40
|
Most Recent Note - 2/4/2011 4:55:46 PM
G - Up on lighter volume today for a new high close, extended from any sound base. Found prompt support near its 50 DMA line recently
>>> The latest Featured Stock Update with an annotated graph appeared on 12/31/2010. Click here.
View all notes |
Alert me of new notes |
CANSLIM.net Company Profile |
SEC |
Zacks Reports |
StockTalk |
News |
Chart |
Request a new note
C
A N
S L
I M
|
ROVI
-
NASDAQ
Rovi Corp
COMPUTER SOFTWARE andamp; SERVICES - Security Software andamp; Services
|
$63.68
|
+0.73
1.16% |
$64.01
|
865,121
51.91% of 50 DAV
50 DAV is 1,666,700
|
$69.50
-8.37%
|
10/29/2010
|
$49.99
|
PP = $53.10
|
|
MB = $55.76
|
Most Recent Note - 2/4/2011 4:57:24 PM
G - Consolidating above its 50 DMA line after finding support near that important short-term average. The 1/10/11 low ($58.51) defines another near-term chart support level to watch.
>>> The latest Featured Stock Update with an annotated graph appeared on 1/25/2011. Click here.
View all notes |
Alert me of new notes |
CANSLIM.net Company Profile |
SEC |
Zacks Reports |
StockTalk |
News |
Chart |
Request a new note
C
A N
S L
I M
|
TIBX
-
NASDAQ
Tibco Software Inc
COMPUTER SOFTWARE and SERVICES - Business Software and Services
|
$24.26
|
+0.19
0.79% |
$24.50
|
1,891,871
68.97% of 50 DAV
50 DAV is 2,743,200
|
$24.41
-0.61%
|
2/1/2011
|
$24.35
|
PP = $22.18
|
|
MB = $23.29
|
Most Recent Note - 2/4/2011 5:02:14 PM
G - Small gain today for a new 52-week high with light volume. Rose from an orderly flat base this week and quickly got extended from its "late-stage" or riskier base. Color code is changed to green, meanwhile disciplined investors may watch for light volume pullbacks toward prior resistance. Previously noted its streak of 4 quarterly comparisons with +25% earnings (good C criteria) increases with good sales revenues growth. It also has a good annual earnings (A criteria) history, and leadership (L criteria) in the Computer Software - Database group is reassuring.
>>> The latest Featured Stock Update with an annotated graph appeared on 2/2/2011. Click here.
View all notes |
Alert me of new notes |
CANSLIM.net Company Profile |
SEC |
Zacks Reports |
StockTalk |
News |
Chart |
Request a new note
C
A N
S L
I M
|
UA
-
NYSE
Under Armour Inc Cl A
CONSUMER NON-DURABLES - Textile - Apparel Clothing
|
$63.70
|
+3.44
5.71% |
$64.95
|
1,528,554
205.95% of 50 DAV
50 DAV is 742,200
|
$60.98
4.46%
|
1/27/2011
|
$58.31
|
PP = $56.99
|
|
MB = $59.84
|
Most Recent Note - 2/4/2011 1:49:55 PM
G - Considerable gain above recent $60 resistance for a new 52-week high today. It is extended from a previously noted "double bottom" base pattern. Recent highs and its 50 DMA line define chart support to watch in the $56 area.
>>> The latest Featured Stock Update with an annotated graph appeared on 2/1/2011. Click here.
View all notes |
Alert me of new notes |
CANSLIM.net Company Profile |
SEC |
Zacks Reports |
StockTalk |
News |
Chart |
Request a new note
C
A N
S L
I M
|
Symbol/Exchange
Company Name
Industry Group |
PRICE |
CHANGE
(%Change) |
Day High |
Volume
(% DAV)
(% 50 day avg vol) |
52 Wk Hi
% From Hi |
Featured
Date |
Price
Featured |
Pivot Featured |
|
Max Buy |
ULTA
-
NASDAQ
Ulta Salon Cosm & Frag
SPECIALTY RETAIL - Specialty Retail, Other
|
$40.07
|
+1.12
2.88% |
$40.34
|
769,474
124.85% of 50 DAV
50 DAV is 616,300
|
$39.76
0.78%
|
1/6/2011
|
$36.12
|
PP = $37.34
|
|
MB = $39.21
|
Most Recent Note - 2/4/2011 5:21:02 PM
Y - Hit another new 52-week high today after its confirming gain on 2/03/11 with +79% above average volume. Its 50 DMA line defines important chart support to watch.
>>> The latest Featured Stock Update with an annotated graph appeared on 1/6/2011. Click here.
View all notes |
Alert me of new notes |
CANSLIM.net Company Profile |
SEC |
Zacks Reports |
StockTalk |
News |
Chart |
Request a new note
C
A N
S L
I M
|
|
|
|
THESE ARE NOT BUY RECOMMENDATIONS!
Comments contained in the body of this report are technical
opinions only. The material herein has been obtained
from sources believed to be reliable and accurate, however,
its accuracy and completeness cannot be guaranteed.
This site is not an investment advisor, hence it does
not endorse or recommend any securities or other investments.
Any recommendation contained in this report may not
be suitable for all investors and it is not to be deemed
an offer or solicitation on our part with respect to
the purchase or sale of any securities. All trademarks,
service marks and trade names appearing in this report
are the property of their respective owners, and are
likewise used for identification purposes only.
This report is a service available
only to active Paid Premium Members.
You may opt-out of receiving report notifications
at any time. Questions or comments may be submitted
by writing to Premium Membership Services 665 S.E. 10 Street, Suite 201 Deerfield Beach, FL 33441-5634 or by calling 1-800-965-8307
or 954-785-1121.
|
|
|

