You are not logged in.
This means you
CAN ONLY VIEW reports that were published prior to Monday, April 14, 2025.
You
MUST UPGRADE YOUR MEMBERSHIP if you want to see any current reports.
AFTER MARKET UPDATE - THURSDAY, FEBRUARY 4TH, 2010
Previous After Market Report Next After Market Report >>>
|
|
|
|
DOW |
-268.37 |
10,002.18 |
-2.61% |
|
Volume |
1,483,203,520 |
+40% |
|
Volume |
2,894,210,550 |
+21% |
|
NASDAQ |
-65.48 |
2,125.43 |
-2.99% |
|
Advancers |
273 |
9% |
|
Advancers |
385 |
14% |
|
S&P 500 |
-34.17 |
1,063.11 |
-3.11% |
|
Decliners |
2,840 |
90% |
|
Decliners |
2,338 |
83% |
|
Russell 2000 |
-20.98 |
589.68 |
-3.44% |
|
52 Wk Highs |
37 |
|
|
52 Wk Highs |
14 |
|
|
S&P 600 |
-10.26 |
314.08 |
-3.16% |
|
52 Wk Lows |
16 |
|
|
52 Wk Lows |
42 |
|
|
 |
Downdraft Continues As Widespread Losses End Latest Rally Attempt
Adam Sarhan, Contributing Writer,
Stocks got whacked on Thursday sending all of the major averages below Monday's lows as the dollar rallied. Volume was heavier than the prior session on the NYSE and Nasdaq exchange which signaled large institutions were aggressively selling stocks. Decliners trumped advancers by over a 7-to-1 ratio on the NYSE and over a 6-to-1 ratio on the Nasdaq exchange. There were only 3 high-ranked companies from the CANSLIM.net Leaders List that made a new 52-week high and appeared on the CANSLIM.net BreakOuts Page, lower than the 10 issues that appeared on the prior session. New 52-week highs outnumbered new 52-week lows on the NYSE but trailed on the Nasdaq exchange.
Stocks and commodities got smacked as the dollar rallied after concern spread that the global economic recovery may slow. Before Thursday's opening bell, the Labor Department reported that US jobless claims unexpectedly rose last week and concern spread that growing sovereign debt may derail the recovery. The euro plunged to its lowest level since May 2009 as the dollar soared well above its longer term 200 day moving average line. Lackluster bond auctions in Portugal and Spain triggered the sell off and led many to question the underlying health of the European Union. In other news, the European Central Bank (ECB) held rates steady at a record low of 1%. ECB president Jean-Claude Trichet said he is “confident” that Greece is moving in the right direction as it tries to curb its ballooning deficit but did not address the broader concerns.
So far, over half of the companies in the S&P 500 have released their Q4 results and the vast majority topped analysts estimates. Barring some unforeseen event, the S&P 500 is on track to snap a record nine quarter earnings slump as profits are expected to surge over +70% in the last three months of 2009. However, the market has sold off sharply since earnings season began which suggests large institutions are not happy with the results.
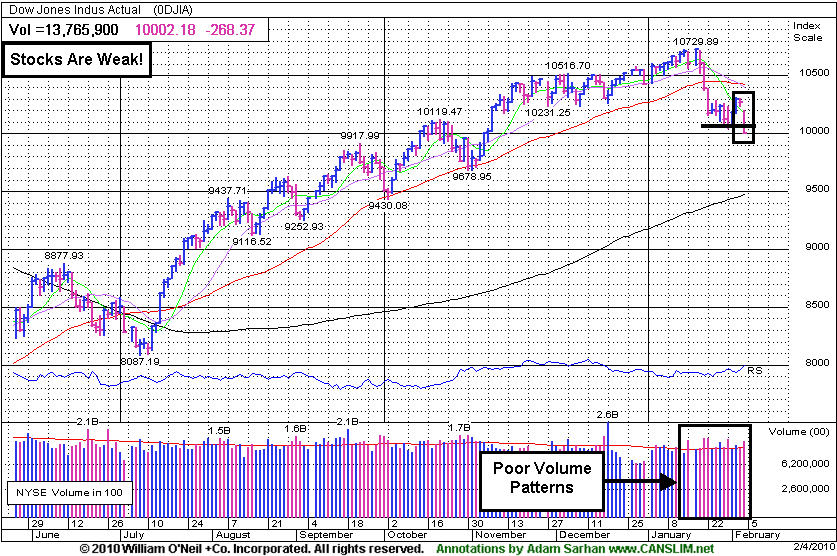
Looking at the market, Thursday's ominous action took out Monday's lows and effectively ended the brief rally attempt which suggests a steeper correction may unfold and resets the day count for a proper follow-through day to emerge. It is also important to see how the major averages react to their respective 50-day moving average (DMA) lines which were support and are now resistance. Until they all close above that important level the technical damage remaining on the charts is a concern. So far, the market's reaction has been tepid at best to the latest round of economic and earnings data. Remember that the recent series of distribution days coupled with the deleterious action in the major averages suggests large institutions are aggressively selling stocks. Disciplined investors will now wait for a new follow-through day to be produced before resuming any buying efforts. Until then, patience is paramount.
Professional Money Management Services - A Winning System - Inquire today!
Our skilled team of portfolio managers knows how to follow the rules of this fact-based investment system. We do not follow opinion or the "conviction list" of some large Wall Street institution which would have us fully invested even during horrific bear markets. Instead, we remain fluid and only buy the best stocks when they are triggering proper technical buy signals. If you are not completely satisfied with the way your portfolio is being managed, Click here to submit your inquiry. *Accounts over $250,000 please. ** Serious inquires only, please.
PICTURED: The Dow Jones Industrial Average violated Monday's lows, which means the day count is reset.
|
|
|
 |
Broad Selling Sends Stocks Lower
Adam Sarhan, Contributing Writer,
The bears showed up and sent all the leading industry groups lower as the dollar rallied. The Gold & Silver Index ($XAU -5.33%) led the way down, followed by losses from the Semiconductor Index ($SOX -4.44%) and Bank Index ($BKX -3.94%). Energy-related shares lost ground as the Oil Services Index ($OSX -3.92%) and Integrated Oil Index ($XOI -3.63%) slid. The Broker/Dealer Index ($XBD -3.75%), Biotechnology Index ($BTK -2.55%) and Networking Index ($NWX -2.44%) all ended with steep losses. The Internet Index ($IIX -2.43%), Healthcare Index ($HMO -2.37%) and Retail Index ($RLX -1.73%) also ended in the red.
Charts courtesy www.stockcharts.com
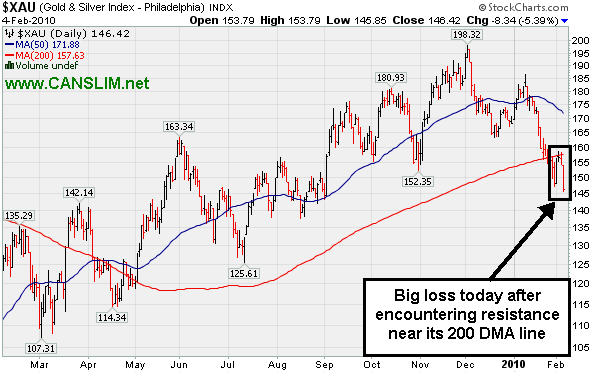
PICTURED: The Gold & Silver Index ($XAU -5.33%) suffered a big loss after encountering resistance near its longer term 200 DMA line.
| Oil Services |
$OSX |
191.11 |
-9.24 |
-4.61% |
-1.95% |
| Healthcare |
$HMO |
1,416.65 |
-44.06 |
-3.02% |
-3.82% |
| Integrated Oil |
$XOI |
1,001.48 |
-40.77 |
-3.91% |
-6.25% |
| Semiconductor |
$SOX |
312.53 |
-15.22 |
-4.64% |
-13.16% |
| Networking |
$NWX |
222.29 |
-5.98 |
-2.62% |
-3.80% |
| Internet |
$IIX |
217.54 |
-5.94 |
-2.66% |
-6.98% |
| Broker/Dealer |
$XBD |
108.78 |
-4.57 |
-4.03% |
-5.45% |
| Retail |
$RLX |
392.19 |
-9.16 |
-2.28% |
-4.60% |
| Gold & Silver |
$XAU |
146.42 |
-8.34 |
-5.39% |
-12.97% |
| Bank |
$BKX |
44.21 |
-1.99 |
-4.31% |
+3.51% |
| Biotech |
$BTK |
973.26 |
-24.94 |
-2.50% |
+3.30% |
|
|
|
 |
Gap Down and Waning EPS Rank Raise Concerns
Kenneth J. Gruneisen - Passed the CAN SLIM® Master's Exam
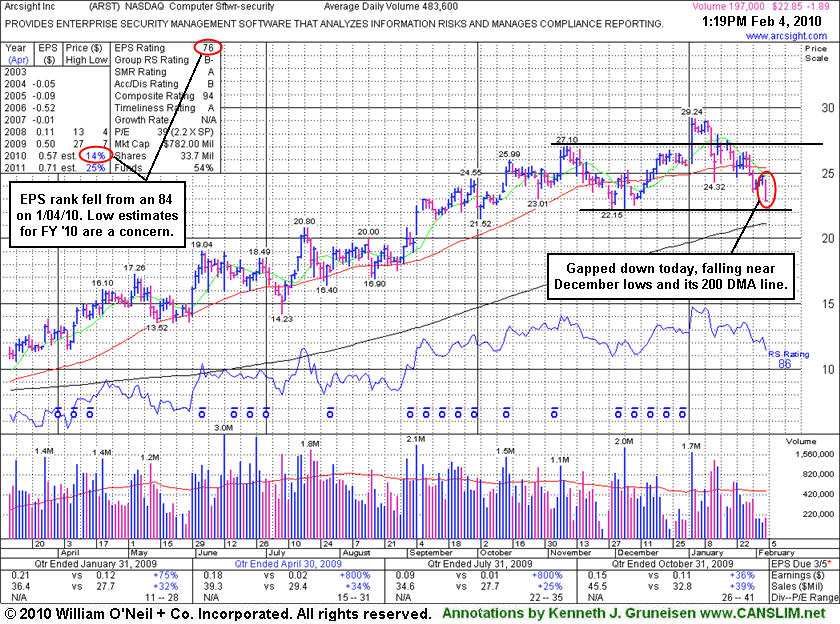
ArcSight, Inc. (ARST -$1.81 or -7.32% to $22.93) gapped down today, trading near its December lows and sinking toward its 200-day moving average (DMA) line. It would need to rebound above its 50 DMA line for its outlook to improve. Meanwhile, further deterioration below its prior lows or 200 DMA line would trigger additional sell signals. Distributional pressure negated its latest breakout. In the 1/21/10 Featured Stock Update (FSU) section (read here) we cautioned that its "close under its 12/31/09 close could prove to be a more ominous sign."
On January 4, 2010 it had gapped up and triggered a technical buy signal as it blasted above its latest pivot point. However, it failed to follow through with additional gains, then losses with above average volume negated its breakout and led to a close back in its prior base, raising concerns. In addition to the recent technical weakness, its Earnings Per Share (EPS) rank has fallen to 76 from 84 when it appeared in this FSU section on 1/04/10 under the headline "Breakout With Triple Average Volume Triggers Fresh Buy Signal." The Computer Software - Security firm has continued putting up solid sales revenues and earnings results since first featured in yellow at $19.91 in the 9/01/09 mid-day report with an annotated daily graph (read here). However, its waning EPS rank of late suggests that on a relative basis it has been lagging while other companies have been showing more explosive earnings growth during the current earnings season. ARST needs more time to potentially form a new sound base. Meanwhile, its weak action and market conditions (M criteria) leave disciplined investors waiting for a follow through day before any new buying efforts are justifiable under the investment system guidelines.
|
|
|
Color Codes Explained :
Y - Better candidates highlighted by our
staff of experts.
G - Previously featured
in past reports as yellow but may no longer be buyable under the
guidelines.
***Last / Change / Volume quote data in this table corresponds with the timestamp on the note***
Symbol/Exchange
Company Name
Industry Group |
Last |
Chg. |
Vol
% DAV |
Date Featured |
Price Featured |
Latest Pivot Point
Featured |
Status |
| Latest Max Buy Price |
ARST
-
|
$22.93
|
-1.81
|
569,223
118% DAV
483,600
|
12/22/2009
(Date
Featured) |
$25.94
(Price
Featured) |
PP = $27.20 |
G |
| MB = $28.56 |
Most Recent Note - 2/4/2010 5:00:44 PM
G - Gapped down today, trading near its December lows and sinking toward its 200 DMA line. It would need to rebound above its 50 DMA line for its outlook to improve. ARST was first featured in yellow at $19.91 in the 9/01/09 mid-day report with an annotated daily graph (read here).
>>> The latest Featured Stock Update with an annotated graph appeared on 2/4/2010. click here.
|
|
C
A
S
I |
News |
Chart |
SEC
View all notes Alert
me of new notes
Company
Profile
|
BIDU
- NASDAQ
Baidu Inc Ads
INTERNET - Internet Information Providers
|
$440.86
|
-8.92
|
1,541,287
85% DAV
1,816,900
|
1/13/2010
(Date
Featured) |
$431.25
(Price
Featured) |
PP = $426.75 |
G |
| MB = $448.09 |
Most Recent Note - 2/4/2010 5:01:49 PM
G - Closed lower on below average volume. Still trading above its 50 DMA line and its prior chart highs.
>>> The latest Featured Stock Update with an annotated graph appeared on 2/3/2010. click here.
|
|
C
A
S
I |
News |
Chart |
SEC
View all notes Alert
me of new notes
Company
Profile
|
CACC
- NASDAQ
Credit Acceptance Corp
FINANCIAL SERVICES - Credit Services
|
$44.00
|
-1.49
|
103,622
183% DAV
56,500
|
9/29/2009
(Date
Featured) |
$33.48
(Price
Featured) |
PP = $37.10 |
G |
| MB = $38.96 |
Most Recent Note - 2/4/2010 5:02:49 PM
G - Down for its 4th consecutive loss on above average volume, a sign of more damaging distribution. Recently noted as "Extended from any sound base", the high-ranked Financial firm remains well above its 50 DMA line. On 1/25/10 the company announced the pricing of $250 Million Senior Secured Notes.
>>> The latest Featured Stock Update with an annotated graph appeared on 1/28/2010. click here.
|
|
C
A
S
I |
News |
Chart |
SEC
View all notes Alert
me of new notes
Company
Profile
|
CRM
- NYSE
Salesforce.com Inc
INTERNET - Internet Software & Services
|
$62.43
|
-3.19
|
2,949,298
166% DAV
1,775,400
|
12/18/2009
(Date
Featured) |
$67.32
(Price
Featured) |
PP = $67.82 |
G |
| MB = $71.21 |
Most Recent Note - 2/4/2010 5:03:39 PM
G - Gapped down today and closed below its recent chart lows in the $63 area. It would need to rebound above its 50 DMA line for its outlook to improve.
>>> The latest Featured Stock Update with an annotated graph appeared on 1/27/2010. click here.
|
|
C
A
S
I |
News |
Chart |
SEC
View all notes Alert
me of new notes
Company
Profile
|
GMCR
- NASDAQ
Green Mtn Coffee Roastrs
FOOD & BEVERAGE - Processed & Packaged Goods
|
$82.68
|
-3.07
|
751,962
49% DAV
1,524,300
|
12/28/2009
(Date
Featured) |
$77.49
(Price
Featured) |
PP = $76.50 |
G |
| MB = $80.33 |
Most Recent Note - 2/4/2010 5:04:31 PM
G - Holding its ground stubbornly as it remains perched near its all-time highs. Recent chart lows in the $78 area are an important support level to watch now.
>>> The latest Featured Stock Update with an annotated graph appeared on 2/2/2010. click here.
|
|
C
A
S
I |
News |
Chart |
SEC
View all notes Alert
me of new notes
Company
Profile
|
ISRG
- NASDAQ
Intuitive Surgical Inc
HEALTH SERVICES - Medical Appliances & Equipment
|
$321.20
|
-11.04
|
567,159
111% DAV
510,800
|
1/22/2010
(Date
Featured) |
$340.40
(Price
Featured) |
PP = $314.00 |
G |
| MB = $329.70 |
Most Recent Note - 2/4/2010 5:05:29 PM
G - Loss today on average volume. Trading below its "max buy" level. ISRG was featured again most recently in the 1/22/10 mid-day report (read here), returning after some time off the Featured Stocks list. Its annual earnings history (the A criteria) has been very impressive. ISRG has rebounded impressively from its March low ($84.86) and may be on course for its all-time high ($359 in 2007). Notes outlined technical deterioration before and when it was last dropped from the Featured Stocks list on 6/10/08. ISRG traded up more than 13-fold since first featured in yellow in CANSLIM.net reports in the summer of 2004.
>>> The latest Featured Stock Update with an annotated graph appeared on 1/22/2010. click here.
|
|
C
A
S
I |
News |
Chart |
SEC
View all notes Alert
me of new notes
Company
Profile
|
PEGA
- NASDAQ
Pegasystems Inc
COMPUTER SOFTWARE & SERVICES - Business Software & Services
|
$35.58
|
-0.77
|
288,293
156% DAV
184,500
|
1/4/2010
(Date
Featured) |
$34.00
(Price
Featured) |
PP = $36.19 |
G |
| MB = $38.00 |
Most Recent Note - 2/4/2010 5:06:13 PM
G - Gapped down on above average volume as it trades near its prior chart highs. Wider than usual intra-day price swings in recent days were noted as a sign of uncertainty. Found support at its 50 DMA line after 2 big losses completely negated its 1/27/10 breakout. Its recent chart lows near $32.50 help define important technical support, where violations would trigger more worrisome sell signals. Negative market conditions (M criteria) are currently an overriding concern prompting great caution, since a follow-through day is still needed to confirm a new rally. After a hiatus from the Featured Stocks list, PEGA was featured again in the January 2010 issue of CANSLIM.net News (read here).
>>> The latest Featured Stock Update with an annotated graph appeared on 1/25/2010. click here.
|
|
C
A
S
I |
News |
Chart |
SEC
View all notes Alert
me of new notes
Company
Profile
|
|
|
|
THESE ARE NOT BUY RECOMMENDATIONS!
Comments contained in the body of this report are technical
opinions only. The material herein has been obtained
from sources believed to be reliable and accurate, however,
its accuracy and completeness cannot be guaranteed.
This site is not an investment advisor, hence it does
not endorse or recommend any securities or other investments.
Any recommendation contained in this report may not
be suitable for all investors and it is not to be deemed
an offer or solicitation on our part with respect to
the purchase or sale of any securities. All trademarks,
service marks and trade names appearing in this report
are the property of their respective owners, and are
likewise used for identification purposes only.
This report is a service available
only to active Paid Premium Members.
You may opt-out of receiving report notifications
at any time. Questions or comments may be submitted
by writing to Premium Membership Services 665 S.E. 10 Street, Suite 201 Deerfield Beach, FL 33441-5634 or by calling 1-800-965-8307
or 954-785-1121.
|
|
|


