***Last / Change / Volume data in this table is the closing quote data***
Symbol/Exchange
Company Name
Industry Group |
PRICE |
CHANGE
(%Change) |
Day High |
Volume
(% DAV)
(% 50 day avg vol) |
52 Wk Hi
% From Hi |
Featured
Date |
Price
Featured |
Pivot Featured |
|
Max Buy |
BIDU
-
NASDAQ
Baidu Inc Ads
INTERNET - Internet Information Providers
|
$118.50
|
+0.48
0.41% |
$118.85
|
6,384,227
81.91% of 50 DAV
50 DAV is 7,793,800
|
$119.21
-0.60%
|
2/1/2011
|
$117.74
|
PP = $112.08
|
|
MB = $117.68
|
Most Recent Note - 2/1/2011 12:58:52 PM
Y - Gapped up today, rising from a "double bottom" base pattern. Color code is changed to yellow with pivot point cited based upon its 12/07/10 high. It rebounded above its 50 DMA line in recent weeks. It stayed well above its 200 DMA line in the interim since it was dropped from the Featured Stocks list on 12/27/10.
>>> The latest Featured Stock Update with an annotated graph appeared on 2/2/2011. Click here.
View all notes |
Alert me of new notes |
CANSLIM.net Company Profile |
SEC |
Zacks Reports |
StockTalk |
News |
Chart |
Request a new note
C
A N
S L
I M


|
CRUS
-
NASDAQ
Cirrus Logic Inc
ELECTRONICS - Semiconductor - Specialized
|
$23.61
|
+1.11
4.92% |
$23.82
|
8,690,300
254.43% of 50 DAV
50 DAV is 3,415,600
|
$22.74
3.83%
|
1/28/2011
|
$20.69
|
PP = $19.17
|
|
MB = $20.13
|
 Most Recent Note - 2/3/2011 12:40:05 PM
G - Getting extended from a sound base with a spurt of volume-driven gains. Disciplined investors do not chase extended stocks that are up more than +5% above a proper pivot point.
>>> The latest Featured Stock Update with an annotated graph appeared on 1/28/2011. Click here.
View all notes |
Alert me of new notes |
CANSLIM.net Company Profile |
SEC |
Zacks Reports |
StockTalk |
News |
Chart |
Request a new note
C
A N
S L
I M
|
DECK
-
NASDAQ
Deckers Outdoor Corp
CONSUMER NON-DURABLES - Textile - Apparel Footwear
|
$79.61
|
+3.07
4.00% |
$79.91
|
1,458,863
76.45% of 50 DAV
50 DAV is 1,908,200
|
$87.88
-9.41%
|
2/3/2011
|
$79.61
|
PP = $82.67
|
|
MB = $86.80
|
Most Recent Note - 2/3/2011 5:28:17 PM
Y - Rallied today with better (but still below average) volume for a close above its 50 DMA line, helping its outlook improve. Color code is changed to yellow with new pivot point cited based on its 1/11/11 high while forming a double bottom base pattern.
>>> The latest Featured Stock Update with an annotated graph appeared on 1/26/2011. Click here.
View all notes |
Alert me of new notes |
CANSLIM.net Company Profile |
SEC |
Zacks Reports |
StockTalk |
News |
Chart |
Request a new note
C
A N
S L
I M
|
EZCH
-
NASDAQ
Ezchip Semiconductor Ltd
ELECTRONICS - Semiconductor - Specialized
|
$30.78
|
+0.22
0.72% |
$30.98
|
194,995
65.19% of 50 DAV
50 DAV is 299,100
|
$33.20
-7.29%
|
12/2/2010
|
$27.53
|
PP = $26.00
|
|
MB = $27.30
|
Most Recent Note - 2/1/2011 11:26:52 AM
G - Up today while still consolidating above its 50 DMA line and prior chart highs in the $29 area which now coincide defining important support to watch.
>>> The latest Featured Stock Update with an annotated graph appeared on 1/21/2011. Click here.
View all notes |
Alert me of new notes |
CANSLIM.net Company Profile |
SEC |
Zacks Reports |
StockTalk |
News |
Chart |
Request a new note
C
A N
S L
I M
|
EZPW
-
NASDAQ
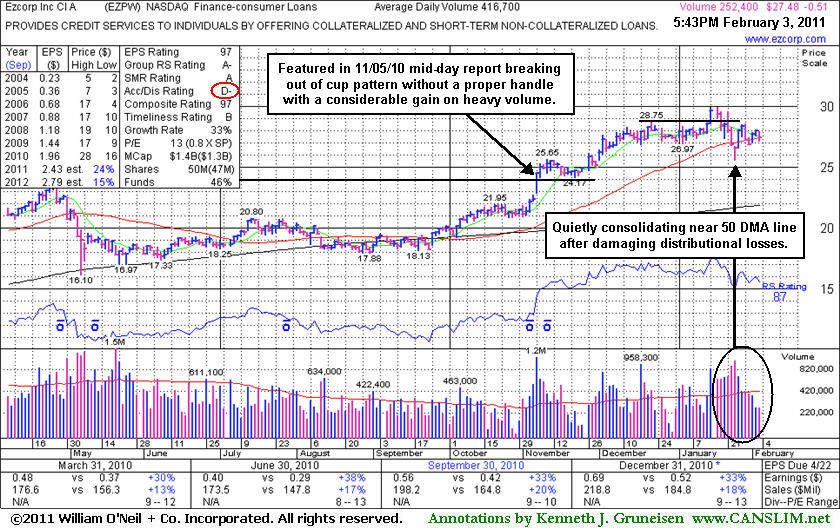
Ezcorp Inc Cl A
SPECIALTY RETAIL - Specialty Retail, Other
|
$27.48
|
-0.52
-1.84% |
$27.98
|
261,620
63.06% of 50 DAV
50 DAV is 414,900
|
$29.94
-8.23%
|
11/5/2010
|
$24.02
|
PP = $23.85
|
|
MB = $25.04
|
Most Recent Note - 2/3/2011 6:52:02 PM
G - Quietly consolidating near its 50 DMA line, showing resilience after damaging distribution. It is not near any sound base, and its recent low ($25.56 on 1/25/11) defines an important support level now. See the latest FSU analysis for more details and an annotated graph.
>>> The latest Featured Stock Update with an annotated graph appeared on 2/3/2011. Click here.
View all notes |
Alert me of new notes |
CANSLIM.net Company Profile |
SEC |
Zacks Reports |
StockTalk |
News |
Chart |
Request a new note
C
A N
S L
I M
|
Symbol/Exchange
Company Name
Industry Group |
PRICE |
CHANGE
(%Change) |
Day High |
Volume
(% DAV)
(% 50 day avg vol) |
52 Wk Hi
% From Hi |
Featured
Date |
Price
Featured |
Pivot Featured |
|
Max Buy |
FOSL
-
NASDAQ
Fossil Inc
CONSUMER DURABLES - Recreational Goods, Other
|
$74.15
|
+1.33
1.83% |
$74.75
|
632,837
88.11% of 50 DAV
50 DAV is 718,200
|
$74.34
-0.26%
|
2/1/2011
|
$73.30
|
PP = $74.44
|
|
MB = $78.16
|
Most Recent Note - 2/3/2011 5:36:40 PM
Y - Hit a new 52-week high today with a gain on light volume, inching up from an orderly 8-week flat base. Color code was changed to yellow with new pivot point cited, however it may be considered a riskier "late-stage" base. Gains above its pivot with great volume conviction could confirm a new (or add-on) technical buy signal. Recent chart low ($66.05 on 1/25/11) defines important support
>>> The latest Featured Stock Update with an annotated graph appeared on 1/12/2011. Click here.
View all notes |
Alert me of new notes |
CANSLIM.net Company Profile |
SEC |
Zacks Reports |
StockTalk |
News |
Chart |
Request a new note
C
A N
S L
I M
|
HMSY
-
NASDAQ
H M S Holdings Corp
COMPUTER SOFTWARE and SERVICES - Healthcare Information Service
|
$65.65
|
+0.28
0.43% |
$66.14
|
69,420
47.78% of 50 DAV
50 DAV is 145,300
|
$67.42
-2.63%
|
11/19/2010
|
$61.89
|
PP = $63.01
|
|
MB = $66.16
|
Most Recent Note - 2/1/2011 4:38:31 PM
G - Today's gain with light volume helped it close back above its 50 DMA line and finish the session only -3.3% off its 52-week high. It is building a base-on-base type pattern, but its waning Relative Strength rank (now 70) has been noted as a concern.
>>> The latest Featured Stock Update with an annotated graph appeared on 1/3/2011. Click here.
View all notes |
Alert me of new notes |
CANSLIM.net Company Profile |
SEC |
Zacks Reports |
StockTalk |
News |
Chart |
Request a new note
C
A N
S L
I M
|
JOBS
-
NASDAQ
Fifty One Job Inc Ads
DIVERSIFIED SERVICES - Staffing and; Outsourcing Service
|
$57.74
|
+0.36
0.63% |
$57.83
|
43,876
30.83% of 50 DAV
50 DAV is 142,300
|
$61.28
-5.78%
|
10/13/2010
|
$42.07
|
PP = $40.60
|
|
MB = $42.63
|
Most Recent Note - 2/1/2011 10:54:01 AM
G - Rallying this week up from its 50 DMA line that defines important support. More damaging losses would raise concerns and trigger a technical sell signal.
>>> The latest Featured Stock Update with an annotated graph appeared on 12/30/2010. Click here.
View all notes |
Alert me of new notes |
CANSLIM.net Company Profile |
SEC |
Zacks Reports |
StockTalk |
News |
Chart |
Request a new note
C
A N
S L
I M
|
LULU
-
NASDAQ
Lululemon Athletica
MANUFACTURING - Textile Manufacturing
|
$72.01
|
+0.10
0.14% |
$74.00
|
1,909,255
91.11% of 50 DAV
50 DAV is 2,095,600
|
$74.60
-3.47%
|
1/26/2011
|
$68.11
|
PP = $74.70
|
|
MB = $78.44
|
Most Recent Note - 2/1/2011 10:56:34 AM
Y - Rallying toward its 52-week high today with an increase in volume. Subsequent gains to new highs with at least +50% above average volume may trigger a new (or add-on) technical buy signal, meanwhile any breach of its recent low ($65.30) or its 50 DMA line may trigger a more worrisome sell signal.
>>> The latest Featured Stock Update with an annotated graph appeared on 1/14/2011. Click here.
View all notes |
Alert me of new notes |
CANSLIM.net Company Profile |
SEC |
Zacks Reports |
StockTalk |
News |
Chart |
Request a new note
C
A N
S L
I M
|
MWIV
-
NASDAQ
M W I Veterinary Supply
HEALTH SERVICES - Medical Instruments and; Supplies
|
$64.36
|
+1.71
2.73% |
$66.41
|
149,757
264.12% of 50 DAV
50 DAV is 56,700
|
$67.13
-4.13%
|
11/4/2010
|
$61.79
|
PP = $59.60
|
|
MB = $62.58
|
Most Recent Note - 2/3/2011 1:23:55 PM
G - It is churning above average volume after a gap up today. Reported earnings +38% on +55% sales revenues for the quarter ended December 31, 2010. Consolidating within close striking range of its all-time high and perched above support at its nearby 50 DMA line. Sales revenues acceleration (bigger percentage increases sequentially) is a very reassuring sign. See the latest FSU analysis for details and an annotated graph.
>>> The latest Featured Stock Update with an annotated graph appeared on 2/2/2011. Click here.
View all notes |
Alert me of new notes |
CANSLIM.net Company Profile |
SEC |
Zacks Reports |
StockTalk |
News |
Chart |
Request a new note
C
A N
S L
I M
|
Symbol/Exchange
Company Name
Industry Group |
PRICE |
CHANGE
(%Change) |
Day High |
Volume
(% DAV)
(% 50 day avg vol) |
52 Wk Hi
% From Hi |
Featured
Date |
Price
Featured |
Pivot Featured |
|
Max Buy |
NFLX
-
NASDAQ
Netflix Inc
SPECIALTY RETAIL - Music and Video Stores
|
$211.49
|
+0.23
0.11% |
$213.32
|
3,035,491
50.43% of 50 DAV
50 DAV is 6,018,900
|
$218.00
-2.99%
|
1/10/2011
|
$187.88
|
PP = $209.34
|
|
MB = $219.81
|
Most Recent Note - 2/1/2011 4:41:57 PM
Y - Volume totals have cooled this week while stubbornly holding its ground following 2 consecutive volume-driven gains for new highs. A considerable gap up gain on 1/27/11 followed a strong quarterly earnings report and confirmed a technical buy signal.
>>> The latest Featured Stock Update with an annotated graph appeared on 1/10/2011. Click here.
View all notes |
Alert me of new notes |
CANSLIM.net Company Profile |
SEC |
Zacks Reports |
StockTalk |
News |
Chart |
Request a new note
C
A N
S L
I M
|
NTAP
-
NASDAQ
Netapp Inc
COMPUTER HARDWARE - Data Storage Devices
|
$57.01
|
-0.10
-0.18% |
$57.61
|
2,426,810
51.18% of 50 DAV
50 DAV is 4,741,300
|
$59.79
-4.65%
|
1/6/2011
|
$57.49
|
PP = $58.06
|
|
MB = $60.96
|
Most Recent Note - 2/1/2011 11:17:58 AM
G - Quiet gains this week have it trading up just above its 50 DMA line. More damaging losses below its recent chart low ($53.14 on 1/25/11) could raise greater concerns and trigger a more serious technical sell signal.
>>> The latest Featured Stock Update with an annotated graph appeared on 12/27/2010. Click here.
View all notes |
Alert me of new notes |
CANSLIM.net Company Profile |
SEC |
Zacks Reports |
StockTalk |
News |
Chart |
Request a new note
C
A N
S L
I M
|
OPEN
-
NASDAQ
Opentable Inc
INTERNET - Internet Software and Services
|
$83.76
|
+2.45
3.01% |
$83.76
|
627,351
79.42% of 50 DAV
50 DAV is 789,900
|
$83.47
0.35%
|
1/5/2011
|
$74.05
|
PP = $76.79
|
|
MB = $80.63
|
Most Recent Note - 2/3/2011 5:33:47 PM
G - Gain today with lighter than average volume led to a close well above its "max buy" level as it hit a new all-time high and closed strong (just 2 cents off the session high). Color code is changed to green because it is now extended from its prior base. Recent lows and its 50 DMA line define near-term chart support.
>>> The latest Featured Stock Update with an annotated graph appeared on 1/5/2011. Click here.
View all notes |
Alert me of new notes |
CANSLIM.net Company Profile |
SEC |
Zacks Reports |
StockTalk |
News |
Chart |
Request a new note
C
A N
S L
I M
|
ORCL
-
NASDAQ
Oracle Corp
COMPUTER SOFTWARE and SERVICES - Application Software
|
$32.99
|
-0.15
-0.46% |
$33.16
|
17,600,887
62.18% of 50 DAV
50 DAV is 28,308,500
|
$33.56
-1.70%
|
1/20/2011
|
$32.31
|
PP = $32.37
|
|
MB = $33.99
|
Most Recent Note - 2/1/2011 4:54:38 PM
Y - Rallied back above its latest pivot point and hit a new 52-week high today with above average volume behind its gain. Recent chart low $30.80 defines near-term support above its 50 DMA line.
>>> The latest Featured Stock Update with an annotated graph appeared on 1/7/2011. Click here.
View all notes |
Alert me of new notes |
CANSLIM.net Company Profile |
SEC |
Zacks Reports |
StockTalk |
News |
Chart |
Request a new note
C
A N
S L
I M
|
PAY
-
NYSE
Verifone Systems Inc
COMPUTER HARDWARE - Transaction Automation Systems
|
$42.38
|
+0.47
1.12% |
$42.41
|
766,381
49.44% of 50 DAV
50 DAV is 1,550,200
|
$44.87
-5.55%
|
1/27/2011
|
$41.77
|
PP = $44.00
|
|
MB = $46.20
|
Most Recent Note - 2/3/2011 5:39:11 PM
Y - Today it posted a 3rd consecutive small gain on light volume, inching up from support at its 50 DMA line. Color code was changed to yellow when a new pivot point was recently cited based on its 52-week high plus ten cents. Subsequent gains with heavy volume may trigger a new (or add-on) technical buy signal.
>>> The latest Featured Stock Update with an annotated graph appeared on 1/27/2011. Click here.
View all notes |
Alert me of new notes |
CANSLIM.net Company Profile |
SEC |
Zacks Reports |
StockTalk |
News |
Chart |
Request a new note
C
A N
S L
I M
|
Symbol/Exchange
Company Name
Industry Group |
PRICE |
CHANGE
(%Change) |
Day High |
Volume
(% DAV)
(% 50 day avg vol) |
52 Wk Hi
% From Hi |
Featured
Date |
Price
Featured |
Pivot Featured |
|
Max Buy |
PCLN
-
NASDAQ
Priceline.Com Inc
INTERNET - Internet Software and Services
|
$435.99
|
-1.20
-0.27% |
$441.00
|
778,272
82.94% of 50 DAV
50 DAV is 938,300
|
$444.95
-2.01%
|
11/1/2002
|
$399.55
|
PP = $428.20
|
|
MB = $449.61
|
Most Recent Note - 2/1/2011 4:58:18 PM
Y - Today it touched a new 52-week high while consolidating above its 50 DMA line and above its pivot point. Its 50 DMA line defines important support to watch.
>>> The latest Featured Stock Update with an annotated graph appeared on 1/2/2011. Click here.
View all notes |
Alert me of new notes |
CANSLIM.net Company Profile |
SEC |
Zacks Reports |
StockTalk |
News |
Chart |
Request a new note
C
A N
S L
I M
|
RAX
-
NYSE
Rackspace Hosting Inc
INTERNET - Internet Software and; Services
|
$35.06
|
-0.62
-1.74% |
$35.82
|
1,594,285
94.10% of 50 DAV
50 DAV is 1,694,200
|
$36.53
-4.02%
|
1/10/2011
|
$22.84
|
PP = $32.76
|
|
MB = $34.40
|
Most Recent Note - 2/2/2011 1:26:28 PM
G - Up on higher volume today for a new all-time high. Found prompt support near its 50 DMA line recently after a 1/20/11 gap down completely negated its 1/11/11 technical breakout. Its recent low ($29.52 on 1/20/10) now defines important support to watch where subsequent violations would raise more serious concerns.
>>> The latest Featured Stock Update with an annotated graph appeared on 12/31/2010. Click here.
View all notes |
Alert me of new notes |
CANSLIM.net Company Profile |
SEC |
Zacks Reports |
StockTalk |
News |
Chart |
Request a new note
C
A N
S L
I M
|
ROVI
-
NASDAQ
Rovi Corp
COMPUTER SOFTWARE andamp; SERVICES - Security Software andamp; Services
|
$62.95
|
-1.01
-1.58% |
$64.41
|
979,041
59.26% of 50 DAV
50 DAV is 1,652,000
|
$69.50
-9.42%
|
10/29/2010
|
$49.99
|
PP = $53.10
|
|
MB = $55.76
|
Most Recent Note - 2/2/2011 4:48:18 PM
G - Closed near the session high with a 3rd consecutive gain today on lighter volume. Recently found support near its 50 DMA line after a couple of distribution days. The 1/10/11 low ($58.51) defines another near-term chart support level to watch.
>>> The latest Featured Stock Update with an annotated graph appeared on 1/25/2011. Click here.
View all notes |
Alert me of new notes |
CANSLIM.net Company Profile |
SEC |
Zacks Reports |
StockTalk |
News |
Chart |
Request a new note
C
A N
S L
I M
|
TIBX
-
NASDAQ
Tibco Software Inc
COMPUTER SOFTWARE and SERVICES - Business Software and Services
|
$24.07
|
+0.27
1.13% |
$24.16
|
2,118,361
78.34% of 50 DAV
50 DAV is 2,704,000
|
$24.41
-1.39%
|
2/1/2011
|
$24.35
|
PP = $22.18
|
|
MB = $23.29
|
Most Recent Note - 2/1/2011 2:08:15 PM
Y - Spiked to a new 52-week high today with heavy volume behind its considerable gain while rising from an orderly flat base. Color code is changed to yellow but it has quickly gotten extended from what may be considered a "late-stage" or riskier base. Previously noted its streak of 4 quarterly comparisons with +25% earnings (good C criteria) increases with good sales revenues growth. It also has a good annual earnings (A criteria) history, and leadership (L criteria) in the Computer Software - Database group is reassuring.
>>> The latest Featured Stock Update with an annotated graph appeared on 2/2/2011. Click here.
View all notes |
Alert me of new notes |
CANSLIM.net Company Profile |
SEC |
Zacks Reports |
StockTalk |
News |
Chart |
Request a new note
C
A N
S L
I M
|
UA
-
NYSE
Under Armour Inc Cl A
CONSUMER NON-DURABLES - Textile - Apparel Clothing
|
$60.26
|
+0.85
1.43% |
$60.82
|
797,267
106.92% of 50 DAV
50 DAV is 745,700
|
$60.98
-1.18%
|
1/27/2011
|
$58.31
|
PP = $56.99
|
|
MB = $59.84
|
Most Recent Note - 2/1/2011 4:32:46 PM
G - Small gain today with above average volume. It closed the session above its "max buy" level, and its color code is changed to green. As previously noted - "It may encounter resistance at its 52-week high, and it remains well off its 2007 all-time high ($73.40)."
>>> The latest Featured Stock Update with an annotated graph appeared on 2/1/2011. Click here.
View all notes |
Alert me of new notes |
CANSLIM.net Company Profile |
SEC |
Zacks Reports |
StockTalk |
News |
Chart |
Request a new note
C
A N
S L
I M
|
Symbol/Exchange
Company Name
Industry Group |
PRICE |
CHANGE
(%Change) |
Day High |
Volume
(% DAV)
(% 50 day avg vol) |
52 Wk Hi
% From Hi |
Featured
Date |
Price
Featured |
Pivot Featured |
|
Max Buy |
ULTA
-
NASDAQ
Ulta Salon Cosm & Frag
SPECIALTY RETAIL - Specialty Retail, Other
|
$38.95
|
+2.04
5.53% |
$39.76
|
1,102,788
179.90% of 50 DAV
50 DAV is 613,000
|
$38.76
0.49%
|
1/6/2011
|
$36.12
|
PP = $37.34
|
|
MB = $39.21
|
Most Recent Note - 2/3/2011 12:13:29 PM
Y - Hitting a new 52-week high today with inspiration from a competitor's encouraging report, trading near its "max buy" level, yet volume conviction behind its rise this week has not been strong. As previously noted - "Subsequent volume-driven gains above its pivot point would be a very reassuring sign. Its 50 DMA line defines important chart support to watch."
>>> The latest Featured Stock Update with an annotated graph appeared on 1/6/2011. Click here.
View all notes |
Alert me of new notes |
CANSLIM.net Company Profile |
SEC |
Zacks Reports |
StockTalk |
News |
Chart |
Request a new note
C
A N
S L
I M
|