You are not logged in.
This means you
CAN ONLY VIEW reports that were published prior to Monday, April 14, 2025.
You
MUST UPGRADE YOUR MEMBERSHIP if you want to see any current reports.
AFTER MARKET UPDATE - WEDNESDAY, FEBRUARY 2ND, 2011
Previous After Market Report Next After Market Report >>>
|
|
|
|
DOW |
+1.81 |
12,041.97 |
+0.02% |
|
Volume |
935,966,080 |
-14% |
|
Volume |
1,972,712,550 |
-12% |
|
NASDAQ |
-1.63 |
2,749.56 |
-0.06% |
|
Advancers |
1,385 |
45% |
|
Advancers |
1,158 |
42% |
|
S&P 500 |
-3.56 |
1,304.03 |
-0.27% |
|
Decliners |
1,598 |
51% |
|
Decliners |
1,480 |
54% |
|
Russell 2000 |
-2.73 |
796.16 |
-0.34% |
|
52 Wk Highs |
260 |
|
|
52 Wk Highs |
165 |
|
|
S&P 600 |
-1.84 |
422.73 |
-0.43% |
|
52 Wk Lows |
8 |
|
|
52 Wk Lows |
17 |
|
|
 |
Major Averages Hold Ground Near Recovery Highs
Kenneth J. Gruneisen - Passed the CAN SLIM® Master's Exam
The major averages ended mixed and little changed on Wednesday, pausing after getting off to a strong start for February. Declining issues beat advancers by 8-7 on the NYSE and by 6-5 on the Nasdaq. NYSE volume was limited by winter weather in the Northeast and Midwest and the volume totals were reported lighter on the Nasdaq and on the NYSE versus the prior session totals. New 52-week highs outnumbered new 52-week lows on the NYSE and on the Nasdaq exchange. The total number of new lows on the NYSE was in the single digits again. There was a total of 83 high-ranked companies from the CANSLIM.net Leaders List that made new 52-week highs and appeared on the CANSLIM.net BreakOuts Page, down from the total of 100 on the prior session. On the Featured Stocks Page there were gains from 10 out of 21 high-ranked market leaders.
The indices traded in very narrow ranges as investors kept a cautious eye on Egypt, where clashes appeared to become more violent. The news on U.S. employment was good. ADP's monthly survey estimated private payrolls expanded by 187,000 in January, more than analysts expected. And a private placement firm said employers announced the fewest number of job cuts for any January since records began in 1993.
Electronic Arts Inc (ERTS +15.4%) and Time Warner Cable Inc (TWX +8.6%) advanced after both reported profits that topped analysts' estimates. Unisys Corp (UIS +19%) spiked higher after sales at the computer services company exceeded forecasts. Whirlpool Corp's (WHR -2.1%) profit missed estimates and it said it will raise prices because of higher costs for raw materials.
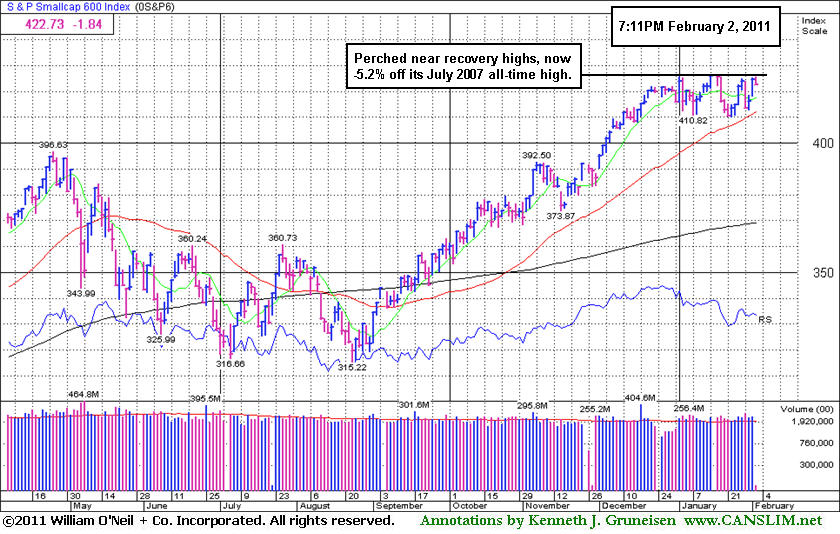
After the first positive January in four years, the stock market is off to the races in February while a strong rally remains in progress on Wall Street. This week the Dow Jones Industrial Average, S&P 500 Index, and the Mid-Cap S&P 400 Index collectively hit new recovery highs. Be ready to check out the soon-to-be published February 2011 issue of CANSLIM.net News for a comprehensive overview of current market conditions, leading groups, and the most recent featured stocks.
PICTURED: The S&P Small-Cap 600 Index is perched near recovery highs, now only -5.2% off its July 2007 all-time high.
|
 Kenneth J. Gruneisen started out as a licensed stockbroker in August 1987, a couple of months prior to the historic stock market crash that took the Dow Jones Industrial Average down -22.6% in a single day. He has published daily fact-based fundamental and technical analysis on high-ranked stocks online for two decades. Through FACTBASEDINVESTING.COM, Kenneth provides educational articles, news, market commentary, and other information regarding proven investment systems that work in good times and bad.
Comments contained in the body of this report are technical opinions only and are not necessarily those of Gruneisen Growth Corp. The material herein has been obtained from sources believed to be reliable and accurate, however, its accuracy and completeness cannot be guaranteed. Our firm, employees, and customers may effect transactions, including transactions contrary to any recommendation herein, or have positions in the securities mentioned herein or options with respect thereto. Any recommendation contained in this report may not be suitable for all investors and it is not to be deemed an offer or solicitation on our part with respect to the purchase or sale of any securities. |
|
 |
Tech Sector Shows Positive Bias
Kenneth J. Gruneisen - Passed the CAN SLIM® Master's Exam
The Retail Index ($RLX -1.27%) was a laggard and modest losses from the Bank Index ($BKX -0.72%) and Broker/Dealer Index ($XBD -0.34%) were a negative influence on the major averages on Wednesday. Defensive groups also had a negative bias as the Gold & Silver Index ($XAU -1.09%) and Healthcare Index ($HMO -0.69%) ended lower. Energy-related shares were mixed as the Integrated Oil Index ($XOI -0.18%) and Oil Services Index ($OSX +0.35%) showed no decisive direction. The tech sector has positive bias while the Biotechnology Index ($BTK +0.11%), Internet Index ($IIX +0.30%), and Semiconductor Index ($SOX +0.46%) posted small gains.
Charts courtesy www.stockcharts.com
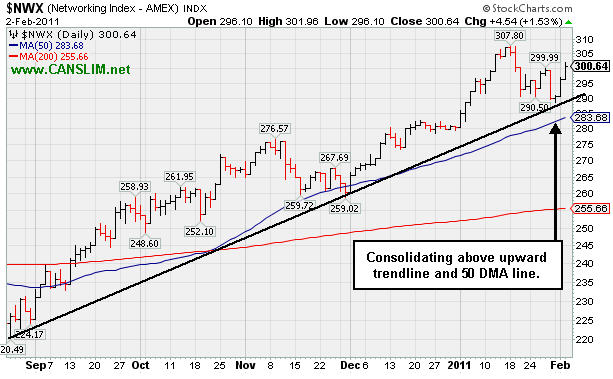
PICTURED: The Networking Index ($NWX +1.54%) is consolidating above its upward trendline and 50-day moving average line.
| Oil Services |
$OSX |
269.18 |
+0.94 |
+0.35% |
+9.82% |
| Healthcare |
$HMO |
1,887.29 |
-13.15 |
-0.69% |
+11.54% |
| Integrated Oil |
$XOI |
1,319.25 |
-2.34 |
-0.18% |
+8.75% |
| Semiconductor |
$SOX |
453.91 |
+2.08 |
+0.46% |
+10.22% |
| Networking |
$NWX |
300.64 |
+4.55 |
+1.54% |
+7.16% |
| Internet |
$IIX |
319.08 |
+0.95 |
+0.30% |
+3.69% |
| Broker/Dealer |
$XBD |
125.56 |
-0.43 |
-0.34% |
+3.33% |
| Retail |
$RLX |
495.59 |
-6.37 |
-1.27% |
-2.52% |
| Gold & Silver |
$XAU |
204.04 |
-2.25 |
-1.09% |
-9.95% |
| Bank |
$BKX |
53.98 |
-0.39 |
-0.72% |
+3.39% |
| Biotech |
$BTK |
1,293.27 |
+1.37 |
+0.11% |
-0.34% |
|
|
|
 |
Breakaway Gap After Impressive Acceleration In Latest Quarter
Kenneth J. Gruneisen - Passed the CAN SLIM® Master's Exam
| Baidu Inc. |
CLICK HERE to see the Profile Page for this stock with current details and historic information |
|
Ticker Symbol: BIDU (NASDAQ) |
Industry Group: Internet - Content |
Shares Outstanding: 348,000,000 |
|
Price: $118.73 2/01/2011 |
Day's Volume: 22,003,600 2/01/2011 |
Shares in Float: 212,900,000 |
|
52 Week High: $115.04 11/11/2010 |
50-Day Average Volume: 7,793,800 |
Up/Down Volume Ratio: 1.2 |
|
Pivot Point: $112.08 12/07/2010 high |
Pivot Point +5% = Max Buy Price: $117.68 |
Web Address: http://ir.baidu.com/
|
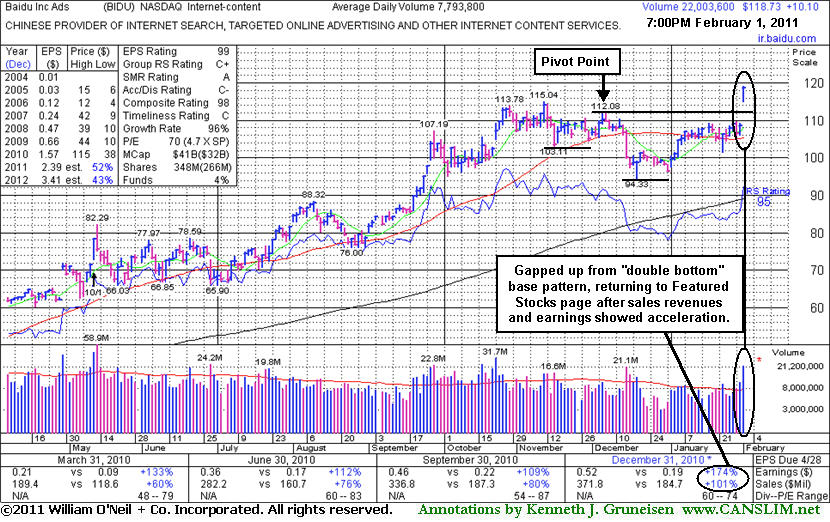
CANSLIM.net Profile: Baidu Inc. is a high-ranked China-based firm in the Internet - Content industry. It has maintained a very strong and steady annual earnings (A criteria) history. Fundamentally, its sales revenues and earnings increases have been impressive in the 4 most recent quarterly comparisons, solidly above the +25% guideline (C criteria), and its latest quarter ended December 31, 2010 continued a streak of sequential comparisons showing impressive acceleration in its sales revenues growth. Return On Equity is reported at 55%, well above the 17% minimum guideline. The number of top-rated funds owning its shares rose from 837 in Mar '10 to to 975 in Dec '10, a reassuring sign concerning the I criteria.
What to Look For and What to Look Out For: Its gain confirmed a proper technical buy signal but it quickly got extended more than +5% above its pivot point. That gives investors a good reason to watch for subsequent light volume pullbacks as an opportunity to accumulate shares without chasing it too far above prior highs. A cooperative backdrop in the major averages (M criteria) in the near-term may continue to work in its favor, but any change in the market environment should be expected to impact 3 out of 4 stocks. Disciplined investors always limit losses if ever any stock falls more than -7% from their purchase price.
Technical Analysis: BIDU's gap up gain on 2/01/11 prompted its appearance in yellow in the mid-day report (read here). That gap up gain may be considered a "breakaway gap" and its strong finish at the session high allowed it to hit and close at a new all-time high. A breakaway gap is the one noted exception where the usual limit can be stretched to allow for disciplined investors to buy as much as +10% above the pivot point ($112.08 X 1.1 = $123.29), however risk obviously increases the further one buys from a proper pivot point. There is no overhead supply to act as resistance, so it could then easily rise unhindered for more climactic gains. However, its supply of shares was drastically increased by a 10:1 stock split on 5/12/10, and usually the market's biggest winners had only 30 million shares (S criteria) outstanding or less. It had last appeared in the Featured Stock Update on 11/30/10 under the headline "Late Stage Leader Now Testing 50-Day Average Support" but when damage continued to mount it was noted and dropped from the Featured Stocks list on 12/27/10. In recent weeks it had rebounded above its 50-day moving average line, helping its outlook improve again. |
|
|
Color Codes Explained :
Y - Better candidates highlighted by our
staff of experts.
G - Previously featured
in past reports as yellow but may no longer be buyable under the
guidelines.
***Last / Change / Volume data in this table is the closing quote data***
Symbol/Exchange
Company Name
Industry Group |
PRICE |
CHANGE
(%Change) |
Day High |
Volume
(% DAV)
(% 50 day avg vol) |
52 Wk Hi
% From Hi |
Featured
Date |
Price
Featured |
Pivot Featured |
|
Max Buy |
BIDU
-
NASDAQ
Baidu Inc Ads
INTERNET - Internet Information Providers
|
$118.02
|
-0.71
-0.60% |
$119.21
|
8,683,312
111.41% of 50 DAV
50 DAV is 7,793,800
|
$119.21
-1.00%
|
2/1/2011
|
$117.74
|
PP = $112.08
|
|
MB = $117.68
|
Most Recent Note - 2/1/2011 12:58:52 PM
Y - Gapped up today, rising from a "double bottom" base pattern. Color code is changed to yellow with pivot point cited based upon its 12/07/10 high. It rebounded above its 50 DMA line in recent weeks. It stayed well above its 200 DMA line in the interim since it was dropped from the Featured Stocks list on 12/27/10.
>>> The latest Featured Stock Update with an annotated graph appeared on 2/2/2011. Click here.
View all notes |
Alert me of new notes |
CANSLIM.net Company Profile |
SEC |
Zacks Reports |
StockTalk |
News |
Chart |
Request a new note
C
A N
S L
I M


|
CRUS
-
NASDAQ
Cirrus Logic Inc
ELECTRONICS - Semiconductor - Specialized
|
$22.50
|
+1.17
5.50% |
$22.74
|
5,224,655
152.96% of 50 DAV
50 DAV is 3,415,600
|
$21.72
3.60%
|
1/28/2011
|
$20.69
|
PP = $19.17
|
|
MB = $20.13
|
 Most Recent Note - 2/2/2011 12:46:09 PM
G - Considerable gain today after a small gap up. Rising since the considerable breakout gain on 1/27/11 helped it technically break out from a bullish reverse-head-and-shoulders type pattern. Disciplined investors do not chase extended stocks that are up more than +5% above a proper pivot point.
>>> The latest Featured Stock Update with an annotated graph appeared on 1/28/2011. Click here.
View all notes |
Alert me of new notes |
CANSLIM.net Company Profile |
SEC |
Zacks Reports |
StockTalk |
News |
Chart |
Request a new note
C
A N
S L
I M
|
DECK
-
NASDAQ
Deckers Outdoor Corp
CONSUMER NON-DURABLES - Textile - Apparel Footwear
|
$76.55
|
+0.58
0.76% |
$76.76
|
955,458
50.07% of 50 DAV
50 DAV is 1,908,200
|
$87.88
-12.90%
|
10/27/2010
|
$54.16
|
PP = $54.86
|
|
MB = $57.60
|
Most Recent Note - 2/1/2011 11:14:25 AM
G - Up today, yet still sputtering below its 50 DMA line. That short-term average may now act as resistance, while subsequent gains above it would help its outlook improve.
>>> The latest Featured Stock Update with an annotated graph appeared on 1/26/2011. Click here.
View all notes |
Alert me of new notes |
CANSLIM.net Company Profile |
SEC |
Zacks Reports |
StockTalk |
News |
Chart |
Request a new note
C
A N
S L
I M
|
EZCH
-
NASDAQ
Ezchip Semiconductor Ltd
ELECTRONICS - Semiconductor - Specialized
|
$30.56
|
+0.28
0.92% |
$31.10
|
338,272
113.10% of 50 DAV
50 DAV is 299,100
|
$33.20
-7.95%
|
12/2/2010
|
$27.53
|
PP = $26.00
|
|
MB = $27.30
|
Most Recent Note - 2/1/2011 11:26:52 AM
G - Up today while still consolidating above its 50 DMA line and prior chart highs in the $29 area which now coincide defining important support to watch.
>>> The latest Featured Stock Update with an annotated graph appeared on 1/21/2011. Click here.
View all notes |
Alert me of new notes |
CANSLIM.net Company Profile |
SEC |
Zacks Reports |
StockTalk |
News |
Chart |
Request a new note
C
A N
S L
I M
|
EZPW
-
NASDAQ
Ezcorp Inc Cl A
SPECIALTY RETAIL - Specialty Retail, Other
|
$27.99
|
+0.26
0.94% |
$28.05
|
257,085
61.96% of 50 DAV
50 DAV is 414,900
|
$29.94
-6.51%
|
11/5/2010
|
$24.02
|
PP = $23.85
|
|
MB = $25.04
|
Most Recent Note - 2/1/2011 3:49:38 PM
G - Quiet volume is behind today's gain while consolidating near its 50 DMA line which recently acted as support. It is not near any sound base, and its recent low ($25.56 on 1/25/11) defines an important support level now.
>>> The latest Featured Stock Update with an annotated graph appeared on 12/29/2010. Click here.
View all notes |
Alert me of new notes |
CANSLIM.net Company Profile |
SEC |
Zacks Reports |
StockTalk |
News |
Chart |
Request a new note
C
A N
S L
I M
|
Symbol/Exchange
Company Name
Industry Group |
PRICE |
CHANGE
(%Change) |
Day High |
Volume
(% DAV)
(% 50 day avg vol) |
52 Wk Hi
% From Hi |
Featured
Date |
Price
Featured |
Pivot Featured |
|
Max Buy |
FOSL
-
NASDAQ
Fossil Inc
CONSUMER DURABLES - Recreational Goods, Other
|
$72.82
|
-0.23
-0.31% |
$73.30
|
279,794
38.96% of 50 DAV
50 DAV is 718,200
|
$74.34
-2.04%
|
2/1/2011
|
$73.30
|
PP = $74.44
|
|
MB = $78.16
|
Most Recent Note - 2/1/2011 3:56:22 PM
Y - Rallying near its 52-week high today after an orderly 8-week flat base. Color code is changed to yellow with new pivot point cited, however it may be considered a riskier "late-stage" base. Gains above its pivot with great volume conviction could confirm a new (or add-on) technical buy signal. Recent chart low ($66.05 on 1/25/11) defines important support
>>> The latest Featured Stock Update with an annotated graph appeared on 1/12/2011. Click here.
View all notes |
Alert me of new notes |
CANSLIM.net Company Profile |
SEC |
Zacks Reports |
StockTalk |
News |
Chart |
Request a new note
C
A N
S L
I M
|
HMSY
-
NASDAQ
H M S Holdings Corp
COMPUTER SOFTWARE and SERVICES - Healthcare Information Service
|
$65.37
|
+0.15
0.23% |
$65.63
|
86,760
59.71% of 50 DAV
50 DAV is 145,300
|
$67.42
-3.04%
|
11/19/2010
|
$61.89
|
PP = $63.01
|
|
MB = $66.16
|
Most Recent Note - 2/1/2011 4:38:31 PM
G - Today's gain with light volume helped it close back above its 50 DMA line and finish the session only -3.3% off its 52-week high. It is building a base-on-base type pattern, but its waning Relative Strength rank (now 70) has been noted as a concern.
>>> The latest Featured Stock Update with an annotated graph appeared on 1/3/2011. Click here.
View all notes |
Alert me of new notes |
CANSLIM.net Company Profile |
SEC |
Zacks Reports |
StockTalk |
News |
Chart |
Request a new note
C
A N
S L
I M
|
JOBS
-
NASDAQ
Fifty One Job Inc Ads
DIVERSIFIED SERVICES - Staffing and; Outsourcing Service
|
$57.38
|
+0.27
0.47% |
$57.45
|
71,680
50.37% of 50 DAV
50 DAV is 142,300
|
$61.28
-6.36%
|
10/13/2010
|
$42.07
|
PP = $40.60
|
|
MB = $42.63
|
Most Recent Note - 2/1/2011 10:54:01 AM
G - Rallying this week up from its 50 DMA line that defines important support. More damaging losses would raise concerns and trigger a technical sell signal.
>>> The latest Featured Stock Update with an annotated graph appeared on 12/30/2010. Click here.
View all notes |
Alert me of new notes |
CANSLIM.net Company Profile |
SEC |
Zacks Reports |
StockTalk |
News |
Chart |
Request a new note
C
A N
S L
I M
|
LULU
-
NASDAQ
Lululemon Athletica
MANUFACTURING - Textile Manufacturing
|
$71.91
|
-1.29
-1.76% |
$73.49
|
1,593,152
76.02% of 50 DAV
50 DAV is 2,095,600
|
$74.60
-3.61%
|
1/26/2011
|
$68.11
|
PP = $74.70
|
|
MB = $78.44
|
Most Recent Note - 2/1/2011 10:56:34 AM
Y - Rallying toward its 52-week high today with an increase in volume. Subsequent gains to new highs with at least +50% above average volume may trigger a new (or add-on) technical buy signal, meanwhile any breach of its recent low ($65.30) or its 50 DMA line may trigger a more worrisome sell signal.
>>> The latest Featured Stock Update with an annotated graph appeared on 1/14/2011. Click here.
View all notes |
Alert me of new notes |
CANSLIM.net Company Profile |
SEC |
Zacks Reports |
StockTalk |
News |
Chart |
Request a new note
C
A N
S L
I M
|
MWIV
-
NASDAQ
M W I Veterinary Supply
HEALTH SERVICES - Medical Instruments and; Supplies
|
$62.65
|
-1.11
-1.74% |
$65.21
|
33,338
58.80% of 50 DAV
50 DAV is 56,700
|
$67.13
-6.67%
|
11/4/2010
|
$61.79
|
PP = $59.60
|
|
MB = $62.58
|
Most Recent Note - 2/2/2011 7:21:42 PM
G - Quietly consolidating near its 50 DMA line today. Earnings news is due before the open on Thursday. See the latest FSU analysis for details and an annotated graph.
>>> The latest Featured Stock Update with an annotated graph appeared on 2/2/2011. Click here.
View all notes |
Alert me of new notes |
CANSLIM.net Company Profile |
SEC |
Zacks Reports |
StockTalk |
News |
Chart |
Request a new note
C
A N
S L
I M
|
Symbol/Exchange
Company Name
Industry Group |
PRICE |
CHANGE
(%Change) |
Day High |
Volume
(% DAV)
(% 50 day avg vol) |
52 Wk Hi
% From Hi |
Featured
Date |
Price
Featured |
Pivot Featured |
|
Max Buy |
NFLX
-
NASDAQ
Netflix Inc
SPECIALTY RETAIL - Music and Video Stores
|
$211.26
|
-1.64
-0.77% |
$213.67
|
4,765,503
79.18% of 50 DAV
50 DAV is 6,018,900
|
$218.00
-3.09%
|
1/10/2011
|
$187.88
|
PP = $209.34
|
|
MB = $219.81
|
Most Recent Note - 2/1/2011 4:41:57 PM
Y - Volume totals have cooled this week while stubbornly holding its ground following 2 consecutive volume-driven gains for new highs. A considerable gap up gain on 1/27/11 followed a strong quarterly earnings report and confirmed a technical buy signal.
>>> The latest Featured Stock Update with an annotated graph appeared on 1/10/2011. Click here.
View all notes |
Alert me of new notes |
CANSLIM.net Company Profile |
SEC |
Zacks Reports |
StockTalk |
News |
Chart |
Request a new note
C
A N
S L
I M
|
NTAP
-
NASDAQ
Netapp Inc
COMPUTER HARDWARE - Data Storage Devices
|
$57.11
|
+0.59
1.04% |
$57.71
|
3,810,031
80.36% of 50 DAV
50 DAV is 4,741,300
|
$59.79
-4.48%
|
1/6/2011
|
$57.49
|
PP = $58.06
|
|
MB = $60.96
|
Most Recent Note - 2/1/2011 11:17:58 AM
G - Quiet gains this week have it trading up just above its 50 DMA line. More damaging losses below its recent chart low ($53.14 on 1/25/11) could raise greater concerns and trigger a more serious technical sell signal.
>>> The latest Featured Stock Update with an annotated graph appeared on 12/27/2010. Click here.
View all notes |
Alert me of new notes |
CANSLIM.net Company Profile |
SEC |
Zacks Reports |
StockTalk |
News |
Chart |
Request a new note
C
A N
S L
I M
|
OPEN
-
NASDAQ
Opentable Inc
INTERNET - Internet Software and Services
|
$81.31
|
-0.31
-0.38% |
$83.47
|
664,462
84.12% of 50 DAV
50 DAV is 789,900
|
$82.70
-1.67%
|
1/5/2011
|
$74.05
|
PP = $76.79
|
|
MB = $80.63
|
Most Recent Note - 2/1/2011 11:20:17 AM
Y - Gains this week with lighter volume have it approaching its "max buy" level and now perched only -2.7% off its all-time high. Recent lows and its 50 DMA line define near-term chart support.
>>> The latest Featured Stock Update with an annotated graph appeared on 1/5/2011. Click here.
View all notes |
Alert me of new notes |
CANSLIM.net Company Profile |
SEC |
Zacks Reports |
StockTalk |
News |
Chart |
Request a new note
C
A N
S L
I M
|
ORCL
-
NASDAQ
Oracle Corp
COMPUTER SOFTWARE and SERVICES - Application Software
|
$33.14
|
-0.10
-0.29% |
$33.56
|
19,358,200
68.38% of 50 DAV
50 DAV is 28,308,500
|
$33.43
-0.86%
|
1/20/2011
|
$32.31
|
PP = $32.37
|
|
MB = $33.99
|
Most Recent Note - 2/1/2011 4:54:38 PM
Y - Rallied back above its latest pivot point and hit a new 52-week high today with above average volume behind its gain. Recent chart low $30.80 defines near-term support above its 50 DMA line.
>>> The latest Featured Stock Update with an annotated graph appeared on 1/7/2011. Click here.
View all notes |
Alert me of new notes |
CANSLIM.net Company Profile |
SEC |
Zacks Reports |
StockTalk |
News |
Chart |
Request a new note
C
A N
S L
I M
|
PAY
-
NYSE
Verifone Systems Inc
COMPUTER HARDWARE - Transaction Automation Systems
|
$41.91
|
+0.61
1.48% |
$42.15
|
827,619
53.39% of 50 DAV
50 DAV is 1,550,200
|
$44.87
-6.60%
|
1/27/2011
|
$41.77
|
PP = $44.00
|
|
MB = $46.20
|
Most Recent Note - 2/1/2011 11:04:50 AM
Y - Rallying up from support at its 50 DMA line, an important near-term chart support level to watch. Color code was changed to yellow when a new pivot point was recently cited based on its 52-week high plus ten cents. Subsequent gains with heavy volume may trigger a new (or add-on) technical buy signal.
>>> The latest Featured Stock Update with an annotated graph appeared on 1/27/2011. Click here.
View all notes |
Alert me of new notes |
CANSLIM.net Company Profile |
SEC |
Zacks Reports |
StockTalk |
News |
Chart |
Request a new note
C
A N
S L
I M
|
Symbol/Exchange
Company Name
Industry Group |
PRICE |
CHANGE
(%Change) |
Day High |
Volume
(% DAV)
(% 50 day avg vol) |
52 Wk Hi
% From Hi |
Featured
Date |
Price
Featured |
Pivot Featured |
|
Max Buy |
PCLN
-
NASDAQ
Priceline.Com Inc
INTERNET - Internet Software and Services
|
$437.19
|
-0.74
-0.17% |
$441.79
|
559,596
59.64% of 50 DAV
50 DAV is 938,300
|
$444.95
-1.74%
|
11/1/2002
|
$399.55
|
PP = $428.20
|
|
MB = $449.61
|
Most Recent Note - 2/1/2011 4:58:18 PM
Y - Today it touched a new 52-week high while consolidating above its 50 DMA line and above its pivot point. Its 50 DMA line defines important support to watch.
>>> The latest Featured Stock Update with an annotated graph appeared on 1/2/2011. Click here.
View all notes |
Alert me of new notes |
CANSLIM.net Company Profile |
SEC |
Zacks Reports |
StockTalk |
News |
Chart |
Request a new note
C
A N
S L
I M
|
RAX
-
NYSE
Rackspace Hosting Inc
INTERNET - Internet Software and; Services
|
$35.68
|
+1.49
4.36% |
$36.53
|
3,009,792
177.65% of 50 DAV
50 DAV is 1,694,200
|
$35.87
-0.53%
|
1/10/2011
|
$22.84
|
PP = $32.76
|
|
MB = $34.40
|
Most Recent Note - 2/2/2011 1:26:28 PM
G - Up on higher volume today for a new all-time high. Found prompt support near its 50 DMA line recently after a 1/20/11 gap down completely negated its 1/11/11 technical breakout. Its recent low ($29.52 on 1/20/10) now defines important support to watch where subsequent violations would raise more serious concerns.
>>> The latest Featured Stock Update with an annotated graph appeared on 12/31/2010. Click here.
View all notes |
Alert me of new notes |
CANSLIM.net Company Profile |
SEC |
Zacks Reports |
StockTalk |
News |
Chart |
Request a new note
C
A N
S L
I M
|
ROVI
-
NASDAQ
Rovi Corp
COMPUTER SOFTWARE andamp; SERVICES - Security Software andamp; Services
|
$63.96
|
+1.28
2.04% |
$64.15
|
1,359,522
82.30% of 50 DAV
50 DAV is 1,652,000
|
$69.50
-7.97%
|
10/29/2010
|
$49.99
|
PP = $53.10
|
|
MB = $55.76
|
Most Recent Note - 2/2/2011 4:48:18 PM
G - Closed near the session high with a 3rd consecutive gain today on lighter volume. Recently found support near its 50 DMA line after a couple of distribution days. The 1/10/11 low ($58.51) defines another near-term chart support level to watch.
>>> The latest Featured Stock Update with an annotated graph appeared on 1/25/2011. Click here.
View all notes |
Alert me of new notes |
CANSLIM.net Company Profile |
SEC |
Zacks Reports |
StockTalk |
News |
Chart |
Request a new note
C
A N
S L
I M
|
TIBX
-
NASDAQ
Tibco Software Inc
COMPUTER SOFTWARE and SERVICES - Business Software and Services
|
$23.80
|
-0.18
-0.75% |
$24.00
|
3,030,414
112.07% of 50 DAV
50 DAV is 2,704,000
|
$24.41
-2.50%
|
2/1/2011
|
$24.35
|
PP = $22.18
|
|
MB = $23.29
|
Most Recent Note - 2/1/2011 2:08:15 PM
Y - Spiked to a new 52-week high today with heavy volume behind its considerable gain while rising from an orderly flat base. Color code is changed to yellow but it has quickly gotten extended from what may be considered a "late-stage" or riskier base. Previously noted its streak of 4 quarterly comparisons with +25% earnings (good C criteria) increases with good sales revenues growth. It also has a good annual earnings (A criteria) history, and leadership (L criteria) in the Computer Software - Database group is reassuring.
>>> The latest Featured Stock Update with an annotated graph appeared on 2/2/2011. Click here.
View all notes |
Alert me of new notes |
CANSLIM.net Company Profile |
SEC |
Zacks Reports |
StockTalk |
News |
Chart |
Request a new note
C
A N
S L
I M
|
UA
-
NYSE
Under Armour Inc Cl A
CONSUMER NON-DURABLES - Textile - Apparel Clothing
|
$59.41
|
-0.77
-1.28% |
$60.68
|
729,699
97.85% of 50 DAV
50 DAV is 745,700
|
$60.98
-2.57%
|
1/27/2011
|
$58.31
|
PP = $56.99
|
|
MB = $59.84
|
Most Recent Note - 2/1/2011 4:32:46 PM
G - Small gain today with above average volume. It closed the session above its "max buy" level, and its color code is changed to green. As previously noted - "It may encounter resistance at its 52-week high, and it remains well off its 2007 all-time high ($73.40)."
>>> The latest Featured Stock Update with an annotated graph appeared on 2/1/2011. Click here.
View all notes |
Alert me of new notes |
CANSLIM.net Company Profile |
SEC |
Zacks Reports |
StockTalk |
News |
Chart |
Request a new note
C
A N
S L
I M
|
Symbol/Exchange
Company Name
Industry Group |
PRICE |
CHANGE
(%Change) |
Day High |
Volume
(% DAV)
(% 50 day avg vol) |
52 Wk Hi
% From Hi |
Featured
Date |
Price
Featured |
Pivot Featured |
|
Max Buy |
ULTA
-
NASDAQ
Ulta Salon Cosm & Frag
SPECIALTY RETAIL - Specialty Retail, Other
|
$36.91
|
-1.03
-2.71% |
$37.98
|
465,990
76.02% of 50 DAV
50 DAV is 613,000
|
$38.76
-4.77%
|
1/6/2011
|
$36.12
|
PP = $37.34
|
|
MB = $39.21
|
Most Recent Note - 2/2/2011 4:45:37 PM
Y - Down today on lighter volume after touching a new 52-week high on the prior session without great volume conviction behind its gain for a best-ever close. As previously noted - "Subsequent volume-driven gains above its pivot point would be a very reassuring sign. Its 50 DMA line defines important chart support to watch."
>>> The latest Featured Stock Update with an annotated graph appeared on 1/6/2011. Click here.
View all notes |
Alert me of new notes |
CANSLIM.net Company Profile |
SEC |
Zacks Reports |
StockTalk |
News |
Chart |
Request a new note
C
A N
S L
I M
|
|
|
|
THESE ARE NOT BUY RECOMMENDATIONS!
Comments contained in the body of this report are technical
opinions only. The material herein has been obtained
from sources believed to be reliable and accurate, however,
its accuracy and completeness cannot be guaranteed.
This site is not an investment advisor, hence it does
not endorse or recommend any securities or other investments.
Any recommendation contained in this report may not
be suitable for all investors and it is not to be deemed
an offer or solicitation on our part with respect to
the purchase or sale of any securities. All trademarks,
service marks and trade names appearing in this report
are the property of their respective owners, and are
likewise used for identification purposes only.
This report is a service available
only to active Paid Premium Members.
You may opt-out of receiving report notifications
at any time. Questions or comments may be submitted
by writing to Premium Membership Services 665 S.E. 10 Street, Suite 201 Deerfield Beach, FL 33441-5634 or by calling 1-800-965-8307
or 954-785-1121.
|
|
|

