You are not logged in.
This means you
CAN ONLY VIEW reports that were published prior to Friday, March 28, 2025.
You
MUST UPGRADE YOUR MEMBERSHIP if you want to see any current reports.
AFTER MARKET UPDATE - TUESDAY, FEBRUARY 2ND, 2010
Previous After Market Report Next After Market Report >>>
|
|
|
|
DOW |
+111.32 |
10,296.85 |
+1.09% |
|
Volume |
1,179,347,340 |
+14% |
|
Volume |
2,555,821,030 |
+13% |
|
NASDAQ |
+18.86 |
2,190.06 |
+0.87% |
|
Advancers |
2,341 |
75% |
|
Advancers |
1,512 |
54% |
|
S&P 500 |
+14.13 |
1,103.32 |
+1.30% |
|
Decliners |
694 |
22% |
|
Decliners |
1,173 |
42% |
|
Russell 2000 |
+4.80 |
614.05 |
+0.79% |
|
52 Wk Highs |
77 |
|
|
52 Wk Highs |
44 |
|
|
S&P 600 |
+2.40 |
326.76 |
+0.74% |
|
52 Wk Lows |
4 |
|
|
52 Wk Lows |
13 |
|
|
 |
Major Averages Post Gains With Better Volume and Positive Breadth
Adam Sarhan, Contributing Writer,
Stocks and commodities rallied on Tuesday as the dollar fell for a second consecutive day after healthy news from the ailing housing front was released and the Australian central bank unexpectedly left interest rates steady. Volume was heavier than the prior session on the NYSE and Nasdaq exchange which signaled large institutions were buying stocks with better conviction. Advancers led decliners by over a 3-to-1 ratio on the NYSE and by a 5-to-4 ratio on the Nasdaq exchange. There were 17 high-ranked companies from the CANSLIM.net Leaders List that made a new 52-week high and appeared on the CANSLIM.net BreakOuts Page, higher than the 7 issues that appeared on the prior session. New 52-week highs still outnumbered new 52-week lows on the NYSE and on the Nasdaq exchange.
Overnight, the Reserve Bank of Australia left rates steady at +3.75% which surprised a slew of economists and analysts across the globe. Nearly everyone believed that Australia would raise rates to combat inflation. This allayed pressure on other central bankers to start raising rates as we make our way out of the worst global recession since WWII. The Street believes that the European Central Bank (ECB) and the Bank of England (BOE) will keep borrowing costs unchanged when they meet later this week. The dollar fell for a second straight day which sent a host of dollar denominated assets higher on Tuesday.
Stocks caught a bid after the National Association of Realtors said pending home sales rose +1% in December to 96.6. The pending home index was developed as a leading indicator of housing activity for existing homes, not new homes. Furthermore, a pending sale is booked when a contract is signed, but not yet closed. Normally, it takes anywhere from four to six weeks to close a contracted sale. Housing stocks also rallied after D.R. Horton (DHI +10.92%), one of the country's largest homebuilders, reported its first quarterly profit in several years.
It was a busy day on Capital Hill as both Paul Volcker, head of the U.S. Economic Recovery Advisory Board, and Treasury Secretary, Timothy Geithner testified before Congress. Volcker repeated his view that the government should prohibit commercial banks from owning hedge funds and limit their ability to trade for their own accounts to help mitigate risk at these financial powerhouses. Geithner said that the US must lower its deficit as the economy recovers.
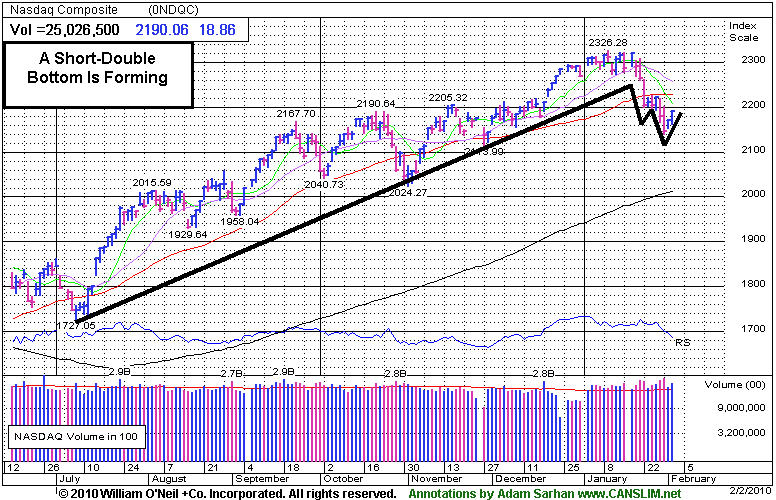
Looking at the market, Tuesday marked Day 2 of a new rally attempt which means that as long as Monday's lows are not breached, the earliest a possible follow-through day could emerge will be this Thursday. However, if Monday's lows are taken out, then the day count will be reset and the chances for a steeper correction increase markedly. It is also important to see how the major averages react to their respective 50-day moving average (DMA) lines. Until they all close above that important level the technical damage remaining on the charts is a concern. So far, the market's reaction has been tepid at best to the latest round of economic and earnings data. Remember that the recent series of distribution days coupled with the deleterious action in the major averages suggests large institutions are aggressively selling stocks. Disciplined investors will now wait for a new follow-through day to be produced before resuming any buying efforts. Until then, patience is key. Professional Money Management Services - A Winning System - Inquire today!
Our skilled team of portfolio managers knows how to follow the rules of this fact-based investment system. We do not follow opinion or the "conviction list" of some large Wall Street institution which would have us fully invested even during horrific bear markets. Instead, we remain fluid and only buy the best stocks when they are triggering proper technical buy signals. If you are not completely satisfied with the way your portfolio is being managed, Click here to submit your inquiry. *Accounts over $250,000 please. ** Serious inquires only, please.
PICTURED: The Nasdaq Composite Index may be forming a short double-bottom type pattern, yet gains above the 50-day moving average are needed for the outlook to improve meaningfully.
|
|
|
 |
Tech, Retail, and Healthcare Groups Among Best Gainers
Kenneth J. Gruneisen - Passed the CAN SLIM® Master's Exam
The Biotechnology Index ($BTK +2.63%) led the tech sector while the Networking Index ($NWX +1.33%), Semiconductor Index ($SOX +0.91%), and Internet Index ($IIX +0.58%) followed along with smaller gains. The Retail Index ($RLX +1.35%) posted a gain, and the Bank Index ($BKX +0.23%) and Broker/Dealer Index ($XBD +0.62%) helped add a slightly positive influence on the major averages. Defensive groups also posted gains, led by the Healthcare Index ($HMO +1.55%), while the Integrated Oil Index ($XOI +1.07%), Oil Services Index ($OSX +0.86%), and the Gold & Silver Index ($XAU +0.27%) also edged higher.
Charts courtesy www.stockcharts.com
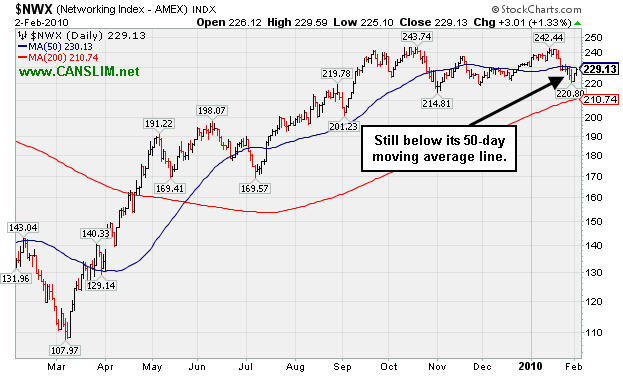
PICTURED: The Networking Index ($NWX +1.33%) is still trading under its 50-day moving average (DMA) line, yet it is now consolidating within -6% of its highs.
| Oil Services |
$OSX |
201.41 |
+1.72 |
+0.86% |
+3.33% |
| Healthcare |
$HMO |
1,483.91 |
+22.61 |
+1.55% |
+0.74% |
| Integrated Oil |
$XOI |
1,053.38 |
+11.12 |
+1.07% |
-1.39% |
| Semiconductor |
$SOX |
328.70 |
+2.98 |
+0.91% |
-8.67% |
| Networking |
$NWX |
229.13 |
+3.01 |
+1.33% |
-0.84% |
| Internet |
$IIX |
222.08 |
+1.28 |
+0.58% |
-5.04% |
| Broker/Dealer |
$XBD |
114.32 |
+0.70 |
+0.62% |
-0.63% |
| Retail |
$RLX |
404.11 |
+5.38 |
+1.35% |
-1.71% |
| Gold & Silver |
$XAU |
156.55 |
+0.42 |
+0.27% |
-6.95% |
| Bank |
$BKX |
47.31 |
+0.11 |
+0.23% |
+10.77% |
| Biotech |
$BTK |
1,002.27 |
+25.69 |
+2.63% |
+6.38% |
|
|
|
 |
Leader Perched Above Max Buy Level
Kenneth J. Gruneisen - Passed the CAN SLIM® Master's Exam
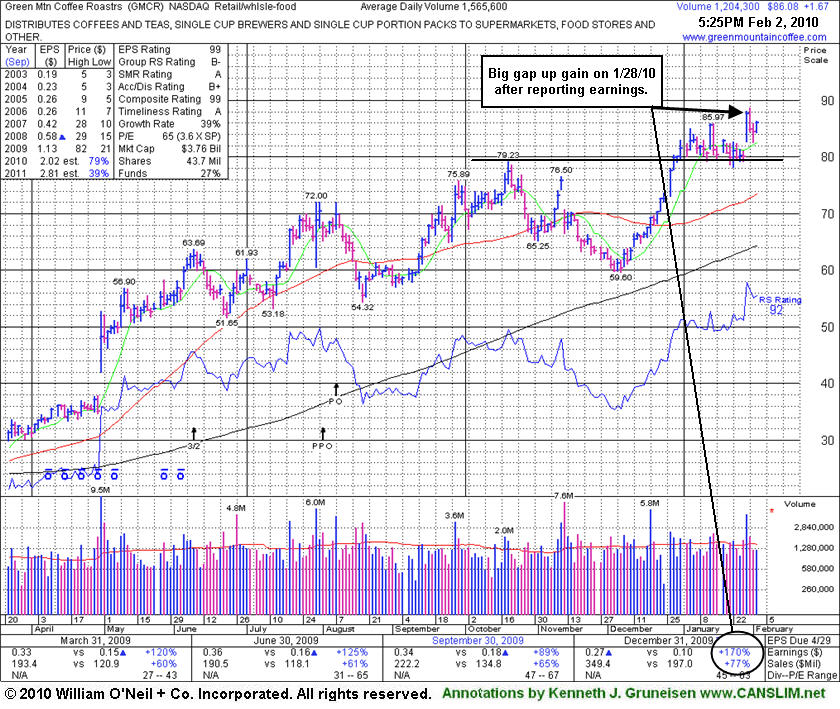
Green Mountain Coffee Roasters (GMCR +$1.67 or +1.98% to $86.08) is perched near all-time highs above its "max buy" level. Its small gain today on light volume led to its second best close ever. Recent chart lows in the $78 area are an important support level to watch now. It is clear of resistance due to overhead supply, a factor making it more likely to sprint higher, unhindered. Disciplined investors would avoid chasing it more than +5% above its latest pivot point. Meanwhile, losses should always be kept small by strictly selling any time any stock falls more than -7% from your buy price.
GMCR has stayed well above prior chart highs while recently consolidating, and it has shown healthy action since its last appearance in this Featured Stock Update (FSU) section on January 13, 2010 under the headline "Gains Leave Winner Extended From Latest Base. GMCR had made a new appearance on 12/28/09 in yellow in the mid-day report (read here), returning the previously featured favorite to the Featured Stocks page at CANSLIM.net. Weak action had led it to be dropped from the Featured Stocks list on 12/01/09, but the repair of its prior 50-day moving average (DMA) line violation had improve its outlook. Do not be confused by the 3-for-2 split that occurred in the interim, as GMCR has traded up as much as +240% since appearing with an annotated graph under the headline "It May Soon Be Time To Go Green" when featured in the January 2009 CANSLIM.net News (read here).
|
|
|
Color Codes Explained :
Y - Better candidates highlighted by our
staff of experts.
G - Previously featured
in past reports as yellow but may no longer be buyable under the
guidelines.
***Last / Change / Volume quote data in this table corresponds with the timestamp on the note***
Symbol/Exchange
Company Name
Industry Group |
Last |
Chg. |
Vol
% DAV |
Date Featured |
Price Featured |
Latest Pivot Point
Featured |
Status |
| Latest Max Buy Price |
ARST
-
|
$24.41
|
+0.21
|
152,674
31% DAV
493,100
|
12/22/2009
(Date
Featured) |
$25.94
(Price
Featured) |
PP = $27.20 |
G |
| MB = $28.56 |
Most Recent Note - 2/2/2010 4:06:47 PM
G - Two small gains on very light volume have followed 3 consecutive losses. Its outlook is increasingly questionable the longer it remains below its 50 DMA line. Distributional pressure negated its latest breakout. ARST was first featured in yellow at $19.91 in the 9/01/09 mid-day report with an annotated daily graph (read here).
>>> The latest Featured Stock Update with an annotated graph appeared on 1/21/2010. click here.
|
|
C
A
S
I |
News |
Chart |
SEC
View all notes Alert
me of new notes
Company
Profile
|
BIDU
- NASDAQ
Baidu Inc Ads
INTERNET - Internet Information Providers
|
$426.69
|
+1.01
|
924,481
51% DAV
1,798,400
|
1/13/2010
(Date
Featured) |
$431.25
(Price
Featured) |
PP = $426.75 |
G |
| MB = $448.09 |
Most Recent Note - 2/2/2010 4:09:47 PM
G - Quiet gains this week helped it edged back up above its 50 DMA line. Due to report earnings after the close on February 9th. Gaps down for considerable losses on 1/19 and 1/22 pressured it under its November '09 highs and violated its short-term average line, hurting its outlook after recently spiking to new all-time highs.
>>> The latest Featured Stock Update with an annotated graph appeared on 1/14/2010. click here.
|
|
C
A
S
I |
News |
Chart |
SEC
View all notes Alert
me of new notes
Company
Profile
|
CACC
- NASDAQ
Credit Acceptance Corp
FINANCIAL SERVICES - Credit Services
|
$51.45
|
-1.73
|
84,061
161% DAV
52,200
|
9/29/2009
(Date
Featured) |
$33.48
(Price
Featured) |
PP = $37.10 |
G |
| MB = $38.96 |
Most Recent Note - 2/2/2010 4:14:53 PM
G - Second consecutive loss today on above average volume, pulling back from all-time highs. Extended from any sound base. Well above its 50 DMA line, an important support level to watch. On Monday Jan 25th the company announced the pricing of $250 Million Senior Secured Notes.
>>> The latest Featured Stock Update with an annotated graph appeared on 1/28/2010. click here.
|
|
C
A
S
I |
News |
Chart |
SEC
View all notes Alert
me of new notes
Company
Profile
|
CRM
- NYSE
Salesforce.com Inc
INTERNET - Internet Software & Services
|
$65.06
|
-0.12
|
1,163,126
62% DAV
1,883,600
|
12/18/2009
(Date
Featured) |
$67.32
(Price
Featured) |
PP = $67.82 |
G |
| MB = $71.21 |
Most Recent Note - 2/2/2010 4:16:00 PM
G - Small loss on light volume today, remaining below its 50 DMA line. It would need to rebound above that important short-term average for its outlook to improve.
>>> The latest Featured Stock Update with an annotated graph appeared on 1/27/2010. click here.
|
|
C
A
S
I |
News |
Chart |
SEC
View all notes Alert
me of new notes
Company
Profile
|
GMCR
- NASDAQ
Green Mtn Coffee Roastrs
FOOD & BEVERAGE - Processed & Packaged Goods
|
$86.08
|
+1.67
|
1,204,325
77% DAV
1,565,600
|
12/28/2009
(Date
Featured) |
$77.49
(Price
Featured) |
PP = $76.50 |
G |
| MB = $80.33 |
Most Recent Note - 2/2/2010 4:17:42 PM
G - Perched near all-time highs, its small gain today on light volume led to its second best close ever. Recent chart lows in the $78 area are an important support level to watch now.
>>> The latest Featured Stock Update with an annotated graph appeared on 2/2/2010. click here.
|
|
C
A
S
I |
News |
Chart |
SEC
View all notes Alert
me of new notes
Company
Profile
|
ISRG
- NASDAQ
Intuitive Surgical Inc
HEALTH SERVICES - Medical Appliances & Equipment
|
$335.59
|
+6.94
|
470,864
92% DAV
510,900
|
1/22/2010
(Date
Featured) |
$340.40
(Price
Featured) |
PP = $314.00 |
G |
| MB = $329.70 |
Most Recent Note - 2/2/2010 4:22:30 PM
G - Gain today on near average volume for a close above its "max buy" level, its color code is changed to green. ISRG was featured again most recently in the 1/22/10 mid-day report (read here), returning after some time off the Featured Stocks list. Its annual earnings history (the A criteria) has been very impressive. ISRG has rebounded impressively from its March low ($84.86) and may be on course for its all-time high ($359 in 2007). Notes outlined technical deterioration before and when it was last dropped from the Featured Stocks list on 6/10/08. ISRG traded up more than 13-fold since first featured in yellow in CANSLIM.net reports in the summer of 2004.
>>> The latest Featured Stock Update with an annotated graph appeared on 1/22/2010. click here.
|
|
C
A
S
I |
News |
Chart |
SEC
View all notes Alert
me of new notes
Company
Profile
|
LFT
-
|
$34.28
|
-0.86
|
797,118
N/A
|
11/17/2009
(Date
Featured) |
$31.77
(Price
Featured) |
PP = $33.04 |
|
| MB = $34.69 |
Most Recent Note - 2/2/2010
Loss today on above average volume, sinking further below its 50 DMA line. Based on weak action it will be dropped from the Featured Stocks list tonight. Recently probing its prior chart highs in the $31-33 area which define the next technical support level. Due to report earnings on Wednesday, February 10 after the market close. Widespread weakness in China-based issues has clearly been a factor in recent days.
>>> The latest Featured Stock Update with an annotated graph appeared on 1/26/2010. click here.
|
|
C
A
S
I |
News |
Chart |
SEC
View all notes Alert
me of new notes
Company
Profile
|
PEGA
- NASDAQ
Pegasystems Inc
COMPUTER SOFTWARE & SERVICES - Business Software & Services
|
$37.00
|
+1.76
|
386,580
216% DAV
178,600
|
1/4/2010
(Date
Featured) |
$34.00
(Price
Featured) |
PP = $36.19 |
G |
| MB = $38.00 |
Most Recent Note - 2/2/2010 4:36:31 PM
G - Posted a second consecutive gain with above average volume for its second best close ever today, but wider intra-day price swings in recent days is a sign of uncertainty. Found support at its 50 DMA line after 2 big losses completely negated its 1/27/10 breakout. Its recent chart lows near $32.50 help define important technical support, where violations would trigger more worrisome sell signals. Negative market conditions (M criteria) are currently an overriding concern prompting great caution, since a follow-through day is still needed to confirm a new rally. After a hiatus from the Featured Stocks list, PEGA was featured again in the January 2010 issue of CANSLIM.net News (read here).
>>> The latest Featured Stock Update with an annotated graph appeared on 1/25/2010. click here.
|
|
C
A
S
I |
News |
Chart |
SEC
View all notes Alert
me of new notes
Company
Profile
|
VIT
-
|
$16.33
|
+0.03
|
298,304
N/A
|
12/24/2009
(Date
Featured) |
$20.07
(Price
Featured) |
PP = $21.17 |
|
| MB = $22.23 |
Most Recent Note - 2/2/2010
Small gain today on lighter volume. It would need to rebound above its 50 DMA line for its outlook to improve. Based on weak action it will be dropped from the Featured Stocks list tonight.
>>> The latest Featured Stock Update with an annotated graph appeared on 2/1/2010. click here.
|
|
C
A
S
I |
News |
Chart |
SEC
View all notes Alert
me of new notes
Company
Profile
|
|
|
|
THESE ARE NOT BUY RECOMMENDATIONS!
Comments contained in the body of this report are technical
opinions only. The material herein has been obtained
from sources believed to be reliable and accurate, however,
its accuracy and completeness cannot be guaranteed.
This site is not an investment advisor, hence it does
not endorse or recommend any securities or other investments.
Any recommendation contained in this report may not
be suitable for all investors and it is not to be deemed
an offer or solicitation on our part with respect to
the purchase or sale of any securities. All trademarks,
service marks and trade names appearing in this report
are the property of their respective owners, and are
likewise used for identification purposes only.
This report is a service available
only to active Paid Premium Members.
You may opt-out of receiving report notifications
at any time. Questions or comments may be submitted
by writing to Premium Membership Services 665 S.E. 10 Street, Suite 201 Deerfield Beach, FL 33441-5634 or by calling 1-800-965-8307
or 954-785-1121.
|
|
|


