You are not logged in.
This means you
CAN ONLY VIEW reports that were published prior to Monday, April 14, 2025.
You
MUST UPGRADE YOUR MEMBERSHIP if you want to see any current reports.
AFTER MARKET UPDATE - FRIDAY, FEBRUARY 1ST, 2013
Previous After Market Report Next After Market Report >>>
|
|
|
|
DOW |
+149.21 |
14,009.79 |
+1.08% |
|
Volume |
756,691,170 |
-19% |
|
Volume |
1,953,628,990 |
-8% |
|
NASDAQ |
+36.97 |
3,179.10 |
+1.18% |
|
Advancers |
2,333 |
75% |
|
Advancers |
1,799 |
70% |
|
S&P 500 |
+15.06 |
1,513.17 |
+1.01% |
|
Decliners |
681 |
22% |
|
Decliners |
690 |
27% |
|
Russell 2000 |
+9.11 |
911.20 |
+1.01% |
|
52 Wk Highs |
419 |
|
|
52 Wk Highs |
269 |
|
|
S&P 600 |
+5.59 |
509.43 |
+1.11% |
|
52 Wk Lows |
12 |
|
|
52 Wk Lows |
24 |
|
|
 |
Dow Closes Above 14,000 as Major Averages Extend Rally
Kenneth J. Gruneisen - Passed the CAN SLIM® Master's Exam
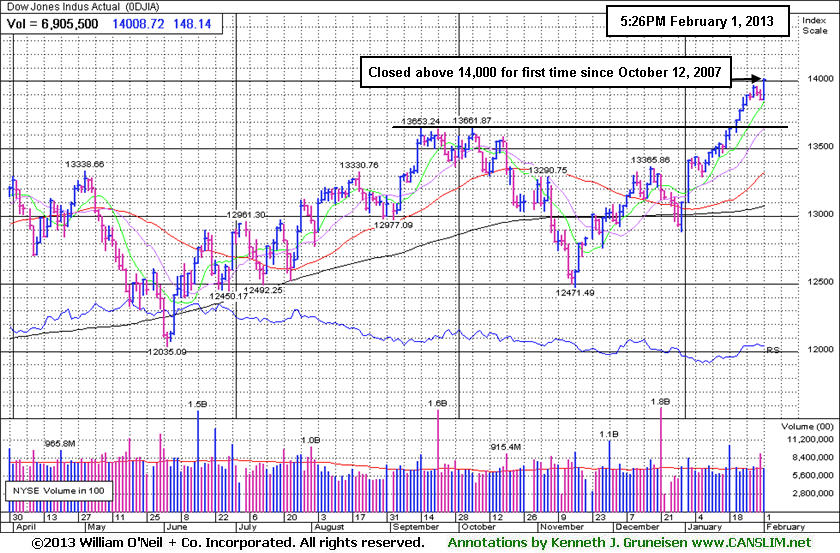
For the week, the Dow Jones Industrial Average gained +0.8%, the S&P 500 Index added +0.7%, and the Nasdaq Composite Index advanced +0.9%. The major averages posted solid gains on Friday. The volume totals were reported lighter on the NYSE and on the Nasdaq exchange, not indicating fresh buying demand from the institutional crowd. Breadth was positive as advancers led decliners by more than 3-1 on the NYSE and advancers led decliners by more than a 2-1 margin on the Nasdaq exchange. The total number of stocks hitting new 52-week highs swelled and easily outnumbered new 52-week lows on the NYSE and on the Nasdaq exchange. There were 110 high-ranked companies from the CANSLIM.net Leaders List making new 52-week highs and appearing on the CANSLIM.net BreakOuts Page, more than doubling the prior session total of 47 stocks. There were gains for 8 of the 11 high-ranked companies currently included on the Featured Stocks Page.
Stocks rallied from the opening bell on several positive economic reports. Although the unemployment rate rose 0.1% to 7.9% in January, overall payroll activity was broadly in-line with expectations. In addition, the December payroll numbers were revised significantly higher. Separately, the University of Michigan's consumer sentiment index, ISM manufacturing and construction spending all topped estimates.
All 10 sectors on the S&P closed higher, led by over +1% gains in financial, tech, and material stocks. Shares of Bank of America Corp (BAC +3.45%) and JP Morgan Chase & Co (JPM +1.70%) rallied. On the earnings front, Chevron Corp (CVX +1.17%), Tyson Foods (TSN +3.07%), and Ingersoll-Rand Plc (IR +1.89%) rose after the companies posted better-than-expected profit tallies. In other news, animal health company Zoetis Inc (ZTS) rallied $5.01 to $31.01 in its first day of trading.
Turning to fixed income markets, Treasuries were lower along the curve with the benchmark 10-year note down 5/16 of a point to yield 2.03%.
The latest rally has produced a few action worthy candidates meeting all of the fact-based investment system's criteria. Selectivity and discipline are required, as always. Investors may consider new buying efforts in stocks meeting all key criteria, as the market's (M criteria) confirmed uptrend has been comprised by great leadership (stocks hitting new 52-week highs) in the broader market. Widespread gains helped all of the major averages blast higher, and the benchmark S&P 500 Index is perched at its best level in more than five years.
Watch for an announcement via email concerning the next WEBCAST. The webcast will also be available via an updated link highlighted at the top of the Premium Member Homepage.
PICTURED: The Dow Jones Industrial Average rallied to close above 14,000 for the first time since October 12, 2007.
|
 Kenneth J. Gruneisen started out as a licensed stockbroker in August 1987, a couple of months prior to the historic stock market crash that took the Dow Jones Industrial Average down -22.6% in a single day. He has published daily fact-based fundamental and technical analysis on high-ranked stocks online for two decades. Through FACTBASEDINVESTING.COM, Kenneth provides educational articles, news, market commentary, and other information regarding proven investment systems that work in good times and bad.
Comments contained in the body of this report are technical opinions only and are not necessarily those of Gruneisen Growth Corp. The material herein has been obtained from sources believed to be reliable and accurate, however, its accuracy and completeness cannot be guaranteed. Our firm, employees, and customers may effect transactions, including transactions contrary to any recommendation herein, or have positions in the securities mentioned herein or options with respect thereto. Any recommendation contained in this report may not be suitable for all investors and it is not to be deemed an offer or solicitation on our part with respect to the purchase or sale of any securities. |
|
 |
Financial, Tech, Energy, and Defensive Groups Rose
Kenneth J. Gruneisen - Passed the CAN SLIM® Master's Exam
The Bank Index ($BKX +1.67%) and Broker/Dealer Index ($XBD +1.06%) both posted gains underpinning the major averages' rally on Friday. The Semiconductor Index ($SOX +1.89%), Biotechnology Index ($BTK +1.27%), and Internet Index ($IIX +1.15%) led the tech sector higher while the Networking Index ($NWX +0.15%) finished nearly unchanged. The Retail Index ($RLX +0.31%) posted a small gain. Energy-related shares rose and boosted the Integrated Oil Index ($XOI +1.14%) and the Oil Services Index ($OSX +1.22%). The defensive groups also tallied gains the Healthcare Index ($HMO +1.23%) and Gold & Silver Index ($XAU +1.51%) rounded out the widely positive session.
Charts courtesy www.stockcharts.com
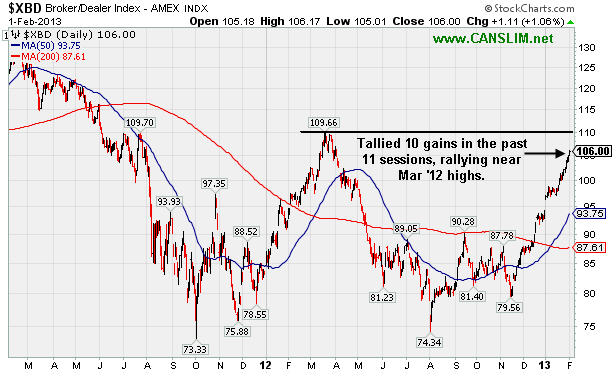
PICTURED: The Broker/Dealer Index ($XBD +1.06%) has tallied 10 gains in the past 11 sessions while rallying near its March 2012 highs.
| Oil Services |
$OSX |
250.67 |
+3.01 |
+1.22% |
+13.86% |
| Healthcare |
$HMO |
2,696.15 |
+32.67 |
+1.23% |
+7.24% |
| Integrated Oil |
$XOI |
1,368.24 |
+15.46 |
+1.14% |
+10.18% |
| Semiconductor |
$SOX |
420.55 |
+7.82 |
+1.89% |
+9.50% |
| Networking |
$NWX |
242.59 |
+0.37 |
+0.15% |
+7.08% |
| Internet |
$IIX |
356.77 |
+4.04 |
+1.15% |
+9.10% |
| Broker/Dealer |
$XBD |
106.00 |
+1.11 |
+1.06% |
+12.37% |
| Retail |
$RLX |
700.28 |
+2.15 |
+0.31% |
+7.23% |
| Gold & Silver |
$XAU |
151.94 |
+2.26 |
+1.51% |
-8.25% |
| Bank |
$BKX |
54.73 |
+0.90 |
+1.67% |
+6.73% |
| Biotech |
$BTK |
1,682.32 |
+21.15 |
+1.27% |
+8.75% |
|
|
|
 |
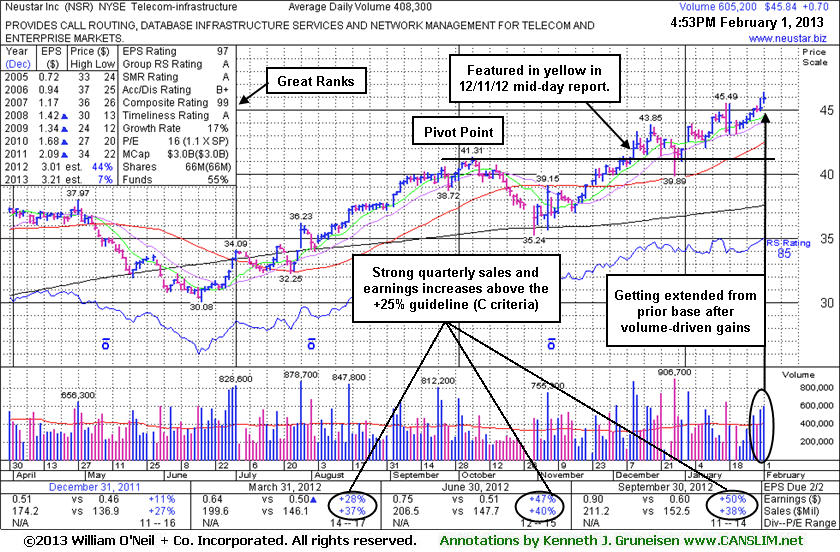
Getting Extended After Volume-Driven Gains To New Highs
Kenneth J. Gruneisen - Passed the CAN SLIM® Master's Exam
Neustar Inc (NSR +$0.70 or +1.55% to $45.84) hit another new 52-week high today, getting more extended from its prior base while rallying with above average volume behind its latest gains. Disciplined investors know to avoid chasing extended stocks more than +5% above their pivot point, and they always sell if ever any stock falls more than -7% from their purchase price to properly manage risk under the fact-based system's guidelines. Its 50-day moving average (DMA) line defines near-term support.
Leadership from other high-ranked leaders in the Telecom - Infrastructure group is a reassuring sign (concerning the L criteria). Its Group Relative Strength Rating has improved to an 88 rating. It was highlighted in yellow in the 12/11/12 mid-day report (read here) as that day's gain on heavy volume +172% above average clinched a technical buy signal. It rose from a 10-week base during which it found support at its 200-day moving average (DMA) line. Prior highs and its 50-day moving average (DMA) line acted as support when consolidating after its technical breakout while investors may have accumulated shares before rallying further into new high territory. It was last shown in this FSU section on 1/16/13 with an annotated graph under the headline, "Extended From Base After Prior Highs Acted as Support".
Quarterly comparisons through Sep '12 showed 3 consecutive increases of more than the +25% minimum earnings guideline (C criteria). The number of top-rated funds owning its shares rose from 400 in Mar '12 to 409 in Dec '12, a slightly reassuring trend concerning the I criteria. Its Return On Equity is reported at 29%, well above the 17% minimum guideline. Its small supply of 66 million shares (S criteria) outstanding can lead to greater price volatility if the institutional crowd rushes to accumulate shares, or if they decide to leave.
|
|
|
Color Codes Explained :
Y - Better candidates highlighted by our
staff of experts.
G - Previously featured
in past reports as yellow but may no longer be buyable under the
guidelines.
***Last / Change / Volume data in this table is the closing quote data***
Symbol/Exchange
Company Name
Industry Group |
PRICE |
CHANGE
(%Change) |
Day High |
Volume
(% DAV)
(% 50 day avg vol) |
52 Wk Hi
% From Hi |
Featured
Date |
Price
Featured |
Pivot Featured |
|
Max Buy |
CELG
-
NASDAQ
Celgene Corp
DRUGS - Drug Manufacturers - Major
|
$101.44
|
+2.48
2.51% |
$102.29
|
5,192,657
143.35% of 50 DAV
50 DAV is 3,622,300
|
$100.12
1.32%
|
12/11/2012
|
$82.24
|
PP = $81.34
|
|
MB = $85.41
|
 Most Recent Note - 2/1/2013 6:14:56 PM
G - Hit new 52-week and all-time highs with today's volume-driven gain after hovering in a tight range near its all-time high, very extended from its prior base.
>>> The latest Featured Stock Update with an annotated graph appeared on 1/17/2013. Click here.
View all notes |
Alert me of new notes |
CANSLIM.net Company Profile |
SEC |
Zacks Reports |
StockTalk |
News |
Chart |
Request a new note
C
A N
S L
I M


|
CFNL
-
NASDAQ
Cardinal Financial Corp
BANKING - Regional - Southeast Banks
|
$16.40
|
+0.06
0.37% |
$16.49
|
138,288
61.96% of 50 DAV
50 DAV is 223,200
|
$16.90
-2.96%
|
12/3/2012
|
$15.20
|
PP = $16.31
|
|
MB = $17.13
|
Most Recent Note - 1/31/2013 5:37:58 PM
Y - Quietly consolidating above support at its 50 DMA line and trading just above its pivot point. Subsequent losses leading to a damaging violation and a slump below the recent low ($15.74 on 1/18/13) would raise concerns and trigger technical sell signals. See the latest FSU analysis for more details and a new annotated graph.
>>> The latest Featured Stock Update with an annotated graph appeared on 1/31/2013. Click here.
View all notes |
Alert me of new notes |
CANSLIM.net Company Profile |
SEC |
Zacks Reports |
StockTalk |
News |
Chart |
Request a new note
C
A N
S L
I M
|
CMCSA
-
NASDAQ
Comcast Corp Cl A
MEDIA - CATV Systems
|
$38.60
|
+0.52
1.37% |
$38.62
|
15,351,930
134.67% of 50 DAV
50 DAV is 11,399,700
|
$40.28
-4.17%
|
12/3/2012
|
$37.08
|
PP = $38.06
|
|
MB = $39.96
|
Most Recent Note - 1/31/2013 12:05:25 PM
Y - Encountering recent distributional pressure and today's 4th consecutive loss has it retreating near prior highs and its 50 DMA line defining important chart support. Subsequent violations may trigger technical sell signals.
>>> The latest Featured Stock Update with an annotated graph appeared on 1/29/2013. Click here.
View all notes |
Alert me of new notes |
CANSLIM.net Company Profile |
SEC |
Zacks Reports |
StockTalk |
News |
Chart |
Request a new note
C
A N
S L
I M
|
KORS
-
NYSE
Michael Kors Hldgs Ltd
RETAIL - Apparel Stores
|
$55.72
|
-0.41
-0.73% |
$56.98
|
3,124,692
92.07% of 50 DAV
50 DAV is 3,394,000
|
$60.00
-7.13%
|
1/23/2013
|
$54.98
|
PP = $58.72
|
|
MB = $61.66
|
Most Recent Note - 1/30/2013 2:08:03 PM
Y - Hovering near its high since a "negative reversal" after touching a new 52-week high on 1/28/13, and it recently tallied gains with ever-increasing volume as it approached its 52-week high and pivot point. Disciplined investors may watch for volume-driven gains above the pivot point to trigger a proper technical buy signal before taking action. See the latest FSU analysis under the headline, "High-Ranked Luxury Apparel Firm Worthy For Watchlist - Wednesday, January 23, 2013", for more details and an annotated weekly graph.
>>> The latest Featured Stock Update with an annotated graph appeared on 1/23/2013. Click here.
View all notes |
Alert me of new notes |
CANSLIM.net Company Profile |
SEC |
Zacks Reports |
StockTalk |
News |
Chart |
Request a new note
C
A N
S L
I M
|
MIDD
-
NASDAQ
Middleby Corp
MANUFACTURING - Diversified Machinery
|
$144.49
|
+3.13
2.21% |
$146.46
|
196,098
231.25% of 50 DAV
50 DAV is 84,800
|
$144.71
-0.15%
|
10/8/2012
|
$118.46
|
PP = $122.67
|
|
MB = $128.80
|
Most Recent Note - 2/1/2013 12:32:03 PM
G - Hitting another new all-time high today, getting even more extended from any sound base. See the latest FSU analysis for more details and a new annotated graph.
>>> The latest Featured Stock Update with an annotated graph appeared on 1/30/2013. Click here.
View all notes |
Alert me of new notes |
CANSLIM.net Company Profile |
SEC |
Zacks Reports |
StockTalk |
News |
Chart |
Request a new note
C
A N
S L
I M
|
Symbol/Exchange
Company Name
Industry Group |
PRICE |
CHANGE
(%Change) |
Day High |
Volume
(% DAV)
(% 50 day avg vol) |
52 Wk Hi
% From Hi |
Featured
Date |
Price
Featured |
Pivot Featured |
|
Max Buy |
N
-
NYSE
Netsuite Inc
DIVERSIFIED SERVICES - Business/Management Services
|
$69.14
|
-1.09
-1.55% |
$75.75
|
1,399,435
411.96% of 50 DAV
50 DAV is 339,700
|
$71.51
-3.32%
|
12/12/2012
|
$64.75
|
PP = $67.12
|
|
MB = $70.48
|
Most Recent Note - 2/1/2013 12:43:44 PM
G - Reversed off earlier highs after a gap up today for a new 52-week high. Reported earnings +20% on +33% sales revenues for the Dec '12 quarter, below the +25% minimum earnings guideline (C criteria) raising fundamental concerns.
>>> The latest Featured Stock Update with an annotated graph appeared on 1/18/2013. Click here.
View all notes |
Alert me of new notes |
CANSLIM.net Company Profile |
SEC |
Zacks Reports |
StockTalk |
News |
Chart |
Request a new note
C
A N
S L
I M
|
NP
-
NYSE
Neenah Paper Inc
CONSUMER NON-DURABLES - Paper and Paper Products
|
$31.45
|
+0.51
1.65% |
$31.76
|
130,772
173.21% of 50 DAV
50 DAV is 75,500
|
$32.57
-3.44%
|
1/25/2013
|
$31.80
|
PP = $31.76
|
|
MB = $33.35
|
Most Recent Note - 1/31/2013 11:36:01 AM
Y - Rebounding back toward its pivot point today following a spurt of volume-driven losses. A "negative reversal" for a loss on heavy volume after hitting a new 52-week high on 1/25/13 was noted as a worrisome sign of distributional pressure as it failed to finish strong and did not clinch a technical buy signal.
>>> The latest Featured Stock Update with an annotated graph appeared on 1/25/2013. Click here.
View all notes |
Alert me of new notes |
CANSLIM.net Company Profile |
SEC |
Zacks Reports |
StockTalk |
News |
Chart |
Request a new note
C
A N
S L
I M
|
NSR
-
NYSE
Neustar Inc
TELECOMMUNICATIONS - Diversified Communication Serv
|
$45.84
|
+0.70
1.55% |
$46.36
|
605,289
148.25% of 50 DAV
50 DAV is 408,300
|
$45.88
-0.09%
|
12/11/2012
|
$41.85
|
PP = $41.41
|
|
MB = $43.48
|
Most Recent Note - 2/1/2013 6:11:45 PM
G - Hit a new 52-week high today with a 2nd consecutive volume-driven gain, getting more extended from its prior base. See the latest FSU analysis for more details and a new annotated graph.
>>> The latest Featured Stock Update with an annotated graph appeared on 2/1/2013. Click here.
View all notes |
Alert me of new notes |
CANSLIM.net Company Profile |
SEC |
Zacks Reports |
StockTalk |
News |
Chart |
Request a new note
C
A N
S L
I M
|
RAX
-
NYSE
Rackspace Hosting Inc
INTERNET - Internet Software and; Services
|
$76.31
|
+0.96
1.27% |
$77.10
|
1,895,366
166.48% of 50 DAV
50 DAV is 1,138,500
|
$81.36
-6.21%
|
12/18/2012
|
$71.88
|
PP = $70.10
|
|
MB = $73.61
|
Most Recent Note - 2/1/2013 6:17:10 PM
G - Consolidating above important support at its 50 DMA line, it tallied a gain today on higher volume. Recently noted with caution - "It is extended from the previously noted base. Company will announce its fourth quarter 2012 financial results on Tuesday, February 12, 2013 after the close."
>>> The latest Featured Stock Update with an annotated graph appeared on 1/22/2013. Click here.
View all notes |
Alert me of new notes |
CANSLIM.net Company Profile |
SEC |
Zacks Reports |
StockTalk |
News |
Chart |
Request a new note
C
A N
S L
I M
|
RNF
-
NYSE
Rentech Nitrogen Ptnr Lp
CHEMICALS - Agricultural Chemicals
|
$47.89
|
-0.39
-0.81% |
$49.18
|
392,952
131.55% of 50 DAV
50 DAV is 298,700
|
$48.80
-1.86%
|
11/1/2012
|
$39.11
|
PP = $40.15
|
|
MB = $42.16
|
Most Recent Note - 1/30/2013 2:04:03 PM
G - Wedging higher today with lackluster volume behind its gain while inching further into new 52-week high territory. Extended from its prior base, its prior highs and 50 DMA line coincide in the $40 area defining important chart support.
>>> The latest Featured Stock Update with an annotated graph appeared on 1/24/2013. Click here.
View all notes |
Alert me of new notes |
CANSLIM.net Company Profile |
SEC |
Zacks Reports |
StockTalk |
News |
Chart |
Request a new note
C
A N
S L
I M
|
Symbol/Exchange
Company Name
Industry Group |
PRICE |
CHANGE
(%Change) |
Day High |
Volume
(% DAV)
(% 50 day avg vol) |
52 Wk Hi
% From Hi |
Featured
Date |
Price
Featured |
Pivot Featured |
|
Max Buy |
VRX
-
NYSE
Valeant Pharmaceuticals
DRUGS - Drug Manufacturers - Other
|
$67.25
|
+0.93
1.40% |
$67.65
|
1,215,302
80.17% of 50 DAV
50 DAV is 1,515,900
|
$67.13
0.18%
|
12/20/2012
|
$60.24
|
PP = $61.21
|
|
MB = $64.27
|
Most Recent Note - 1/30/2013 2:05:33 PM
G - It is extended from a sound base and perched at its high today. Recently rallying further above its "max buy" level to new 52-week highs without great volume conviction behind its gains.
>>> The latest Featured Stock Update with an annotated graph appeared on 1/28/2013. Click here.
View all notes |
Alert me of new notes |
CANSLIM.net Company Profile |
SEC |
Zacks Reports |
StockTalk |
News |
Chart |
Request a new note
C
A N
S L
I M
|
|
|
|
THESE ARE NOT BUY RECOMMENDATIONS!
Comments contained in the body of this report are technical
opinions only. The material herein has been obtained
from sources believed to be reliable and accurate, however,
its accuracy and completeness cannot be guaranteed.
This site is not an investment advisor, hence it does
not endorse or recommend any securities or other investments.
Any recommendation contained in this report may not
be suitable for all investors and it is not to be deemed
an offer or solicitation on our part with respect to
the purchase or sale of any securities. All trademarks,
service marks and trade names appearing in this report
are the property of their respective owners, and are
likewise used for identification purposes only.
This report is a service available
only to active Paid Premium Members.
You may opt-out of receiving report notifications
at any time. Questions or comments may be submitted
by writing to Premium Membership Services 665 S.E. 10 Street, Suite 201 Deerfield Beach, FL 33441-5634 or by calling 1-800-965-8307
or 954-785-1121.
|
|
|

