You are not logged in.
This means you
CAN ONLY VIEW reports that were published prior to Monday, April 14, 2025.
You
MUST UPGRADE YOUR MEMBERSHIP if you want to see any current reports.
AFTER MARKET UPDATE - TUESDAY, FEBRUARY 1ST, 2011
Previous After Market Report Next After Market Report >>>
|
|
|
|
DOW |
+148.23 |
12,040.16 |
+1.25% |
|
Volume |
1,094,498,300 |
-9% |
|
Volume |
2,236,998,110 |
+18% |
|
NASDAQ |
+51.11 |
2,751.19 |
+1.89% |
|
Advancers |
2,491 |
80% |
|
Advancers |
2,051 |
74% |
|
S&P 500 |
+21.47 |
1,307.59 |
+1.67% |
|
Decliners |
548 |
18% |
|
Decliners |
634 |
23% |
|
Russell 2000 |
+17.64 |
798.89 |
+2.26% |
|
52 Wk Highs |
329 |
|
|
52 Wk Highs |
185 |
|
|
S&P 600 |
+8.45 |
424.57 |
+2.03% |
|
52 Wk Lows |
8 |
|
|
52 Wk Lows |
25 |
|
|
 |
New Recovery Highs For Mid-Caps, S&P 500, and Dow Industrial Average
Kenneth J. Gruneisen - Passed the CAN SLIM® Master's Exam
The market's broad rally on Tuesday was the strongest in two months, propelling the Dow to a close above 12,000 for the first time since June of 2008. The S&P 500 finished above 1,300. Advancing issues beat decliners by almost 5-1 on the NYSE and by more than 3-1 on the Nasdaq exchange. Volume totals were mixed, higher on the Nasdaq and lower on the NYSE versus the prior session's reported totals. New 52-week highs outnumbered new 52-week lows on the NYSE and on the Nasdaq exchange. The total number of new lows on the NYSE was in the single digits. There was a total of 100 high-ranked companies from the CANSLIM.net Leaders List that made new 52-week highs and appeared on the CANSLIM.net BreakOuts Page, up impressively from the total of 39 on the prior session. On the Featured Stocks Page there were gains from 20 out of 22 high-ranked market leaders.
Worries over Egypt faded and the market welcomed positive corporate earnings and a stronger-than-expected report on the nation's manufacturing. The ISM factory index for January rose to near a seven-year high, offsetting a weak report on construction spending. REITs were a drag on the markets after construction spending fell in December to the lowest level in a decade.
Archer Daniels Midland Co (ADM +6.2%) and United Parcel Service, Inc. (UPS +4.1%) were among companies that rallied after posting better-than-expected earnings. Dow component Pfizer Inc (PFE +5.5%) gained ground after its latest earnings and news of a $5 billion share repurchase offset a disappointing sales forecast. Alcoa Inc (AA +4.5%) rallied as copper prices hit a record and commodities rose on signs demand will remain robust in China. BP Plc (BP +1.1%) announced it will resume paying a quarterly dividend, and shares gained.
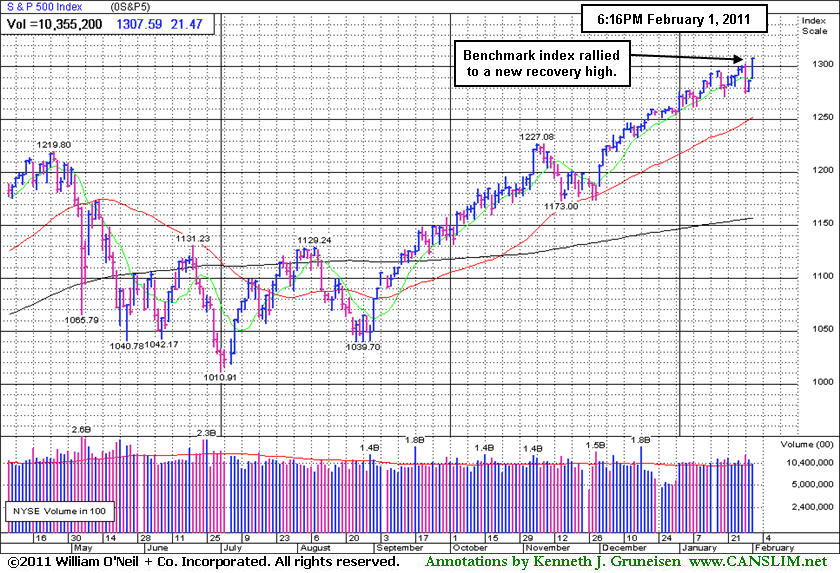
After the first positive January in four years, the stock market is off to the races in February while a strong rally remains in progress on Wall Street. The Dow Jones Industrial Average, S&P 500 Index, and the Mid-Cap S&P 400 Index collectively hit new recovery highs. Be ready to check out the soon-to-be published February 2011 issue of CANSLIM.net News for a comprehensive overview of current market conditions, leading groups, and the most recent featured stocks.
PICTURED: The benchmark S&P 500 Index rallied to a new recovery high.
|
 Kenneth J. Gruneisen started out as a licensed stockbroker in August 1987, a couple of months prior to the historic stock market crash that took the Dow Jones Industrial Average down -22.6% in a single day. He has published daily fact-based fundamental and technical analysis on high-ranked stocks online for two decades. Through FACTBASEDINVESTING.COM, Kenneth provides educational articles, news, market commentary, and other information regarding proven investment systems that work in good times and bad.
Comments contained in the body of this report are technical opinions only and are not necessarily those of Gruneisen Growth Corp. The material herein has been obtained from sources believed to be reliable and accurate, however, its accuracy and completeness cannot be guaranteed. Our firm, employees, and customers may effect transactions, including transactions contrary to any recommendation herein, or have positions in the securities mentioned herein or options with respect thereto. Any recommendation contained in this report may not be suitable for all investors and it is not to be deemed an offer or solicitation on our part with respect to the purchase or sale of any securities. |
|
 |
Widespread Gains From Tech, Financial, And Defensive Groups
Kenneth J. Gruneisen - Passed the CAN SLIM® Master's Exam
Gains from the Bank Index ($BKX +2.58%) and Broker/Dealer Index ($XBD +1.81%) provided a reassuring positive influence on the major averages. The tech sector was led higher by a solid gain from the Semiconductor Index ($SOX +2.57%), along with unanimous gains from the Networking Index ($NWX +1.89%), Internet Index ($IIX +2.12%), and Biotechnology Index ($BTK +0.96%). The Retail Index ($RLX +0.79%) was a relative laggard group. Meanwhile, the energy-related Oil Services Index ($OSX +0.84%) and Integrated Oil Index ($XOI +2.18%) posted gains and the defensive Healthcare Index ($HMO +2.47%) and Gold & Silver Index ($XAU +3.19%) charged higher.
Charts courtesy www.stockcharts.com
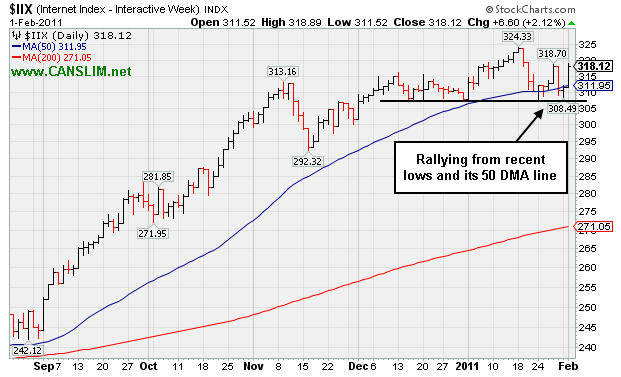
PICTURED: The Internet Index ($IIX +2.12%) rallied from recent lows and its 50-day moving average line.
| Oil Services |
$OSX |
268.24 |
+2.24 |
+0.84% |
+9.43% |
| Healthcare |
$HMO |
1,900.45 |
+45.83 |
+2.47% |
+12.32% |
| Integrated Oil |
$XOI |
1,321.60 |
+28.20 |
+2.18% |
+8.94% |
| Semiconductor |
$SOX |
451.83 |
+11.32 |
+2.57% |
+9.72% |
| Networking |
$NWX |
296.10 |
+5.50 |
+1.89% |
+5.54% |
| Internet |
$IIX |
318.12 |
+6.60 |
+2.12% |
+3.38% |
| Broker/Dealer |
$XBD |
125.99 |
+2.24 |
+1.81% |
+3.69% |
| Retail |
$RLX |
501.96 |
+3.95 |
+0.79% |
-1.26% |
| Gold & Silver |
$XAU |
206.29 |
+6.37 |
+3.19% |
-8.95% |
| Bank |
$BKX |
54.37 |
+1.37 |
+2.58% |
+4.14% |
| Biotech |
$BTK |
1,291.91 |
+12.33 |
+0.96% |
-0.44% |
|
|
|
 |
Perched Near 52-Week High Following "Double Bottom" Breakout
Kenneth J. Gruneisen - Passed the CAN SLIM® Master's Exam
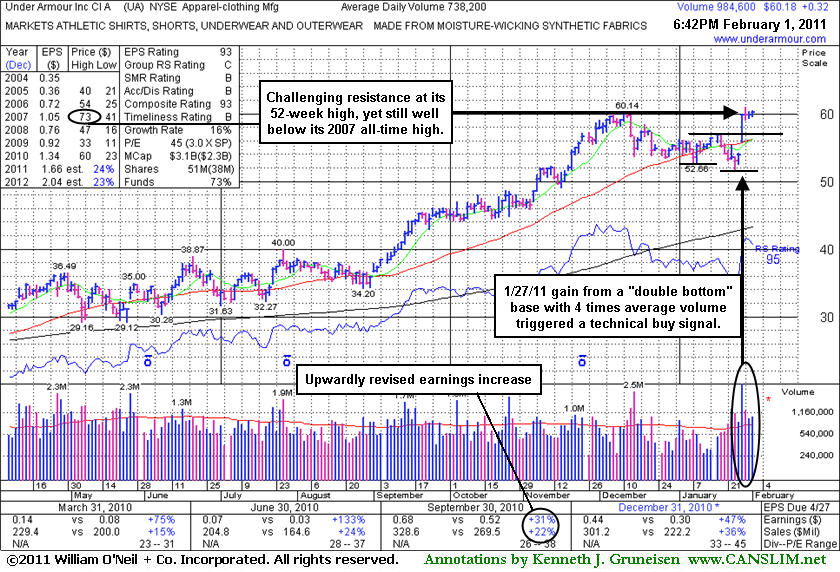
Under Armour Inc (UA +$0.32 or +0.53% to $60.18) posted a small gain today with above average volume. It closed the session above its "max buy" level, and its color code was changed to green. As previously noted - "It may encounter resistance at its 52-week high, and it remains well off its 2007 all-time high ($73.40)."
In its last FSU appearance on 12/23/10 under the headline "Fundamental And Technical Deterioration Raise Concerns" an annotated graph showed it violating an upward trendline with a considerable loss on above average volume while slumping toward a recent low. Mild distributional pressure subsequently led to violations of the recent chart low ($53.60) and its 50-day moving average (DMA) line, raising concerns. However, on 1/27/11 a considerable gap up gain above its 50 DMA line with more than 4 times average volume helped it break out from a near-minimum-length 8-week "double bottom" type base identified in the mid-day report. Its color code was changed to yellow with new pivot point cited based on its 1/19/11 high, and its close above it triggered a new technical buy signal. The strength was noted as an immediate reaction to strong earnings and sales revenues increases reported for the quarter ended Dec 31, 2011 with positive guidance. Earnings were up +47% on +36% better sales revenues for the quarter ended December 31, 2010 versus the year ago period. Fundamentally, that improvement was a big help with respect to the C criteria. (Editor's Note: Its earnings increase in the September '10 comparison appears to have been upwardly revised since its prior FSU appearance that we have linked to in the headline above.) Earlier notes had acknowledged the downward turn in annual earnings (A criteria) in FY '08, another fundamental concern with respect to the fact-based investment system.
|
|
|
Color Codes Explained :
Y - Better candidates highlighted by our
staff of experts.
G - Previously featured
in past reports as yellow but may no longer be buyable under the
guidelines.
***Last / Change / Volume data in this table is the closing quote data***
Symbol/Exchange
Company Name
Industry Group |
PRICE |
CHANGE
(%Change) |
Day High |
Volume
(% DAV)
(% 50 day avg vol) |
52 Wk Hi
% From Hi |
Featured
Date |
Price
Featured |
Pivot Featured |
|
Max Buy |
BIDU
-
NASDAQ
Baidu Inc Ads
INTERNET - Internet Information Providers
|
$118.73
|
+10.10
9.30% |
$119.21
|
21,996,865
290.41% of 50 DAV
50 DAV is 7,574,300
|
$115.04
3.21%
|
2/1/2011
|
$117.74
|
PP = $112.08
|
|
MB = $117.68
|
 Most Recent Note - 2/1/2011 12:58:52 PM
Y - Gapped up today, rising from a "double bottom" base pattern. Color code is changed to yellow with pivot point cited based upon its 12/07/10 high. It rebounded above its 50 DMA line in recent weeks. It stayed well above its 200 DMA line in the interim since it was dropped from the Featured Stocks list on 12/27/10.
>>> The latest Featured Stock Update with an annotated graph appeared on 11/30/2010. Click here.
View all notes |
Alert me of new notes |
CANSLIM.net Company Profile |
SEC |
Zacks Reports |
StockTalk |
News |
Chart |
Request a new note
C
A N
S L
I M


|
CCME
-
NASDAQ
China Mediaexpress Hldgs
FINANCIAL SERVICES - Diversified Investments
|
$16.66
|
-1.18
-6.61% |
$17.75
|
7,614,442
528.49% of 50 DAV
50 DAV is 1,440,800
|
$23.97
-30.50%
|
1/27/2011
|
$22.37
|
PP = $21.50
|
|
MB = $22.58
|
Most Recent Note - 2/1/2011 4:50:25 PM
G - Closed below its 50 DMA line today, violating that important short-term average with a 3rd consecutive damaging loss with above average volume. On the prior session it violated recent chart lows and closed near the session low, triggering a technical sell signal. A negative reversal at its 52-week high on higher volume led to a close below its pivot point on Friday as it promptly negated its 1/27/11 technical breakout from a cup-with-handle type base. Based on poor technical action it has quickly dropped -30% from its 52-week high, and it will be dropped from the Featured Stocks list tonight. See the latest FSU analysis for more details and an annotated graph.
>>> The latest Featured Stock Update with an annotated graph appeared on 1/31/2011. Click here.
View all notes |
Alert me of new notes |
CANSLIM.net Company Profile |
SEC |
Zacks Reports |
StockTalk |
News |
Chart |
Request a new note
C
A N
S L
I M
|
CRUS
-
NASDAQ
Cirrus Logic Inc
ELECTRONICS - Semiconductor - Specialized
|
$21.33
|
+0.30
1.43% |
$21.66
|
3,734,843
110.39% of 50 DAV
50 DAV is 3,383,300
|
$21.72
-1.80%
|
1/28/2011
|
$20.69
|
PP = $19.17
|
|
MB = $20.13
|
Most Recent Note - 2/1/2011 4:45:40 PM
G - Second consecutive small gain today with near average volume for a new high close. Held its ground after a considerable breakout gain on 1/27/11 helped it technically break out from a bullish reverse-head-and-shoulders type pattern. Color code was changed to green, meanwhile patient investors may look to accumulate shares on light volume pullbacks toward support at prior chart highs in the $19 area
>>> The latest Featured Stock Update with an annotated graph appeared on 1/28/2011. Click here.
View all notes |
Alert me of new notes |
CANSLIM.net Company Profile |
SEC |
Zacks Reports |
StockTalk |
News |
Chart |
Request a new note
C
A N
S L
I M
|
DECK
-
NASDAQ
Deckers Outdoor Corp
CONSUMER NON-DURABLES - Textile - Apparel Footwear
|
$75.97
|
+2.58
3.52% |
$76.68
|
911,936
47.71% of 50 DAV
50 DAV is 1,911,300
|
$87.88
-13.55%
|
10/27/2010
|
$54.16
|
PP = $54.86
|
|
MB = $57.60
|
Most Recent Note - 2/1/2011 11:14:25 AM
G - Up today, yet still sputtering below its 50 DMA line. That short-term average may now act as resistance, while subsequent gains above it would help its outlook improve.
>>> The latest Featured Stock Update with an annotated graph appeared on 1/26/2011. Click here.
View all notes |
Alert me of new notes |
CANSLIM.net Company Profile |
SEC |
Zacks Reports |
StockTalk |
News |
Chart |
Request a new note
C
A N
S L
I M
|
EZCH
-
NASDAQ
Ezchip Semiconductor Ltd
ELECTRONICS - Semiconductor - Specialized
|
$30.28
|
+0.53
1.78% |
$30.90
|
272,195
92.11% of 50 DAV
50 DAV is 295,500
|
$33.20
-8.80%
|
12/2/2010
|
$27.53
|
PP = $26.00
|
|
MB = $27.30
|
Most Recent Note - 2/1/2011 11:26:52 AM
G - Up today while still consolidating above its 50 DMA line and prior chart highs in the $29 area which now coincide defining important support to watch.
>>> The latest Featured Stock Update with an annotated graph appeared on 1/21/2011. Click here.
View all notes |
Alert me of new notes |
CANSLIM.net Company Profile |
SEC |
Zacks Reports |
StockTalk |
News |
Chart |
Request a new note
C
A N
S L
I M
|
Symbol/Exchange
Company Name
Industry Group |
PRICE |
CHANGE
(%Change) |
Day High |
Volume
(% DAV)
(% 50 day avg vol) |
52 Wk Hi
% From Hi |
Featured
Date |
Price
Featured |
Pivot Featured |
|
Max Buy |
EZPW
-
NASDAQ
Ezcorp Inc Cl A
SPECIALTY RETAIL - Specialty Retail, Other
|
$27.73
|
+0.83
3.09% |
$27.86
|
367,935
89.89% of 50 DAV
50 DAV is 409,300
|
$29.94
-7.38%
|
11/5/2010
|
$24.02
|
PP = $23.85
|
|
MB = $25.04
|
Most Recent Note - 2/1/2011 3:49:38 PM
G - Quiet volume is behind today's gain while consolidating near its 50 DMA line which recently acted as support. It is not near any sound base, and its recent low ($25.56 on 1/25/11) defines an important support level now.
>>> The latest Featured Stock Update with an annotated graph appeared on 12/29/2010. Click here.
View all notes |
Alert me of new notes |
CANSLIM.net Company Profile |
SEC |
Zacks Reports |
StockTalk |
News |
Chart |
Request a new note
C
A N
S L
I M
|
FOSL
-
NASDAQ
Fossil Inc
CONSUMER DURABLES - Recreational Goods, Other
|
$73.05
|
+2.00
2.81% |
$73.38
|
851,698
118.60% of 50 DAV
50 DAV is 718,100
|
$74.34
-1.74%
|
2/1/2011
|
$73.30
|
PP = $74.44
|
|
MB = $78.16
|
Most Recent Note - 2/1/2011 3:56:22 PM
Y - Rallying near its 52-week high today after an orderly 8-week flat base. Color code is changed to yellow with new pivot point cited, however it may be considered a riskier "late-stage" base. Gains above its pivot with great volume conviction could confirm a new (or add-on) technical buy signal. Recent chart low ($66.05 on 1/25/11) defines important support
>>> The latest Featured Stock Update with an annotated graph appeared on 1/12/2011. Click here.
View all notes |
Alert me of new notes |
CANSLIM.net Company Profile |
SEC |
Zacks Reports |
StockTalk |
News |
Chart |
Request a new note
C
A N
S L
I M
|
HMSY
-
NASDAQ
H M S Holdings Corp
COMPUTER SOFTWARE and SERVICES - Healthcare Information Service
|
$65.22
|
+0.88
1.37% |
$65.79
|
84,941
58.06% of 50 DAV
50 DAV is 146,300
|
$67.42
-3.26%
|
11/19/2010
|
$61.89
|
PP = $63.01
|
|
MB = $66.16
|
Most Recent Note - 2/1/2011 4:38:31 PM
G - Today's gain with light volume helped it close back above its 50 DMA line and finish the session only -3.3% off its 52-week high. It is building a base-on-base type pattern, but its waning Relative Strength rank (now 70) has been noted as a concern.
>>> The latest Featured Stock Update with an annotated graph appeared on 1/3/2011. Click here.
View all notes |
Alert me of new notes |
CANSLIM.net Company Profile |
SEC |
Zacks Reports |
StockTalk |
News |
Chart |
Request a new note
C
A N
S L
I M
|
JOBS
-
NASDAQ
Fifty One Job Inc Ads
DIVERSIFIED SERVICES - Staffing and; Outsourcing Service
|
$57.11
|
+3.10
5.74% |
$57.25
|
100,323
69.43% of 50 DAV
50 DAV is 144,500
|
$61.28
-6.80%
|
10/13/2010
|
$42.07
|
PP = $40.60
|
|
MB = $42.63
|
Most Recent Note - 2/1/2011 10:54:01 AM
G - Rallying this week up from its 50 DMA line that defines important support. More damaging losses would raise concerns and trigger a technical sell signal.
>>> The latest Featured Stock Update with an annotated graph appeared on 12/30/2010. Click here.
View all notes |
Alert me of new notes |
CANSLIM.net Company Profile |
SEC |
Zacks Reports |
StockTalk |
News |
Chart |
Request a new note
C
A N
S L
I M
|
LULU
-
NASDAQ
Lululemon Athletica
MANUFACTURING - Textile Manufacturing
|
$73.20
|
+4.52
6.58% |
$73.79
|
3,542,299
172.76% of 50 DAV
50 DAV is 2,050,400
|
$74.60
-1.88%
|
1/26/2011
|
$68.11
|
PP = $74.70
|
|
MB = $78.44
|
Most Recent Note - 2/1/2011 10:56:34 AM
Y - Rallying toward its 52-week high today with an increase in volume. Subsequent gains to new highs with at least +50% above average volume may trigger a new (or add-on) technical buy signal, meanwhile any breach of its recent low ($65.30) or its 50 DMA line may trigger a more worrisome sell signal.
>>> The latest Featured Stock Update with an annotated graph appeared on 1/14/2011. Click here.
View all notes |
Alert me of new notes |
CANSLIM.net Company Profile |
SEC |
Zacks Reports |
StockTalk |
News |
Chart |
Request a new note
C
A N
S L
I M
|
Symbol/Exchange
Company Name
Industry Group |
PRICE |
CHANGE
(%Change) |
Day High |
Volume
(% DAV)
(% 50 day avg vol) |
52 Wk Hi
% From Hi |
Featured
Date |
Price
Featured |
Pivot Featured |
|
Max Buy |
MWIV
-
NASDAQ
M W I Veterinary Supply
HEALTH SERVICES - Medical Instruments and; Supplies
|
$63.76
|
+1.60
2.57% |
$65.00
|
58,656
102.37% of 50 DAV
50 DAV is 57,300
|
$67.13
-5.02%
|
11/4/2010
|
$61.79
|
PP = $59.60
|
|
MB = $62.58
|
Most Recent Note - 2/1/2011 10:59:07 AM
G - Rallying up from its 50 DMA line today, showing resilience after recently enduring distributional pressure. More damaging losses its recent chart low ($59.95 on 1/25/11) could raise greater concerns and trigger a technical sell signal.
>>> The latest Featured Stock Update with an annotated graph appeared on 12/21/2010. Click here.
View all notes |
Alert me of new notes |
CANSLIM.net Company Profile |
SEC |
Zacks Reports |
StockTalk |
News |
Chart |
Request a new note
C
A N
S L
I M
|
NFLX
-
NASDAQ
Netflix Inc
SPECIALTY RETAIL - Music and Video Stores
|
$212.90
|
-1.18
-0.55% |
$216.78
|
4,097,099
69.16% of 50 DAV
50 DAV is 5,924,100
|
$218.00
-2.34%
|
1/10/2011
|
$187.88
|
PP = $209.34
|
|
MB = $219.81
|
Most Recent Note - 2/1/2011 4:41:57 PM
Y - Volume totals have cooled this week while stubbornly holding its ground following 2 consecutive volume-driven gains for new highs. A considerable gap up gain on 1/27/11 followed a strong quarterly earnings report and confirmed a technical buy signal.
>>> The latest Featured Stock Update with an annotated graph appeared on 1/10/2011. Click here.
View all notes |
Alert me of new notes |
CANSLIM.net Company Profile |
SEC |
Zacks Reports |
StockTalk |
News |
Chart |
Request a new note
C
A N
S L
I M
|
NTAP
-
NASDAQ
Netapp Inc
COMPUTER HARDWARE - Data Storage Devices
|
$56.52
|
+1.79
3.27% |
$56.80
|
4,119,365
74.56% of 50 DAV
50 DAV is 5,525,100
|
$59.79
-5.47%
|
1/6/2011
|
$57.49
|
PP = $58.06
|
|
MB = $60.96
|
Most Recent Note - 2/1/2011 11:17:58 AM
G - Quiet gains this week have it trading up just above its 50 DMA line. More damaging losses below its recent chart low ($53.14 on 1/25/11) could raise greater concerns and trigger a more serious technical sell signal.
>>> The latest Featured Stock Update with an annotated graph appeared on 12/27/2010. Click here.
View all notes |
Alert me of new notes |
CANSLIM.net Company Profile |
SEC |
Zacks Reports |
StockTalk |
News |
Chart |
Request a new note
C
A N
S L
I M
|
OPEN
-
NASDAQ
Opentable Inc
INTERNET - Internet Software and Services
|
$81.62
|
+3.00
3.82% |
$82.60
|
894,805
112.91% of 50 DAV
50 DAV is 792,500
|
$82.70
-1.30%
|
1/5/2011
|
$74.05
|
PP = $76.79
|
|
MB = $80.63
|
Most Recent Note - 2/1/2011 11:20:17 AM
Y - Gains this week with lighter volume have it approaching its "max buy" level and now perched only -2.7% off its all-time high. Recent lows and its 50 DMA line define near-term chart support.
>>> The latest Featured Stock Update with an annotated graph appeared on 1/5/2011. Click here.
View all notes |
Alert me of new notes |
CANSLIM.net Company Profile |
SEC |
Zacks Reports |
StockTalk |
News |
Chart |
Request a new note
C
A N
S L
I M
|
ORCL
-
NASDAQ
Oracle Corp
COMPUTER SOFTWARE and SERVICES - Application Software
|
$33.24
|
+1.21
3.78% |
$33.43
|
32,566,171
114.72% of 50 DAV
50 DAV is 28,386,500
|
$33.30
-0.18%
|
1/20/2011
|
$32.31
|
PP = $32.37
|
|
MB = $33.99
|
Most Recent Note - 2/1/2011 4:54:38 PM
Y - Rallied back above its latest pivot point and hit a new 52-week high today with above average volume behind its gain. Recent chart low $30.80 defines near-term support above its 50 DMA line.
>>> The latest Featured Stock Update with an annotated graph appeared on 1/7/2011. Click here.
View all notes |
Alert me of new notes |
CANSLIM.net Company Profile |
SEC |
Zacks Reports |
StockTalk |
News |
Chart |
Request a new note
C
A N
S L
I M
|
Symbol/Exchange
Company Name
Industry Group |
PRICE |
CHANGE
(%Change) |
Day High |
Volume
(% DAV)
(% 50 day avg vol) |
52 Wk Hi
% From Hi |
Featured
Date |
Price
Featured |
Pivot Featured |
|
Max Buy |
PAY
-
NYSE
Verifone Systems Inc
COMPUTER HARDWARE - Transaction Automation Systems
|
$41.30
|
+1.36
3.41% |
$42.03
|
1,052,484
63.62% of 50 DAV
50 DAV is 1,654,200
|
$44.87
-7.96%
|
1/27/2011
|
$41.77
|
PP = $44.00
|
|
MB = $46.20
|
Most Recent Note - 2/1/2011 11:04:50 AM
Y - Rallying up from support at its 50 DMA line, an important near-term chart support level to watch. Color code was changed to yellow when a new pivot point was recently cited based on its 52-week high plus ten cents. Subsequent gains with heavy volume may trigger a new (or add-on) technical buy signal.
>>> The latest Featured Stock Update with an annotated graph appeared on 1/27/2011. Click here.
View all notes |
Alert me of new notes |
CANSLIM.net Company Profile |
SEC |
Zacks Reports |
StockTalk |
News |
Chart |
Request a new note
C
A N
S L
I M
|
PCLN
-
NASDAQ
Priceline.Com Inc
INTERNET - Internet Software and Services
|
$437.93
|
+9.41
2.20% |
$444.95
|
1,033,046
109.95% of 50 DAV
50 DAV is 939,600
|
$443.19
-1.19%
|
11/1/2002
|
$399.55
|
PP = $428.20
|
|
MB = $449.61
|
Most Recent Note - 2/1/2011 4:58:18 PM
Y - Today it touched a new 52-week high while consolidating above its 50 DMA line and above its pivot point. Its 50 DMA line defines important support to watch.
>>> The latest Featured Stock Update with an annotated graph appeared on 1/2/2011. Click here.
View all notes |
Alert me of new notes |
CANSLIM.net Company Profile |
SEC |
Zacks Reports |
StockTalk |
News |
Chart |
Request a new note
C
A N
S L
I M
|
RAX
-
NYSE
Rackspace Hosting Inc
INTERNET - Internet Software and; Services
|
$34.19
|
+0.68
2.03% |
$34.71
|
1,341,812
79.62% of 50 DAV
50 DAV is 1,685,300
|
$35.87
-4.68%
|
1/10/2011
|
$22.84
|
PP = $32.76
|
|
MB = $34.40
|
Most Recent Note - 2/1/2011 4:23:27 PM
G - Up on light volume today for its third-highest close ever. Found prompt support near its 50 DMA line recently after a 1/20/11 gap down completely negated its 1/11/11 technical breakout. Its recent low ($29.52 on 1/20/10) now defines important support to watch where subsequent violations would raise more serious concerns.
>>> The latest Featured Stock Update with an annotated graph appeared on 12/31/2010. Click here.
View all notes |
Alert me of new notes |
CANSLIM.net Company Profile |
SEC |
Zacks Reports |
StockTalk |
News |
Chart |
Request a new note
C
A N
S L
I M
|
ROVI
-
NASDAQ
Rovi Corp
COMPUTER SOFTWARE andamp; SERVICES - Security Software andamp; Services
|
$62.68
|
+0.92
1.49% |
$62.88
|
2,512,925
154.98% of 50 DAV
50 DAV is 1,621,400
|
$69.50
-9.81%
|
10/29/2010
|
$49.99
|
PP = $53.10
|
|
MB = $55.76
|
Most Recent Note - 2/1/2011 4:28:31 PM
G - Up today with above average volume, closing near its session high. It found support near its 50 DMA line after a couple of distribution days. The 1/10/11 low ($58.51) defines another near-term chart support level to watch.
>>> The latest Featured Stock Update with an annotated graph appeared on 1/25/2011. Click here.
View all notes |
Alert me of new notes |
CANSLIM.net Company Profile |
SEC |
Zacks Reports |
StockTalk |
News |
Chart |
Request a new note
C
A N
S L
I M
|
TIBX
-
NASDAQ
Tibco Software Inc
COMPUTER SOFTWARE and SERVICES - Business Software and Services
|
$23.98
|
+2.00
9.10% |
$24.41
|
8,505,812
333.16% of 50 DAV
50 DAV is 2,553,100
|
$22.08
8.61%
|
2/1/2011
|
$24.35
|
PP = $22.18
|
|
MB = $23.29
|
Most Recent Note - 2/1/2011 2:08:15 PM
Y - Spiked to a new 52-week high today with heavy volume behind its considerable gain while rising from an orderly flat base. Color code is changed to yellow but it has quickly gotten extended from what may be considered a "late-stage" or riskier base. Previously noted its streak of 4 quarterly comparisons with +25% earnings (good C criteria) increases with good sales revenues growth. It also has a good annual earnings (A criteria) history, and leadership (L criteria) in the Computer Software - Database group is reassuring.
There are no Featured Stock Updates™ available for this stock at this time. You may request one by clicking the Request a New Note link below
View all notes |
Alert me of new notes |
CANSLIM.net Company Profile |
SEC |
Zacks Reports |
StockTalk |
News |
Chart |
Request a new note
C
A N
S L
I M
|
Symbol/Exchange
Company Name
Industry Group |
PRICE |
CHANGE
(%Change) |
Day High |
Volume
(% DAV)
(% 50 day avg vol) |
52 Wk Hi
% From Hi |
Featured
Date |
Price
Featured |
Pivot Featured |
|
Max Buy |
UA
-
NYSE
Under Armour Inc Cl A
CONSUMER NON-DURABLES - Textile - Apparel Clothing
|
$60.18
|
+0.32
0.53% |
$60.46
|
984,907
134.17% of 50 DAV
50 DAV is 734,100
|
$60.98
-1.31%
|
1/27/2011
|
$58.31
|
PP = $56.99
|
|
MB = $59.84
|
Most Recent Note - 2/1/2011 4:32:46 PM
G - Small gain today with above average volume. It closed the session above its "max buy" level, and its color code is changed to green. As previously noted - "It may encounter resistance at its 52-week high, and it remains well off its 2007 all-time high ($73.40)."
>>> The latest Featured Stock Update with an annotated graph appeared on 2/1/2011. Click here.
View all notes |
Alert me of new notes |
CANSLIM.net Company Profile |
SEC |
Zacks Reports |
StockTalk |
News |
Chart |
Request a new note
C
A N
S L
I M
|
ULTA
-
NASDAQ
Ulta Salon Cosm & Frag
SPECIALTY RETAIL - Specialty Retail, Other
|
$37.94
|
+0.90
2.43% |
$38.76
|
571,576
95.71% of 50 DAV
50 DAV is 597,200
|
$38.25
-0.81%
|
1/6/2011
|
$36.12
|
PP = $37.34
|
|
MB = $39.21
|
Most Recent Note - 2/1/2011 11:30:01 AM
Y - Touched a new 52-week high today, but without great volume conviction thus far into the session. As previously noted - "Subsequent volume-driven gains above its pivot point would be a very reassuring sign. Its 50 DMA line defines important chart support to watch."
>>> The latest Featured Stock Update with an annotated graph appeared on 1/6/2011. Click here.
View all notes |
Alert me of new notes |
CANSLIM.net Company Profile |
SEC |
Zacks Reports |
StockTalk |
News |
Chart |
Request a new note
C
A N
S L
I M
|
|
|
|
THESE ARE NOT BUY RECOMMENDATIONS!
Comments contained in the body of this report are technical
opinions only. The material herein has been obtained
from sources believed to be reliable and accurate, however,
its accuracy and completeness cannot be guaranteed.
This site is not an investment advisor, hence it does
not endorse or recommend any securities or other investments.
Any recommendation contained in this report may not
be suitable for all investors and it is not to be deemed
an offer or solicitation on our part with respect to
the purchase or sale of any securities. All trademarks,
service marks and trade names appearing in this report
are the property of their respective owners, and are
likewise used for identification purposes only.
This report is a service available
only to active Paid Premium Members.
You may opt-out of receiving report notifications
at any time. Questions or comments may be submitted
by writing to Premium Membership Services 665 S.E. 10 Street, Suite 201 Deerfield Beach, FL 33441-5634 or by calling 1-800-965-8307
or 954-785-1121.
|
|
|

