You are not logged in.
This means you
CAN ONLY VIEW reports that were published prior to Monday, April 14, 2025.
You
MUST UPGRADE YOUR MEMBERSHIP if you want to see any current reports.
AFTER MARKET UPDATE - MONDAY, FEBRUARY 1ST, 2010
Previous After Market Report Next After Market Report >>>
|
|
|
|
DOW |
+118.20 |
10,185.53 |
+1.17% |
|
Volume |
1,037,323,160 |
-34% |
|
Volume |
2,270,782,700 |
-28% |
|
NASDAQ |
+23.85 |
2,171.20 |
+1.11% |
|
Advancers |
2,407 |
77% |
|
Advancers |
1,728 |
61% |
|
S&P 500 |
+15.32 |
1,089.19 |
+1.43% |
|
Decliners |
646 |
21% |
|
Decliners |
995 |
35% |
|
Russell 2000 |
+7.21 |
609.25 |
+1.20% |
|
52 Wk Highs |
52 |
|
|
52 Wk Highs |
28 |
|
|
S&P 600 |
+3.22 |
324.36 |
+1.00% |
|
52 Wk Lows |
6 |
|
|
52 Wk Lows |
13 |
|
|
 |
Major Averages Post Light Volume Gains As Dollar Falls
Adam Sarhan, Contributing Writer,
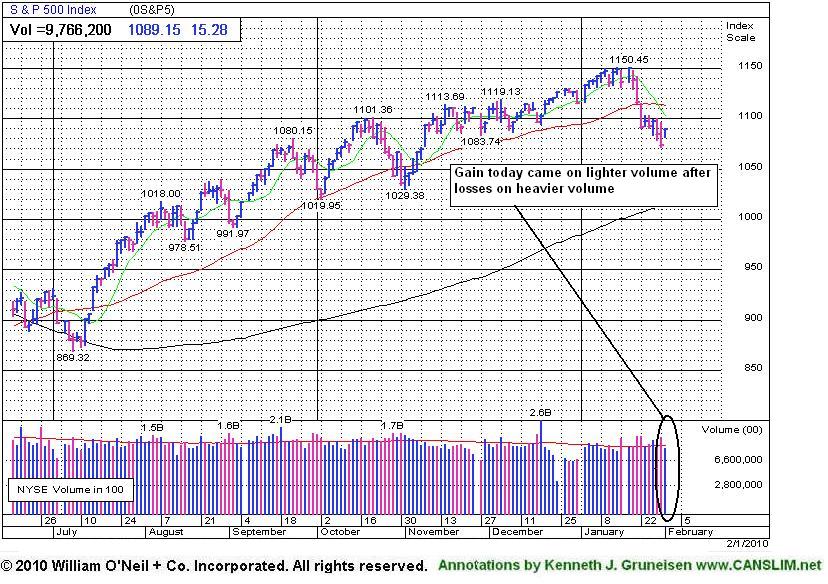
Stocks rallied on Monday continuing the recent string of a strong starts to the week before the bears show up and send stocks lower by Friday. Volume was lighter than the prior session on the Nasdaq exchange and on the NYSE which signaled large institutions were not aggressively buying stocks. Advancers led decliners by over a 3-to-1 ratio on the NYSE and by nearly a 2-to-1 ratio on the Nasdaq exchange. There were 7 high-ranked companies from the CANSLIM.net Leaders List that made a new 52-week high and appeared on the CANSLIM.net BreakOuts Page, lower than the 9 issues that appeared on the prior session. New 52-week highs still outnumbered new 52-week lows on the NYSE and on the Nasdaq exchange.
Stocks rebounded from a three-month low and marked Day 1 of a new rally attempt after a series of stronger than expected economic data points were released. Manufacturing reports in the US, Europe and China all showed that the global economic recovery is accelerating which helped allay concerns that the recovery was running out of steam. The US dollar fell which helped a slew of dollar denominated assets (mainly commodities, and also stocks) rally. The Institute for Supply Management said that US manufacturing enjoyed its largest gain since August 2004 which was a welcomed sign.
Exxon Mobil Corp (XOM +2.72%) gapped higher after the oil giant said earnings fell less than expected because of higher oil prices and output. So far, nearly 80% of the companies that have reported earnings have topped estimates in the fourth quarter which, barring some unforeseen event, will snap a record nine-quarter earnings slump for the S&P 500. Analysts believe that earnings grew +76% in the last three months of 2009 as the global economy continues to rebound from its worst recession since WWII!
Looking at the market, Monday marked Day 1 of a new rally attempt which means that as long as Monday's lows are not breached, the earliest a possible follow-through day could emerge will be this Thursday. However, if Monday's lows are taken out, then the day count will be reset and the chances for a steeper correction increase markedly. It is also important to see how the major averages react to their respective 50-day moving average (DMA) lines. Until they all close above that important level the technical damage remaining on the charts is a concern. So far, the market's reaction has been tepid at best to the latest round of economic and earnings data. Remember that the recent series of distribution days coupled with the deleterious action in the major averages suggests large institutions are aggressively selling stocks. Disciplined investors will now wait for a new follow-through day to be produced before resuming any buying efforts. Until then, patience is key.
Professional Money Management Services - A Winning System - Inquire today!
Our skilled team of portfolio managers knows how to follow the rules of this fact-based investment system. We do not follow opinion or the "conviction list" of some large Wall Street institution which would have us fully invested even during horrific bear markets. Instead, we remain fluid and only buy the best stocks when they are triggering proper technical buy signals. If you are not completely satisfied with the way your portfolio is being managed, Click here to submit your inquiry. *Accounts over $250,000 please. ** Serious inquires only, please.
PICTURED: The S&P 500 Index posted a gain on lighter volume, showing that a lack of buying demand coming from the institutional crowd persists.
|
|
|
 |
Gold & Silver Index Remains Under 200 DMA Line Following 8 Straight Losses
Kenneth J. Gruneisen - Passed the CAN SLIM® Master's Exam
Commodity-linked areas were standout gainers on Monday as the Gold & Silver Index ($XAU +5.54%) posted a big gain and the Oil Services Index ($OSX +3.61%) and Integrated Oil Index ($XOI +2.51%) surged higher. Tech shares also rallied, and the Semiconductor Index ($SOX +3.05%) rebounded sharply from the prior week's damage as the Networking Index ($NWX +2.09%), Internet Index ($IIX +1.26%), and Biotechnology Index ($BTK +1.27%) posted more modest gains. Financial shared helped to underpin the major averages' newest rally effort as the Broker/Dealer Index ($XBD +2.14%) and Bank Index ($BKX +1.42%) tacked on gains. The Retail Index ($RLX +0.31%) and Healthcare Index ($HMO +0.67%) also emerged from the session with small gains, rounding out a widely positive first session of February.
Charts courtesy www.stockcharts.com
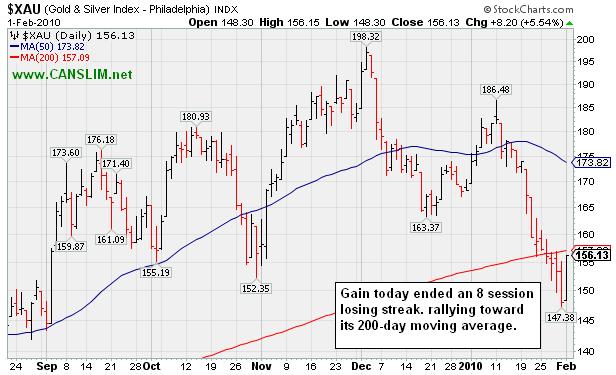
PICTURED: The Gold & Silver Index ($XAU +5.54%) ended an 8 session losing streak with a considerable gain today, rallying up toward its 200-day moving average (DMA) line. It that long-term average acts as resistance it generally would not bode well for stocks in the group of precious metal mining firms.
| Oil Services |
$OSX |
199.69 |
+6.95 |
+3.61% |
+2.45% |
| Healthcare |
$HMO |
1,461.30 |
+9.69 |
+0.67% |
-0.79% |
| Integrated Oil |
$XOI |
1,042.26 |
+25.48 |
+2.51% |
-2.43% |
| Semiconductor |
$SOX |
325.72 |
+9.65 |
+3.05% |
-9.50% |
| Networking |
$NWX |
226.12 |
+4.64 |
+2.09% |
-2.14% |
| Internet |
$IIX |
220.80 |
+2.74 |
+1.26% |
-5.58% |
| Broker/Dealer |
$XBD |
113.62 |
+2.38 |
+2.14% |
-1.24% |
| Retail |
$RLX |
398.73 |
+1.25 |
+0.31% |
-3.01% |
| Gold & Silver |
$XAU |
156.13 |
+8.20 |
+5.54% |
-7.20% |
| Bank |
$BKX |
47.20 |
+0.66 |
+1.42% |
+10.51% |
| Biotech |
$BTK |
976.58 |
+12.24 |
+1.27% |
+3.66% |
|
|
|
 |
Overhead Supply May Now Hinder Progress
Kenneth J. Gruneisen - Passed the CAN SLIM® Master's Exam
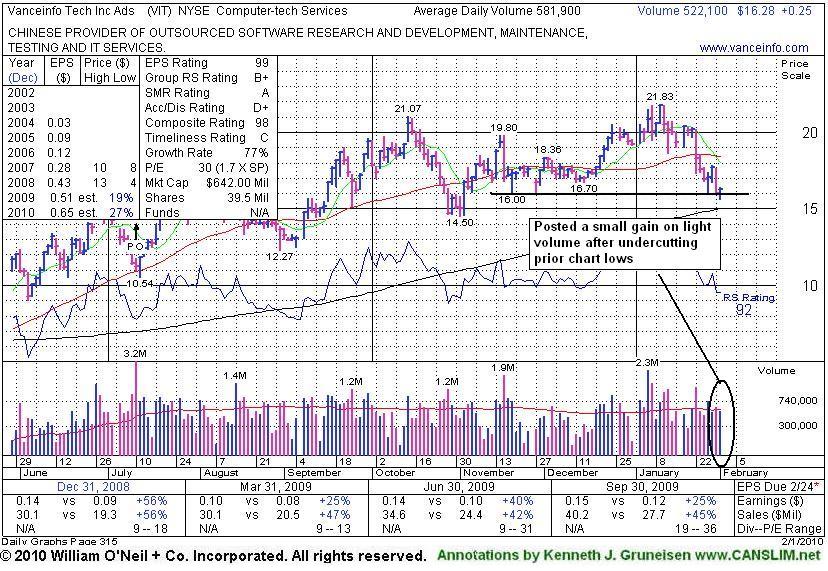
Vanceinfo Tech Inc Ads (VIT +$0.27 or +1.68% to $16.30) closed with a small gain today on lighter volume after intra-day weakness under the $16.00 level. The 1/22/10 violation of its 50-day moving average (DMA) line triggered a technical sell signal. Distributional pressure raised concerns as it abruptly reversed under its pivot point ($21.17 based on its October high plus ten cents) following its attempt to rally from a choppy 11-week base. A rebound back above its 50 DMA would be proof of institutional (I criteria) support and buying demand. However, based on trading at higher levels in recent months, overhead supply that exists is now more likely to act as resistance which could hinder its upward progress and limit the near-term upside. Market conditions (M criteria) also argue against new buying until a confirmed rally with follow-through day provides the reassurance of sufficient buying demand coming from the institutional crowd again.
The high-ranked Computer - Tech Services firm was featured in yellow in the 12/24/09 mid-day report (read here) while approaching all-time highs. It had come a long way in the past year, yet it had built a sufficient length base following its steep ascent from its March low ($4.31). Fundamentally, its earnings and sales revenues increases have been above or at the +25% minimum guideline. Its small supply of only 11.4 million shares (the S criteria) in the publicly traded float could be a factor leading to greater volatility, especially in the event of mutual funds accumulating or distributing (selling) shares. This heightens the need for caution when buying and the discipline to limit losses, as always, if any stock ever falls more than -7% from your buy price.
|
|
|
Color Codes Explained :
Y - Better candidates highlighted by our
staff of experts.
G - Previously featured
in past reports as yellow but may no longer be buyable under the
guidelines.
***Last / Change / Volume quote data in this table corresponds with the timestamp on the note***
Symbol/Exchange
Company Name
Industry Group |
Last |
Chg. |
Vol
% DAV |
Date Featured |
Price Featured |
Latest Pivot Point
Featured |
Status |
| Latest Max Buy Price |
ARST
-
|
$24.20
|
+0.45
|
196,319
39% DAV
507,100
|
12/22/2009
(Date
Featured) |
$25.94
(Price
Featured) |
PP = $27.20 |
G |
| MB = $28.56 |
Most Recent Note - 2/1/2010 5:01:00 PM
G - Today's gain on lighter volume followed 3 consecutive losses, and it remains below its 50 DMA line. Distributional pressure negated its latest breakout. ARST was first featured in yellow at $19.91 in the 9/01/09 mid-day report with an annotated daily graph (read here).
>>> The latest Featured Stock Update with an annotated graph appeared on 1/21/2010. click here.
|
|
C
A
S
I |
News |
Chart |
SEC
View all notes Alert
me of new notes
Company
Profile
|
BIDU
- NASDAQ
Baidu Inc Ads
INTERNET - Internet Information Providers
|
$425.68
|
+13.97
|
1,694,607
95% DAV
1,790,600
|
1/13/2010
(Date
Featured) |
$431.25
(Price
Featured) |
PP = $426.75 |
G |
| MB = $448.09 |
Most Recent Note - 2/1/2010 5:09:29 PM
G - Gain today on higher volume helped it close back above its 50 DMA line. Due to report earnings after the close on February 9th. Gaps down for considerable losses on 1/19 and 1/22 pressured it under its November '09 highs and violated its short-term average line, hurting its outlook after recently spiking to new all-time highs.
>>> The latest Featured Stock Update with an annotated graph appeared on 1/14/2010. click here.
|
|
C
A
S
I |
News |
Chart |
SEC
View all notes Alert
me of new notes
Company
Profile
|
CACC
- NASDAQ
Credit Acceptance Corp
FINANCIAL SERVICES - Credit Services
|
$53.18
|
-0.04
|
126,734
253% DAV
50,100
|
9/29/2009
(Date
Featured) |
$33.48
(Price
Featured) |
PP = $37.10 |
G |
| MB = $38.96 |
Most Recent Note - 2/1/2010 5:11:34 PM
G - Small loss today on heavier than average volume, churning near all-time highs, ending a streak of 5 straight gains. Extended from any sound base. Well above its 50 DMA line, an important support level to watch. On Monday Jan 25th the company announced the pricing of $250 Million Senior Secured Notes.
>>> The latest Featured Stock Update with an annotated graph appeared on 1/28/2010. click here.
|
|
C
A
S
I |
News |
Chart |
SEC
View all notes Alert
me of new notes
Company
Profile
|
CRM
- NYSE
Salesforce.com Inc
INTERNET - Internet Software & Services
|
$65.18
|
+1.63
|
1,406,702
73% DAV
1,938,500
|
12/18/2009
(Date
Featured) |
$67.32
(Price
Featured) |
PP = $67.82 |
G |
| MB = $71.21 |
Most Recent Note - 2/1/2010 5:13:30 PM
G - Posted a gain today after 3 consecutive losses, remaining below its 50 DMA line. It would need to rebound above that important short-term average for its outlook to improve.
>>> The latest Featured Stock Update with an annotated graph appeared on 1/27/2010. click here.
|
|
C
A
S
I |
News |
Chart |
SEC
View all notes Alert
me of new notes
Company
Profile
|
GMCR
- NASDAQ
Green Mtn Coffee Roastrs
FOOD & BEVERAGE - Processed & Packaged Goods
|
$84.41
|
-0.41
|
1,224,841
79% DAV
1,555,900
|
12/28/2009
(Date
Featured) |
$77.49
(Price
Featured) |
PP = $76.50 |
G |
| MB = $80.33 |
Most Recent Note - 2/1/2010 5:21:38 PM
G - Lost more ground today on lighter volume after the prior session's loss erased a large part of its 1/28/10 gain as it promptly slumped under prior chart highs. Recent chart lows in the $78 area are an important support level to watch now.
>>> The latest Featured Stock Update with an annotated graph appeared on 1/13/2010. click here.
|
|
C
A
S
I |
News |
Chart |
SEC
View all notes Alert
me of new notes
Company
Profile
|
ISRG
- NASDAQ
Intuitive Surgical Inc
HEALTH SERVICES - Medical Appliances & Equipment
|
$328.65
|
+0.59
|
480,001
94% DAV
509,100
|
1/22/2010
(Date
Featured) |
$340.40
(Price
Featured) |
PP = $314.00 |
Y |
| MB = $329.70 |
Most Recent Note - 2/1/2010 5:25:03 PM
Y - Gain today on lighter volume while consolidating just under its "max buy" level. ISRG was featured again most recently in the 1/22/10 mid-day report (read here), returning after some time off the Featured Stocks list. Its annual earnings history (the A criteria) has been very impressive. ISRG has rebounded impressively from its March low ($84.86) and may be on course for its all-time high ($359 in 2007). Notes outlined technical deterioration before and when it was last dropped from the Featured Stocks list on 6/10/08. ISRG traded up more than 13-fold since first featured in yellow in CANSLIM.net reports in the summer of 2004.
>>> The latest Featured Stock Update with an annotated graph appeared on 1/22/2010. click here.
|
|
C
A
S
I |
News |
Chart |
SEC
View all notes Alert
me of new notes
Company
Profile
|
LFT
-
|
$35.14
|
+0.48
|
425,676
78% DAV
548,900
|
11/17/2009
(Date
Featured) |
$31.77
(Price
Featured) |
PP = $33.04 |
G |
| MB = $34.69 |
Most Recent Note - 2/1/2010 5:27:39 PM
G - Small gain today following a gap down on 1/29/10 for a loss with very heavy volume. Still trading below its 50 DMA line. Recently probing its prior chart highs in the $31-33 area which define the next technical support level. Due to report earnings on Wednesday, February 10 after the market close. Widespread weakness in China-based issues has clearly been a factor in recent days.
>>> The latest Featured Stock Update with an annotated graph appeared on 1/26/2010. click here.
|
|
C
A
S
I |
News |
Chart |
SEC
View all notes Alert
me of new notes
Company
Profile
|
PEGA
- NASDAQ
Pegasystems Inc
COMPUTER SOFTWARE & SERVICES - Business Software & Services
|
$35.24
|
+1.99
|
329,998
190% DAV
173,800
|
1/4/2010
(Date
Featured) |
$34.00
(Price
Featured) |
PP = $36.19 |
G |
| MB = $38.00 |
Most Recent Note - 2/1/2010 5:30:20 PM
G - Rebounded considerably today after a steep pullback to support at its 50 DMA line as 2 big losses completely negated its 1/27/10 breakout. Its recent chart lows near $32.50 help define important technical support, where violations would trigger more worrisome sell signals. Negative market conditions (M criteria) are currently an overriding concern prompting great caution, since a follow-through day is still needed to confirm a new rally. After a hiatus from the Featured Stocks list, PEGA was featured again in the January 2010 issue of CANSLIM.net News (read here).
>>> The latest Featured Stock Update with an annotated graph appeared on 1/25/2010. click here.
|
|
C
A
S
I |
News |
Chart |
SEC
View all notes Alert
me of new notes
Company
Profile
|
VIT
-
|
$16.30
|
+0.27
|
525,463
N/A
|
12/24/2009
(Date
Featured) |
$20.07
(Price
Featured) |
PP = $21.17 |
G |
| MB = $22.23 |
Most Recent Note - 2/1/2010
Closed with a small gain today after intra-day weakness under the $16.00 level. The 1/22/10 violation of its 50 DMA line triggered a technical sell signal. Distributional pressure raised concerns as it abruptly reversed under its pivot point following its big 1/06/10 gain on heavy volume and 1/11/10 gain on +36% above average volume.
>>> The latest Featured Stock Update with an annotated graph appeared on 2/1/2010. click here.
|
|
C
A
S
I |
News |
Chart |
SEC
View all notes Alert
me of new notes
Company
Profile
|
|
|
|
THESE ARE NOT BUY RECOMMENDATIONS!
Comments contained in the body of this report are technical
opinions only. The material herein has been obtained
from sources believed to be reliable and accurate, however,
its accuracy and completeness cannot be guaranteed.
This site is not an investment advisor, hence it does
not endorse or recommend any securities or other investments.
Any recommendation contained in this report may not
be suitable for all investors and it is not to be deemed
an offer or solicitation on our part with respect to
the purchase or sale of any securities. All trademarks,
service marks and trade names appearing in this report
are the property of their respective owners, and are
likewise used for identification purposes only.
This report is a service available
only to active Paid Premium Members.
You may opt-out of receiving report notifications
at any time. Questions or comments may be submitted
by writing to Premium Membership Services 665 S.E. 10 Street, Suite 201 Deerfield Beach, FL 33441-5634 or by calling 1-800-965-8307
or 954-785-1121.
|
|
|


