You are not logged in.
This means you
CAN ONLY VIEW reports that were published prior to Monday, April 14, 2025.
You
MUST UPGRADE YOUR MEMBERSHIP if you want to see any current reports.
AFTER MARKET UPDATE - THURSDAY, JANUARY 31ST, 2013
Previous After Market Report Next After Market Report >>>
|
|
|
|
DOW |
-49.84 |
13,860.58 |
-0.36% |
|
Volume |
933,186,850 |
+32% |
|
Volume |
2,114,884,090 |
+9% |
|
NASDAQ |
-0.18 |
3,142.13 |
-0.01% |
|
Advancers |
1,557 |
50% |
|
Advancers |
1,525 |
59% |
|
S&P 500 |
-3.85 |
1,498.11 |
-0.26% |
|
Decliners |
1,421 |
46% |
|
Decliners |
946 |
37% |
|
Russell 2000 |
+5.18 |
902.09 |
+0.58% |
|
52 Wk Highs |
191 |
|
|
52 Wk Highs |
125 |
|
|
S&P 600 |
+1.68 |
503.84 |
+0.33% |
|
52 Wk Lows |
13 |
|
|
52 Wk Lows |
26 |
|
|
 |
Major Averages Posted Large Gains For January
Kenneth J. Gruneisen - Passed the CAN SLIM® Master's Exam
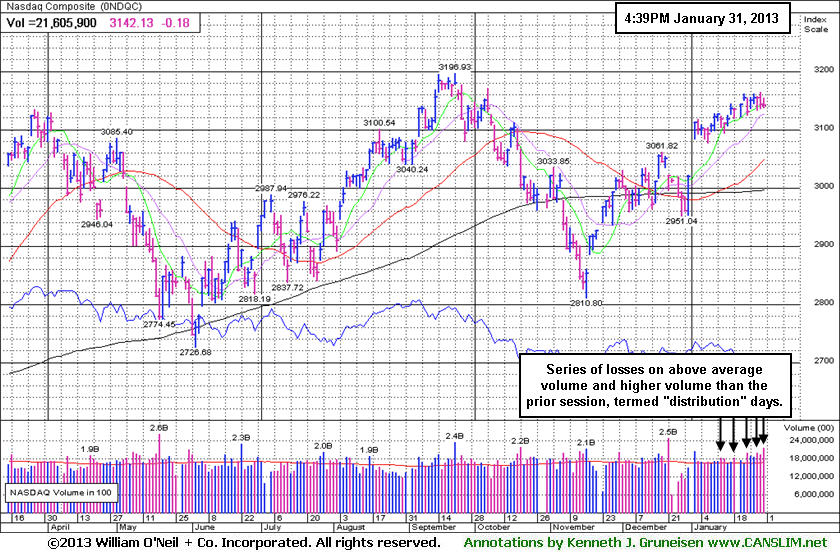
For the month of January, the Dow Jones Industrial Average gained +5.8%, the S&P 500 Index added +5.1%, and the Nasdaq Composite Index advanced +4.1%. The major averages ended slightly lower on Thursday. The volume totals were reported higher on the NYSE and on the Nasdaq exchange, indicating more "distribution" or selling pressure from the institutional crowd. Breadth was slightly positive as advancers led decliners narrowly on the NYSE and advancers led decliners by a 3-2 margin on the Nasdaq exchange. The total number of stocks hitting new 52-week highs still easily outnumbered new 52-week lows on the NYSE and on the Nasdaq exchange. There were 47 high-ranked companies from the CANSLIM.net Leaders List making new 52-week highs and appearing on the CANSLIM.net BreakOuts Page, down from the prior session total of 61 stocks. There were gains for 9 of the 11 high-ranked companies currently included on the Featured Stocks Page.
Stocks edged lower as investors respond to a batch of mixed economic data. Weekly jobless claims disappointed, rising more than expected to 368,000. December personal incomes increased +2.6%, while personal spending edged higher by +0.2%. Separately, Chicago PMI topped estimates with the index rising to 55.6.
Seven of the 10 sectors on the S&P were lower, led by declines in consumer stocks. Brewer Anheuser-Busch InBev SA/NV (BUD -5.88%) fell after the Department of Justice blocked their $20 billion acquisition of Grupo Modelo. Also in the space, Constellation Brands Inc (STZ -17.39%) fell on concerns that the DoJ's action could impede their planned deal with Crown Imports. On the earnings front, Whirlpool Corp (WHR +6.13%) rose following the appliance maker's better-than-projected profit tally. Qualcomm Inc (QCOM +3.92%) and Dunkin Brands Group Inc (DNKN +2.04%) also rallied on better-than-expected earnings news. Facebook Inc (FB -0.83%) shares gapped down yet rebounded to finish near the session high with a small loss after the company fell short of analysts' expectations in the quarter, reporting a -79% decline in profits on higher expenses. Shares of United Parcel Service Inc (UPS -2.34%) also fell following their fourth-quarter profit tally.
The latest rally has produced a few action worthy candidates meeting all of the fact-based investment system's criteria. Selectivity and discipline are required, as always. Investors may consider new buying efforts in stocks meeting all key criteria, as the market's (M criteria) confirmed uptrend has been comprised by great leadership (stocks hitting new 52-week highs) in the broader market. Widespread gains helped all of the major averages blast higher, and the benchmark S&P 500 Index is perched at its best level in more than five years.
Watch for an announcement via email concerning the next WEBCAST. The webcast will also be available via an updated link highlighted at the top of the Premium Member Homepage.
PICTURED: The Nasdaq Composite Index has logged a series of losses with above average and higher volume than the prior session, termed "distribution" days. Such a cluster of distribution days can bode poorly for the market, as it indicates that the institutional crowd is unloading shares rather than accumulating shares.
|
 Kenneth J. Gruneisen started out as a licensed stockbroker in August 1987, a couple of months prior to the historic stock market crash that took the Dow Jones Industrial Average down -22.6% in a single day. He has published daily fact-based fundamental and technical analysis on high-ranked stocks online for two decades. Through FACTBASEDINVESTING.COM, Kenneth provides educational articles, news, market commentary, and other information regarding proven investment systems that work in good times and bad.
Comments contained in the body of this report are technical opinions only and are not necessarily those of Gruneisen Growth Corp. The material herein has been obtained from sources believed to be reliable and accurate, however, its accuracy and completeness cannot be guaranteed. Our firm, employees, and customers may effect transactions, including transactions contrary to any recommendation herein, or have positions in the securities mentioned herein or options with respect thereto. Any recommendation contained in this report may not be suitable for all investors and it is not to be deemed an offer or solicitation on our part with respect to the purchase or sale of any securities. |
|
 |
Networking Index a Standout Amid Mixed Group Action
Kenneth J. Gruneisen - Passed the CAN SLIM® Master's Exam
Defensive groups has a slightly negative bias as the Gold & Silver Index ($XAU -0.84%) and Healthcare Index ($HMO -0.25%) edged lower. Energy-related shares were mixed, with the Oil Services Index ($OSX +0.65%) posting a modest gain while the Integrated Oil Index ($XOI -0.78%) fell. Weakness in the Retail Index ($RLX -0.67%) was a negative influence on the major averages. Financial shares were mixed as the Bank Index ($BKX -0.20%) edged lower while the Broker/Dealer Index ($XBD +0.47%) posted a small gain. The Internet Index ($IIX +0.27%) and Biotechnology Index ($BTK +0.40%) posted small gains while the Semiconductor Index ($SOX -0.33%) finished with a small loss.
Charts courtesy www.stockcharts.com
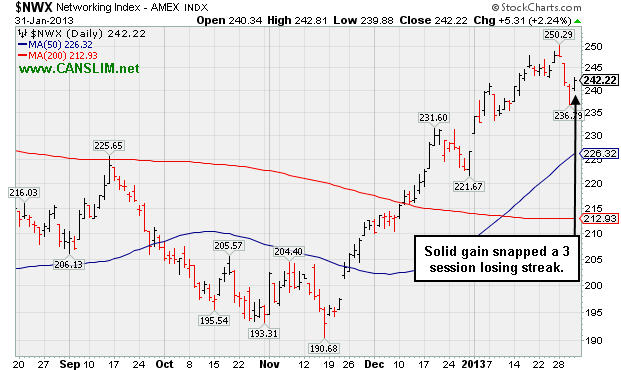
PICTURED: The Networking Index ($NWX +2.24%) was a standout gainer on Thursday as a solid gain snapped a 3-session losing streak retreating from its high.
| Oil Services |
$OSX |
247.66 |
+1.61 |
+0.65% |
+12.49% |
| Healthcare |
$HMO |
2,663.48 |
-6.69 |
-0.25% |
+5.94% |
| Integrated Oil |
$XOI |
1,352.77 |
-10.69 |
-0.78% |
+8.93% |
| Semiconductor |
$SOX |
412.73 |
-1.37 |
-0.33% |
+7.46% |
| Networking |
$NWX |
242.22 |
+5.31 |
+2.24% |
+6.92% |
| Internet |
$IIX |
352.73 |
+0.95 |
+0.27% |
+7.87% |
| Broker/Dealer |
$XBD |
104.89 |
+0.50 |
+0.47% |
+11.20% |
| Retail |
$RLX |
698.13 |
-4.73 |
-0.67% |
+6.90% |
| Gold & Silver |
$XAU |
149.68 |
-1.27 |
-0.84% |
-9.61% |
| Bank |
$BKX |
53.83 |
-0.11 |
-0.20% |
+4.97% |
| Biotech |
$BTK |
1,661.17 |
+6.65 |
+0.40% |
+7.38% |
|
|
|
 |
Found Support Above 50-Day Moving Average But Relative Strength Has Been Waning
Kenneth J. Gruneisen - Passed the CAN SLIM® Master's Exam
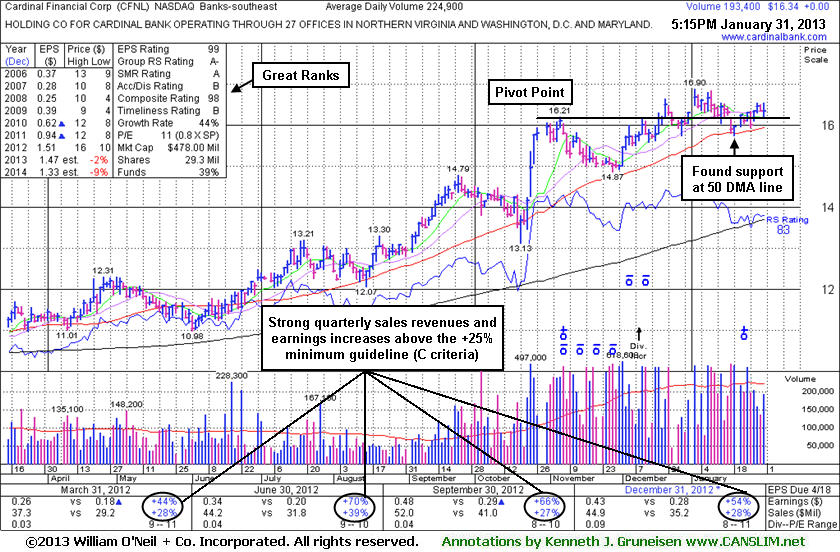
Cardinal Financial Corp's (CFNL $16.34) has been consolidating in a tight range above support at its 50-day moving average (DMA) line and trading just above its pivot point. It did not ever trade above its "max buy" level after the rally above its pivot point on 1/02/13 with +72% above average volume triggered a technical buy signal. Subsequent losses leading to a damaging violation and a slump below the 50 DMA and below the recent low ($15.74 on 1/18/13) would raise more serious concerns and trigger technical sell signals. Its 83 Relative Strength Rating remains above the 80+ minimum for buy candidates, however that rank has been slumping since last shown in this FSU section on 1/15/13 with an annotated graph under the headline, " Consolidating Above Support Following Breakout Gain".
The high-ranked leader hailing from the Banks - Southeast industry group reported earnings +54% on +28% sales revenues for the quarter ended December 31, 2012 versus the year ago period, continuing its track record of strong quarterly earnings comparisons underpinned by encouraging sales revenues increases. It has earned the highest possible 99 Earnings Per Share (EPS) rank, and its high ranks and long term earnings history help it match favorably with the C and A criteria. The number of top-rated funds owning its shares rose from 172 in Sep '11 to 196 in Dec '12, a reassuring trend concerning the I criteria. Its small supply (S criteria) of only 29.3 millions shares outstanding is a favorable characteristic, yet it can contribute to greater price volatility in the event of institutional accumulation or distributional pressure.
|
|
|
Color Codes Explained :
Y - Better candidates highlighted by our
staff of experts.
G - Previously featured
in past reports as yellow but may no longer be buyable under the
guidelines.
***Last / Change / Volume data in this table is the closing quote data***
Symbol/Exchange
Company Name
Industry Group |
PRICE |
CHANGE
(%Change) |
Day High |
Volume
(% DAV)
(% 50 day avg vol) |
52 Wk Hi
% From Hi |
Featured
Date |
Price
Featured |
Pivot Featured |
|
Max Buy |
CELG
-
NASDAQ
Celgene Corp
DRUGS - Drug Manufacturers - Major
|
$98.96
|
+0.49
0.50% |
$99.57
|
2,908,221
79.77% of 50 DAV
50 DAV is 3,645,800
|
$100.12
-1.16%
|
12/11/2012
|
$82.24
|
PP = $81.34
|
|
MB = $85.41
|
Most Recent Note - 1/30/2013 2:09:49 PM
G - Volume totals have been cooling while hovering in a tight range near its all-time high, very extended from its prior base. See the recent Featured Stock Update (FSU) analysis for the latest annotated graph and more details under the headline, "Rule Suggests Letting Explosive Winners Have Time For Greater Gains - Thursday, January 17, 2013 ".
>>> The latest Featured Stock Update with an annotated graph appeared on 1/17/2013. Click here.
View all notes |
Alert me of new notes |
CANSLIM.net Company Profile |
SEC |
Zacks Reports |
StockTalk |
News |
Chart |
Request a new note
C
A N
S L
I M


|
CFNL
-
NASDAQ
Cardinal Financial Corp
BANKING - Regional - Southeast Banks
|
$16.34
|
+0.00
0.00% |
$16.55
|
195,829
87.07% of 50 DAV
50 DAV is 224,900
|
$16.90
-3.31%
|
12/3/2012
|
$15.20
|
PP = $16.31
|
|
MB = $17.13
|
 Most Recent Note - 1/31/2013 5:37:58 PM
Y - Quietly consolidating above support at its 50 DMA line and trading just above its pivot point. Subsequent losses leading to a damaging violation and a slump below the recent low ($15.74 on 1/18/13) would raise concerns and trigger technical sell signals. See the latest FSU analysis for more details and a new annotated graph.
>>> The latest Featured Stock Update with an annotated graph appeared on 1/31/2013. Click here.
View all notes |
Alert me of new notes |
CANSLIM.net Company Profile |
SEC |
Zacks Reports |
StockTalk |
News |
Chart |
Request a new note
C
A N
S L
I M
|
CMCSA
-
NASDAQ
Comcast Corp Cl A
MEDIA - CATV Systems
|
$38.08
|
-0.95
-2.43% |
$38.93
|
25,014,722
222.98% of 50 DAV
50 DAV is 11,218,500
|
$40.28
-5.46%
|
12/3/2012
|
$37.08
|
PP = $38.06
|
|
MB = $39.96
|
Most Recent Note - 1/31/2013 12:05:25 PM
Y - Encountering recent distributional pressure and today's 4th consecutive loss has it retreating near prior highs and its 50 DMA line defining important chart support. Subsequent violations may trigger technical sell signals.
>>> The latest Featured Stock Update with an annotated graph appeared on 1/29/2013. Click here.
View all notes |
Alert me of new notes |
CANSLIM.net Company Profile |
SEC |
Zacks Reports |
StockTalk |
News |
Chart |
Request a new note
C
A N
S L
I M
|
KORS
-
NYSE
Michael Kors Hldgs Ltd
RETAIL - Apparel Stores
|
$56.13
|
-0.19
-0.34% |
$56.94
|
3,214,479
94.15% of 50 DAV
50 DAV is 3,414,300
|
$60.00
-6.45%
|
1/23/2013
|
$54.98
|
PP = $58.72
|
|
MB = $61.66
|
Most Recent Note - 1/30/2013 2:08:03 PM
Y - Hovering near its high since a "negative reversal" after touching a new 52-week high on 1/28/13, and it recently tallied gains with ever-increasing volume as it approached its 52-week high and pivot point. Disciplined investors may watch for volume-driven gains above the pivot point to trigger a proper technical buy signal before taking action. See the latest FSU analysis under the headline, "High-Ranked Luxury Apparel Firm Worthy For Watchlist - Wednesday, January 23, 2013", for more details and an annotated weekly graph.
>>> The latest Featured Stock Update with an annotated graph appeared on 1/23/2013. Click here.
View all notes |
Alert me of new notes |
CANSLIM.net Company Profile |
SEC |
Zacks Reports |
StockTalk |
News |
Chart |
Request a new note
C
A N
S L
I M
|
MIDD
-
NASDAQ
Middleby Corp
MANUFACTURING - Diversified Machinery
|
$141.36
|
+0.75
0.53% |
$143.34
|
61,947
72.54% of 50 DAV
50 DAV is 85,400
|
$144.71
-2.31%
|
10/8/2012
|
$118.46
|
PP = $122.67
|
|
MB = $128.80
|
Most Recent Note - 1/30/2013 5:57:49 PM
G - Pulled back from all-time highs today after getting extended from any sound base. See the latest FSU analysis for more details and a new annotated graph.
>>> The latest Featured Stock Update with an annotated graph appeared on 1/30/2013. Click here.
View all notes |
Alert me of new notes |
CANSLIM.net Company Profile |
SEC |
Zacks Reports |
StockTalk |
News |
Chart |
Request a new note
C
A N
S L
I M
|
Symbol/Exchange
Company Name
Industry Group |
PRICE |
CHANGE
(%Change) |
Day High |
Volume
(% DAV)
(% 50 day avg vol) |
52 Wk Hi
% From Hi |
Featured
Date |
Price
Featured |
Pivot Featured |
|
Max Buy |
N
-
NYSE
Netsuite Inc
DIVERSIFIED SERVICES - Business/Management Services
|
$70.23
|
+1.28
1.86% |
$70.63
|
499,310
147.68% of 50 DAV
50 DAV is 338,100
|
$71.51
-1.79%
|
12/12/2012
|
$64.75
|
PP = $67.12
|
|
MB = $70.48
|
Most Recent Note - 1/31/2013 5:42:43 PM
G - Gain today with +48% above average volume lifted it near its "max buy" level and gave investors a reassuring hint that institutional buying demand is lurking.
>>> The latest Featured Stock Update with an annotated graph appeared on 1/18/2013. Click here.
View all notes |
Alert me of new notes |
CANSLIM.net Company Profile |
SEC |
Zacks Reports |
StockTalk |
News |
Chart |
Request a new note
C
A N
S L
I M
|
NP
-
NYSE
Neenah Paper Inc
CONSUMER NON-DURABLES - Paper and Paper Products
|
$30.94
|
+0.83
2.76% |
$31.26
|
108,027
143.46% of 50 DAV
50 DAV is 75,300
|
$32.57
-5.00%
|
1/25/2013
|
$31.80
|
PP = $31.76
|
|
MB = $33.35
|
Most Recent Note - 1/31/2013 11:36:01 AM
Y - Rebounding back toward its pivot point today following a spurt of volume-driven losses. A "negative reversal" for a loss on heavy volume after hitting a new 52-week high on 1/25/13 was noted as a worrisome sign of distributional pressure as it failed to finish strong and did not clinch a technical buy signal.
>>> The latest Featured Stock Update with an annotated graph appeared on 1/25/2013. Click here.
View all notes |
Alert me of new notes |
CANSLIM.net Company Profile |
SEC |
Zacks Reports |
StockTalk |
News |
Chart |
Request a new note
C
A N
S L
I M
|
NSR
-
NYSE
Neustar Inc
TELECOMMUNICATIONS - Diversified Communication Serv
|
$45.14
|
+0.14
0.31% |
$45.88
|
568,114
141.36% of 50 DAV
50 DAV is 401,900
|
$45.49
-0.77%
|
12/11/2012
|
$41.85
|
PP = $41.41
|
|
MB = $43.48
|
Most Recent Note - 1/30/2013 2:14:39 PM
G - Perched near its 52-week high today and poised for a best-ever close while on track for a 6th consecutive small gain. Its 50 DMA line defines near-term support.
>>> The latest Featured Stock Update with an annotated graph appeared on 1/16/2013. Click here.
View all notes |
Alert me of new notes |
CANSLIM.net Company Profile |
SEC |
Zacks Reports |
StockTalk |
News |
Chart |
Request a new note
C
A N
S L
I M
|
RAX
-
NYSE
Rackspace Hosting Inc
INTERNET - Internet Software and; Services
|
$75.35
|
+0.99
1.33% |
$75.60
|
1,012,466
88.38% of 50 DAV
50 DAV is 1,145,600
|
$81.36
-7.39%
|
12/18/2012
|
$71.88
|
PP = $70.10
|
|
MB = $73.61
|
Most Recent Note - 1/29/2013 12:40:35 PM
G - Its 50 DMA line (now $71.79) defines near-term support to watch while consolidating after recent gains. Gapped down today for a loss on higher volume indicating distributional pressure while retreating from the new all-time high hit last week with a volume-driven gain. Last noted on 1/24/13 with caution - "It is extended from the previously noted base. Company will announce its fourth quarter 2012 financial results on Tuesday, February 12, 2013 after the close."
>>> The latest Featured Stock Update with an annotated graph appeared on 1/22/2013. Click here.
View all notes |
Alert me of new notes |
CANSLIM.net Company Profile |
SEC |
Zacks Reports |
StockTalk |
News |
Chart |
Request a new note
C
A N
S L
I M
|
RNF
-
NYSE
Rentech Nitrogen Ptnr Lp
CHEMICALS - Agricultural Chemicals
|
$48.28
|
+0.10
0.21% |
$48.66
|
304,807
100.30% of 50 DAV
50 DAV is 303,900
|
$48.80
-1.07%
|
11/1/2012
|
$39.11
|
PP = $40.15
|
|
MB = $42.16
|
Most Recent Note - 1/30/2013 2:04:03 PM
G - Wedging higher today with lackluster volume behind its gain while inching further into new 52-week high territory. Extended from its prior base, its prior highs and 50 DMA line coincide in the $40 area defining important chart support.
>>> The latest Featured Stock Update with an annotated graph appeared on 1/24/2013. Click here.
View all notes |
Alert me of new notes |
CANSLIM.net Company Profile |
SEC |
Zacks Reports |
StockTalk |
News |
Chart |
Request a new note
C
A N
S L
I M
|
Symbol/Exchange
Company Name
Industry Group |
PRICE |
CHANGE
(%Change) |
Day High |
Volume
(% DAV)
(% 50 day avg vol) |
52 Wk Hi
% From Hi |
Featured
Date |
Price
Featured |
Pivot Featured |
|
Max Buy |
VRX
-
NYSE
Valeant Pharmaceuticals
DRUGS - Drug Manufacturers - Other
|
$66.32
|
+0.15
0.23% |
$66.63
|
1,276,202
83.29% of 50 DAV
50 DAV is 1,532,200
|
$67.13
-1.21%
|
12/20/2012
|
$60.24
|
PP = $61.21
|
|
MB = $64.27
|
Most Recent Note - 1/30/2013 2:05:33 PM
G - It is extended from a sound base and perched at its high today. Recently rallying further above its "max buy" level to new 52-week highs without great volume conviction behind its gains.
>>> The latest Featured Stock Update with an annotated graph appeared on 1/28/2013. Click here.
View all notes |
Alert me of new notes |
CANSLIM.net Company Profile |
SEC |
Zacks Reports |
StockTalk |
News |
Chart |
Request a new note
C
A N
S L
I M
|
|
|
|
THESE ARE NOT BUY RECOMMENDATIONS!
Comments contained in the body of this report are technical
opinions only. The material herein has been obtained
from sources believed to be reliable and accurate, however,
its accuracy and completeness cannot be guaranteed.
This site is not an investment advisor, hence it does
not endorse or recommend any securities or other investments.
Any recommendation contained in this report may not
be suitable for all investors and it is not to be deemed
an offer or solicitation on our part with respect to
the purchase or sale of any securities. All trademarks,
service marks and trade names appearing in this report
are the property of their respective owners, and are
likewise used for identification purposes only.
This report is a service available
only to active Paid Premium Members.
You may opt-out of receiving report notifications
at any time. Questions or comments may be submitted
by writing to Premium Membership Services 665 S.E. 10 Street, Suite 201 Deerfield Beach, FL 33441-5634 or by calling 1-800-965-8307
or 954-785-1121.
|
|
|

