***Last / Change / Volume data in this table is the closing quote data***
Symbol/Exchange
Company Name
Industry Group |
PRICE |
CHANGE
(%Change) |
Day High |
Volume
(% DAV)
(% 50 day avg vol) |
52 Wk Hi
% From Hi |
Featured
Date |
Price
Featured |
Pivot Featured |
|
Max Buy |
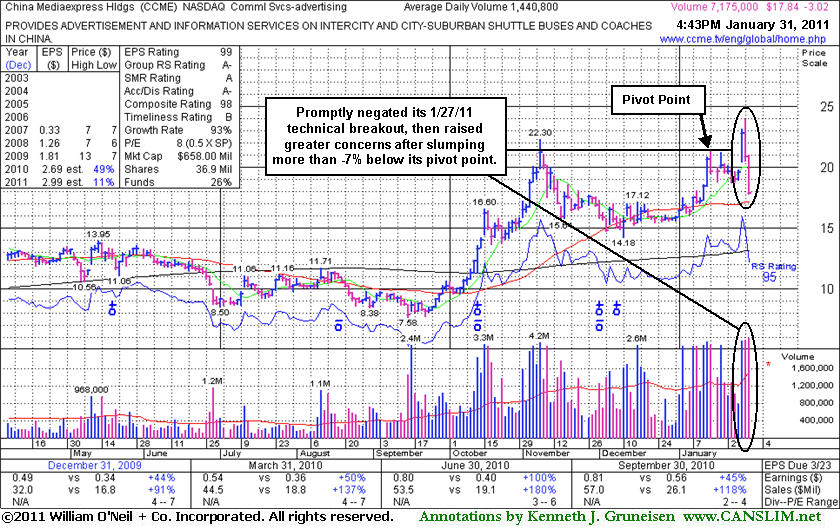
CCME
-
NASDAQ
China Mediaexpress Hldgs
FINANCIAL SERVICES - Diversified Investments
|
$17.84
|
-3.02
-14.48% |
$21.02
|
7,346,181
541.59% of 50 DAV
50 DAV is 1,356,400
|
$23.97
-25.57%
|
1/27/2011
|
$22.37
|
PP = $21.50
|
|
MB = $22.58
|
 Most Recent Note - 1/31/2011 5:06:12 PM
G - It violated recent chart lows and closed near the session low with a second consecutive loss on heavy volume triggering a technical sell signal. Its color code was changed to green when early weakness raised greater concerns. A negative reversal at its 52-week high on higher volume led to a close below its pivot point on Friday as it promptly negated its 1/27/11 technical breakout from a cup-with-handle type base. Healthy stocks should not pull back more than -7% below their pivot point. See the latest FSU analysis for more details and a new annotated graph.
>>> The latest Featured Stock Update with an annotated graph appeared on 1/31/2011. Click here.
View all notes |
Alert me of new notes |
CANSLIM.net Company Profile |
SEC |
Zacks Reports |
StockTalk |
News |
Chart |
Request a new note
C
A N
S L
I M


|
CIS
-
NYSE
Camelot Info Systems Ads
COMPUTER SOFTWARE andamp; SERVICES - Information Technology Service
|
$22.40
|
-1.68
-6.98% |
$23.62
|
771,624
160.52% of 50 DAV
50 DAV is 480,700
|
$28.18
-20.51%
|
11/26/2010
|
$18.93
|
PP = $19.72
|
|
MB = $20.71
|
Most Recent Note - 1/31/2011 5:23:59 PM
G - Gapped down today and closed below its 50 DMA line in the lower half of its intra-day range with a considerable loss on above average volume, triggering a technical sell signal. Based on technical damage it will be dropped from the Featured Stocks list tonight.
>>> The latest Featured Stock Update with an annotated graph appeared on 1/11/2011. Click here.
View all notes |
Alert me of new notes |
CANSLIM.net Company Profile |
SEC |
Zacks Reports |
StockTalk |
News |
Chart |
Request a new note
C
A N
S L
I M
|
CRUS
-
NASDAQ
Cirrus Logic Inc
ELECTRONICS - Semiconductor - Specialized
|
$21.03
|
+0.31
1.50% |
$21.25
|
3,998,082
121.97% of 50 DAV
50 DAV is 3,278,000
|
$21.72
-3.18%
|
1/28/2011
|
$20.69
|
PP = $19.17
|
|
MB = $20.13
|
Most Recent Note - 1/31/2011 6:23:41 PM
G - Holding its ground after a considerable breakout gain on 1/27/11 helped it technically break out from a bullish reverse-head-and-shoulders type pattern. Color code is changed to green, meanwhile patient investors may look to accumulate shares on light volume pullbacks toward support at prior chart highs in the $19 area
>>> The latest Featured Stock Update with an annotated graph appeared on 1/28/2011. Click here.
View all notes |
Alert me of new notes |
CANSLIM.net Company Profile |
SEC |
Zacks Reports |
StockTalk |
News |
Chart |
Request a new note
C
A N
S L
I M
|
DECK
-
NASDAQ
Deckers Outdoor Corp
CONSUMER NON-DURABLES - Textile - Apparel Footwear
|
$73.39
|
-1.02
-1.37% |
$74.56
|
1,142,462
59.63% of 50 DAV
50 DAV is 1,915,900
|
$87.88
-16.49%
|
10/27/2010
|
$54.16
|
PP = $54.86
|
|
MB = $57.60
|
Most Recent Note - 1/28/2011 4:35:57 PM
G - Consolidating quietly below its 50 DMA line, and that short term average may now act as resistance. See the latest FSU article for detailed analysis and an annotated graph.
>>> The latest Featured Stock Update with an annotated graph appeared on 1/26/2011. Click here.
View all notes |
Alert me of new notes |
CANSLIM.net Company Profile |
SEC |
Zacks Reports |
StockTalk |
News |
Chart |
Request a new note
C
A N
S L
I M
|
EZCH
-
NASDAQ
Ezchip Semiconductor Ltd
ELECTRONICS - Semiconductor - Specialized
|
$29.75
|
-0.17
-0.57% |
$29.90
|
307,849
104.39% of 50 DAV
50 DAV is 294,900
|
$33.20
-10.39%
|
12/2/2010
|
$27.53
|
PP = $26.00
|
|
MB = $27.30
|
Most Recent Note - 1/28/2011 4:37:58 PM
G - Enduring minor distributional pressure today while consolidating above prior chart highs in the $29 area which define initial support to watch well above its 50 DMA line. It is not near a sound base.
>>> The latest Featured Stock Update with an annotated graph appeared on 1/21/2011. Click here.
View all notes |
Alert me of new notes |
CANSLIM.net Company Profile |
SEC |
Zacks Reports |
StockTalk |
News |
Chart |
Request a new note
C
A N
S L
I M
|
Symbol/Exchange
Company Name
Industry Group |
PRICE |
CHANGE
(%Change) |
Day High |
Volume
(% DAV)
(% 50 day avg vol) |
52 Wk Hi
% From Hi |
Featured
Date |
Price
Featured |
Pivot Featured |
|
Max Buy |
EZPW
-
NASDAQ
Ezcorp Inc Cl A
SPECIALTY RETAIL - Specialty Retail, Other
|
$26.90
|
-0.32
-1.18% |
$27.46
|
393,361
95.62% of 50 DAV
50 DAV is 411,400
|
$29.94
-10.15%
|
11/5/2010
|
$24.02
|
PP = $23.85
|
|
MB = $25.04
|
Most Recent Note - 1/28/2011 4:40:36 PM
G - Finished near the session low with a considerable loss on average volume, closing near its 50 DMA line. That short-term average recently acted as support, but it is not near any sound base.
>>> The latest Featured Stock Update with an annotated graph appeared on 12/29/2010. Click here.
View all notes |
Alert me of new notes |
CANSLIM.net Company Profile |
SEC |
Zacks Reports |
StockTalk |
News |
Chart |
Request a new note
C
A N
S L
I M
|
FOSL
-
NASDAQ
Fossil Inc
CONSUMER DURABLES - Recreational Goods, Other
|
$71.05
|
+1.09
1.56% |
$71.52
|
471,325
64.66% of 50 DAV
50 DAV is 728,900
|
$74.34
-4.43%
|
11/26/2010
|
$69.10
|
PP = $70.17
|
|
MB = $73.68
|
Most Recent Note - 1/28/2011 4:45:09 PM
G - Quietly consolidating near its 50 DMA line which acted as resistance this week while building an orderly flat base. A subsequent violation of its recent chart low ($66.05 on 1/25/11) would raise greater concerns and trigger an additional sell signal.
>>> The latest Featured Stock Update with an annotated graph appeared on 1/12/2011. Click here.
View all notes |
Alert me of new notes |
CANSLIM.net Company Profile |
SEC |
Zacks Reports |
StockTalk |
News |
Chart |
Request a new note
C
A N
S L
I M
|
HMSY
-
NASDAQ
H M S Holdings Corp
COMPUTER SOFTWARE and SERVICES - Healthcare Information Service
|
$64.34
|
-0.42
-0.65% |
$65.09
|
116,443
79.16% of 50 DAV
50 DAV is 147,100
|
$67.42
-4.57%
|
11/19/2010
|
$61.89
|
PP = $63.01
|
|
MB = $66.16
|
Most Recent Note - 1/28/2011 4:47:39 PM
G - Touched a new high this week but ended by slumping with above average volume near support at its 50 DMA line. Building a base-on-base type pattern, its waning Relative Strength rank (now 75) has been noted as a concern.
>>> The latest Featured Stock Update with an annotated graph appeared on 1/3/2011. Click here.
View all notes |
Alert me of new notes |
CANSLIM.net Company Profile |
SEC |
Zacks Reports |
StockTalk |
News |
Chart |
Request a new note
C
A N
S L
I M
|
JOBS
-
NASDAQ
Fifty One Job Inc Ads
DIVERSIFIED SERVICES - Staffing and; Outsourcing Service
|
$54.01
|
+0.51
0.95% |
$55.16
|
94,039
64.06% of 50 DAV
50 DAV is 146,800
|
$61.28
-11.86%
|
10/13/2010
|
$42.07
|
PP = $40.60
|
|
MB = $42.63
|
Most Recent Note - 1/28/2011 4:49:20 PM
G - Slumped today with lighter than average volume to just below prior chart highs. Its 50 DMA line defines support, while more damaging losses would raise concerns and trigger a technical sell signal.
>>> The latest Featured Stock Update with an annotated graph appeared on 12/30/2010. Click here.
View all notes |
Alert me of new notes |
CANSLIM.net Company Profile |
SEC |
Zacks Reports |
StockTalk |
News |
Chart |
Request a new note
C
A N
S L
I M
|
LULU
-
NASDAQ
Lululemon Athletica
MANUFACTURING - Textile Manufacturing
|
$68.68
|
+0.07
0.10% |
$69.69
|
791,007
38.74% of 50 DAV
50 DAV is 2,041,600
|
$74.60
-7.94%
|
1/26/2011
|
$68.11
|
PP = $74.70
|
|
MB = $78.44
|
Most Recent Note - 1/28/2011 4:51:33 PM
Y - Volume totals have been lighter while consolidating since its big gap up gain on 1/12/11. Color code was changed to yellow with new pivot point cited based on its 52-week high plus 10 cents. Subsequent gains to new highs with at least +50% above average volume may trigger a new (or add-on) technical buy signal, meanwhile any breach of its recent low ($65.30) or its 50 DMA line may trigger a more worrisome sell signal.
>>> The latest Featured Stock Update with an annotated graph appeared on 1/14/2011. Click here.
View all notes |
Alert me of new notes |
CANSLIM.net Company Profile |
SEC |
Zacks Reports |
StockTalk |
News |
Chart |
Request a new note
C
A N
S L
I M
|
Symbol/Exchange
Company Name
Industry Group |
PRICE |
CHANGE
(%Change) |
Day High |
Volume
(% DAV)
(% 50 day avg vol) |
52 Wk Hi
% From Hi |
Featured
Date |
Price
Featured |
Pivot Featured |
|
Max Buy |
MWIV
-
NASDAQ
M W I Veterinary Supply
HEALTH SERVICES - Medical Instruments and; Supplies
|
$62.16
|
-0.46
-0.73% |
$63.11
|
42,670
77.86% of 50 DAV
50 DAV is 54,800
|
$67.13
-7.40%
|
11/4/2010
|
$61.79
|
PP = $59.60
|
|
MB = $62.58
|
Most Recent Note - 1/28/2011 4:55:04 PM
G - Churned heavy volume today while consolidating near its 50 DMA line. More damaging losses below this week's low ($59.95 on 1/25/11) could raise concerns and trigger a technical sell signal.
>>> The latest Featured Stock Update with an annotated graph appeared on 12/21/2010. Click here.
View all notes |
Alert me of new notes |
CANSLIM.net Company Profile |
SEC |
Zacks Reports |
StockTalk |
News |
Chart |
Request a new note
C
A N
S L
I M
|
NFLX
-
NASDAQ
Netflix Inc
SPECIALTY RETAIL - Music and Video Stores
|
$214.08
|
-3.90
-1.79% |
$216.51
|
5,850,366
100.47% of 50 DAV
50 DAV is 5,822,800
|
$218.00
-1.80%
|
1/10/2011
|
$187.88
|
PP = $209.34
|
|
MB = $219.81
|
Most Recent Note - 1/28/2011 4:58:56 PM
Y - Charged higher today and closed near the session high with a second consecutive volume-driven gain for a new high. A considerable gap up gain on 1/27/11 followed a strong quarterly earnings report and confirmed a technical buy signal. Color code was changed to yellow based on its powerful sign of fundamental and technical strength, quickly helping its outlook to improve.
>>> The latest Featured Stock Update with an annotated graph appeared on 1/10/2011. Click here.
View all notes |
Alert me of new notes |
CANSLIM.net Company Profile |
SEC |
Zacks Reports |
StockTalk |
News |
Chart |
Request a new note
C
A N
S L
I M
|
NTAP
-
NASDAQ
Netapp Inc
COMPUTER HARDWARE - Data Storage Devices
|
$54.73
|
+0.70
1.30% |
$55.10
|
3,955,098
70.39% of 50 DAV
50 DAV is 5,618,800
|
$59.79
-8.46%
|
1/6/2011
|
$57.49
|
PP = $58.06
|
|
MB = $60.96
|
Most Recent Note - 1/28/2011 5:00:52 PM
G - Slumped on lighter volume today and closed the week below its 50 DMA line. More damaging losses could raise greater concerns.
>>> The latest Featured Stock Update with an annotated graph appeared on 12/27/2010. Click here.
View all notes |
Alert me of new notes |
CANSLIM.net Company Profile |
SEC |
Zacks Reports |
StockTalk |
News |
Chart |
Request a new note
C
A N
S L
I M
|
OPEN
-
NASDAQ
Opentable Inc
INTERNET - Internet Software and Services
|
$78.62
|
+1.30
1.68% |
$79.60
|
527,707
66.21% of 50 DAV
50 DAV is 797,000
|
$82.70
-4.93%
|
1/5/2011
|
$74.05
|
PP = $76.79
|
|
MB = $80.63
|
Most Recent Note - 1/31/2011 4:38:37 PM
Y - Small gain today with lighter volume while consolidating above its pivot point and very near its all-time high. Recent lows and its 50 DMA line define near-term chart support.
>>> The latest Featured Stock Update with an annotated graph appeared on 1/5/2011. Click here.
View all notes |
Alert me of new notes |
CANSLIM.net Company Profile |
SEC |
Zacks Reports |
StockTalk |
News |
Chart |
Request a new note
C
A N
S L
I M
|
ORCL
-
NASDAQ
Oracle Corp
COMPUTER SOFTWARE and SERVICES - Application Software
|
$32.03
|
+0.03
0.09% |
$32.20
|
20,819,753
73.32% of 50 DAV
50 DAV is 28,394,200
|
$33.30
-3.81%
|
1/20/2011
|
$32.31
|
PP = $32.37
|
|
MB = $33.99
|
Most Recent Note - 1/28/2011 5:05:04 PM
Y - Considerable loss today on slightly higher (yet near average) volume led to a close just below its pivot point, raising some concerns. Recent chart low $30.80 defines near-term support above its 50 DMA line.
>>> The latest Featured Stock Update with an annotated graph appeared on 1/7/2011. Click here.
View all notes |
Alert me of new notes |
CANSLIM.net Company Profile |
SEC |
Zacks Reports |
StockTalk |
News |
Chart |
Request a new note
C
A N
S L
I M
|
Symbol/Exchange
Company Name
Industry Group |
PRICE |
CHANGE
(%Change) |
Day High |
Volume
(% DAV)
(% 50 day avg vol) |
52 Wk Hi
% From Hi |
Featured
Date |
Price
Featured |
Pivot Featured |
|
Max Buy |
PAY
-
NYSE
Verifone Systems Inc
COMPUTER HARDWARE - Transaction Automation Systems
|
$39.94
|
-0.05
-0.13% |
$40.23
|
1,415,672
85.92% of 50 DAV
50 DAV is 1,647,600
|
$44.87
-10.99%
|
1/27/2011
|
$41.77
|
PP = $44.00
|
|
MB = $46.20
|
Most Recent Note - 1/28/2011 5:07:41 PM
Y - Closed near the session low today with a loss on light volume, finishing -10.9% off its 52-week high. Working on an ascending base pattern since breaking out in July. Its 50 DMA line defines important near-term chart support to watch. Color code was changed to yellow while a new pivot point was cited based on its 52-week high plus ten cents. Subsequent gains with heavy volume may trigger a new (or add-on) technical buy signal. See the latest FSU article for analysis with an annotated graph.
>>> The latest Featured Stock Update with an annotated graph appeared on 1/27/2011. Click here.
View all notes |
Alert me of new notes |
CANSLIM.net Company Profile |
SEC |
Zacks Reports |
StockTalk |
News |
Chart |
Request a new note
C
A N
S L
I M
|
PCLN
-
NASDAQ
Priceline.Com Inc
INTERNET - Internet Software and Services
|
$428.52
|
+3.21
0.75% |
$429.87
|
706,155
75.55% of 50 DAV
50 DAV is 934,700
|
$443.19
-3.31%
|
11/1/2002
|
$399.55
|
PP = $428.20
|
|
MB = $449.61
|
Most Recent Note - 1/28/2011 5:10:26 PM
Y - Loss today with +37% above average volume led to a close back below its pivot point. Finished near the session low and -4.0% off its 52-week high after its 3rd consecutive weekly loss. Its 50 DMA line defines important support to watch above recent chart lows.
>>> The latest Featured Stock Update with an annotated graph appeared on 1/2/2011. Click here.
View all notes |
Alert me of new notes |
CANSLIM.net Company Profile |
SEC |
Zacks Reports |
StockTalk |
News |
Chart |
Request a new note
C
A N
S L
I M
|
RAX
-
NYSE
Rackspace Hosting Inc
INTERNET - Internet Software and; Services
|
$33.51
|
-0.26
-0.77% |
$34.25
|
1,264,772
78.39% of 50 DAV
50 DAV is 1,613,500
|
$35.87
-6.58%
|
1/10/2011
|
$22.84
|
PP = $32.76
|
|
MB = $34.40
|
Most Recent Note - 1/28/2011 5:13:30 PM
G - Gapped up today and hit a new all-time high, yet closed in the lower half of its intra-day range. Found prompt support near its 50 DMA line recently after a 1/20/11 gap down completely negated its 1/11/11 technical breakout. Its recent low ($29.52 on 1/20/10) now defines important support to watch where subsequent violations would raise more serious concerns.
>>> The latest Featured Stock Update with an annotated graph appeared on 12/31/2010. Click here.
View all notes |
Alert me of new notes |
CANSLIM.net Company Profile |
SEC |
Zacks Reports |
StockTalk |
News |
Chart |
Request a new note
C
A N
S L
I M
|
ROVI
-
NASDAQ
Rovi Corp
COMPUTER SOFTWARE andamp; SERVICES - Security Software andamp; Services
|
$61.76
|
+0.79
1.30% |
$62.61
|
1,910,977
120.17% of 50 DAV
50 DAV is 1,590,200
|
$69.50
-11.14%
|
10/29/2010
|
$49.99
|
PP = $53.10
|
|
MB = $55.76
|
Most Recent Note - 1/31/2011 4:37:00 PM
G - Up today with near average volume after slumping near its 50 DMA line. It and its 1/10/11 low ($58.51) define near-term chart support to watch. See the latest FSU analysis for additional details and an annotated graph.
>>> The latest Featured Stock Update with an annotated graph appeared on 1/25/2011. Click here.
View all notes |
Alert me of new notes |
CANSLIM.net Company Profile |
SEC |
Zacks Reports |
StockTalk |
News |
Chart |
Request a new note
C
A N
S L
I M
|
UA
-
NYSE
Under Armour Inc Cl A
CONSUMER NON-DURABLES - Textile - Apparel Clothing
|
$59.86
|
+0.11
0.18% |
$60.36
|
938,757
129.63% of 50 DAV
50 DAV is 724,200
|
$60.98
-1.84%
|
1/27/2011
|
$58.31
|
PP = $56.99
|
|
MB = $59.84
|
Most Recent Note - 1/28/2011 1:52:52 PM
Y - Touched a new 52-week high today then reversed slightly into the red. A strong finish after a considerable gap up gain above its 50 DMA line helped it break out on 1/27/11 from a near-minimum-length 8-week "double bottom" type base, triggering a technical buy signal. The strength was noted as an immediate reaction to strong earnings and sales revenues increases reported for the quarter ended Dec 31, 2011 with positive guidance. Color code was changed to yellow with new pivot point cited based on its 1/19/11 high. Previously noted that it may encounter resistance at its 52-week high, and it remains well off its 2007 all-time high ($73.40).
>>> The latest Featured Stock Update with an annotated graph appeared on 12/23/2010. Click here.
View all notes |
Alert me of new notes |
CANSLIM.net Company Profile |
SEC |
Zacks Reports |
StockTalk |
News |
Chart |
Request a new note
C
A N
S L
I M
|
Symbol/Exchange
Company Name
Industry Group |
PRICE |
CHANGE
(%Change) |
Day High |
Volume
(% DAV)
(% 50 day avg vol) |
52 Wk Hi
% From Hi |
Featured
Date |
Price
Featured |
Pivot Featured |
|
Max Buy |
ULTA
-
NASDAQ
Ulta Salon Cosm & Frag
SPECIALTY RETAIL - Specialty Retail, Other
|
$37.04
|
+0.31
0.84% |
$37.26
|
571,562
96.29% of 50 DAV
50 DAV is 593,600
|
$38.25
-3.16%
|
1/6/2011
|
$36.12
|
PP = $37.34
|
|
MB = $39.21
|
Most Recent Note - 1/28/2011 5:15:37 PM
Y - Perched only -4% off its 52-week high, subsequent volume-driven gains above its pivot point would be a very reassuring sign. Its 50 DMA line defines important chart support to watch.
>>> The latest Featured Stock Update with an annotated graph appeared on 1/6/2011. Click here.
View all notes |
Alert me of new notes |
CANSLIM.net Company Profile |
SEC |
Zacks Reports |
StockTalk |
News |
Chart |
Request a new note
C
A N
S L
I M
|