You are not logged in.
This means you
CAN ONLY VIEW reports that were published prior to Monday, April 14, 2025.
You
MUST UPGRADE YOUR MEMBERSHIP if you want to see any current reports.
AFTER MARKET UPDATE - THURSDAY, JANUARY 30TH, 2014
Previous After Market Report Next After Market Report >>>
|
|
|
|
DOW |
+109.82 |
15,848.61 |
+0.70% |
|
Volume |
641,115,200 |
-11% |
|
Volume |
1,946,191,160 |
-6% |
|
NASDAQ |
+71.69 |
4,123.12 |
+1.77% |
|
Advancers |
2,340 |
74% |
|
Advancers |
1,958 |
73% |
|
S&P 500 |
+19.99 |
1,794.19 |
+1.13% |
|
Decliners |
711 |
22% |
|
Decliners |
636 |
24% |
|
Russell 2000 |
+16.91 |
1,139.36 |
+1.51% |
|
52 Wk Highs |
73 |
|
|
52 Wk Highs |
80 |
|
|
S&P 600 |
+8.17 |
643.81 |
+1.29% |
|
52 Wk Lows |
44 |
|
|
52 Wk Lows |
20 |
|
|
 |
Major Averages Rose With Less Volume Conviction Behind Gains
Kenneth J. Gruneisen - Passed the CAN SLIM® Master's Exam
On Thursday the markets ended higher on the session, albeit off of their best levels. The volume totals were reported lighter than the prior trading session's volume totals on the NYSE and on the Nasdaq exchange, a sign that the institutional crowd was not increasing their buying efforts. Breadth was positive as advancers led decliners by more than a 3-1 ratio on the NYSE and on the Nasdaq exchange. There were 20 high-ranked companies from the CANSLIM.net Leaders List that made new 52-week highs and appeared on the CANSLIM.net BreakOuts Page, up from the total of 8 stocks on the prior session. The list of stocks hitting new 52-week highs outnumbered new 52-week lows on the NYSE and also on the Nasdaq exchange. There were gains for 11 of the 14 high-ranked companies currently included on the Featured Stocks Page, a list that has recently been waning. The Market (M criteria) has encountered distributional pressure and leadership (stocks hitting new highs) has waned, earning the label of being in another "correction". Such weakness serves as a reminder for investors to use caution and remain disciplined in following proper sell rules under the fact-based investment system to reduce market exposure.
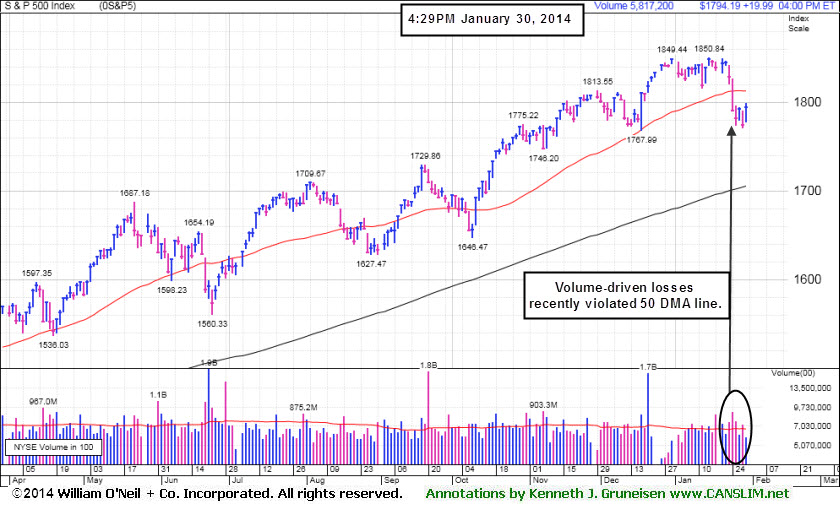
Stocks traded higher throughout the session as investors responded to a batch of better-than-expected corporate earnings and an encouraging report on fourth-quarter GDP. The Dow Jones Industrial Average gained 109 points to 15,848, after being up by as many as 168 points. The S&P 500 advanced just under 20 points to 1,794. The Nasdaq Composite Index added 71 points with the index closing at 4,123, rebounding above its 50-day moving average line.
All 10 sectors on the S&P ended higher, led by a rally in health care stocks. Shares of Alexion Pharmaceuticals (ALXN +21.1%) after the company's quarterly earnings topped analysts' estimates. Social media stocks also posted strong gains. Facebook Inc (FB +14.1%) rallied to a new high as strong growth in mobile ad sales helped the company post stronger-than-anticipated results. Also in the space, LinkedIn (LNKD +4%) and Twitter Inc (TWTR +6.7%) rose.
Turning to fixed income markets, Treasuries were lower along the curve. The benchmark 10-year note was down 5/32 to yield 2.70% and the 30-year bond gave up 11/32 to yield 3.64%.
Investors should be watchful for any individual issues flashing technical sell signals. The CANSLIM.net Featured Stocks Page shows the most action-worthy candidates and their latest notes and a Headline Link directs members to the latest detailed analysis with data-packed graphs annotated by a Certified expert along with links to additional resources. The Premium Member Homepage includes "dynamic archives" to all prior pay reports published. Watch for an announcement via email concerning the next WEBCAST.
PICTURED: The S&P 500 Index recently violated its 50-day moving average (DMA) line with volume-driven losses. The Dow Jones Industrial Average also remain below its respective short-term moving averages.
|
 Kenneth J. Gruneisen started out as a licensed stockbroker in August 1987, a couple of months prior to the historic stock market crash that took the Dow Jones Industrial Average down -22.6% in a single day. He has published daily fact-based fundamental and technical analysis on high-ranked stocks online for two decades. Through FACTBASEDINVESTING.COM, Kenneth provides educational articles, news, market commentary, and other information regarding proven investment systems that work in good times and bad.
Comments contained in the body of this report are technical opinions only and are not necessarily those of Gruneisen Growth Corp. The material herein has been obtained from sources believed to be reliable and accurate, however, its accuracy and completeness cannot be guaranteed. Our firm, employees, and customers may effect transactions, including transactions contrary to any recommendation herein, or have positions in the securities mentioned herein or options with respect thereto. Any recommendation contained in this report may not be suitable for all investors and it is not to be deemed an offer or solicitation on our part with respect to the purchase or sale of any securities. |
|
 |
Retail, Financial, and Tech Groups Posted Gains
Kenneth J. Gruneisen - Passed the CAN SLIM® Master's Exam
The Oil Services Index ($OSX +0.63%) posted a modest gaoin while the Integrated Oil Index ($XOI +0.04%) finished flat. The financial indexes including the Bank Index ($BKX +1.05%) and the Broker/Dealer Index ($XBD +1.44%) underpinned Thursday's gains for the major averages and the Retail Index ($RLX +1.58%) was also an important positive influence. The Biotechnology Index ($BTK +2.89%) led the tech sector's rally and the Networking Index ($NWX +1.76%) and Semiconductor Index ($SOX +1.30%) both also posted solid gains.
Charts courtesy www.stockcharts.com
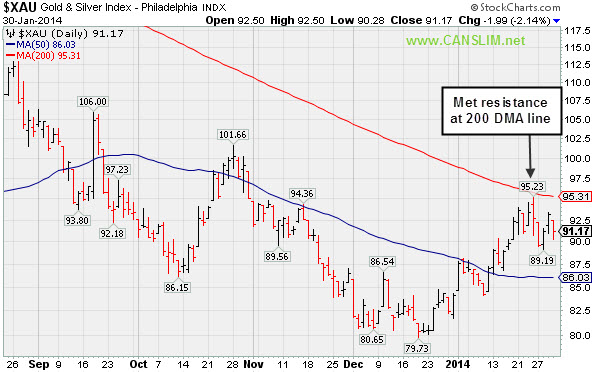
PICTURED: The Gold & Silver Index ($XAU -2.13%) was a standout decliner on Thursday. It met resistance at its 200-day moving averag (DMA) line after rebounding from its December lows.
| Oil Services |
$OSX |
265.17 |
+1.67 |
+0.63% |
-5.64% |
| Integrated Oil |
$XOI |
1,432.20 |
+0.51 |
+0.04% |
-4.72% |
| Semiconductor |
$SOX |
531.96 |
+6.82 |
+1.30% |
-0.57% |
| Networking |
$NWX |
338.45 |
+5.84 |
+1.76% |
+4.48% |
| Broker/Dealer |
$XBD |
156.08 |
+2.21 |
+1.44% |
-2.79% |
| Retail |
$RLX |
890.84 |
+13.86 |
+1.58% |
-5.21% |
| Gold & Silver |
$XAU |
91.17 |
-1.98 |
-2.13% |
+8.34% |
| Bank |
$BKX |
68.36 |
+0.71 |
+1.05% |
-1.30% |
| Biotech |
$BTK |
2,576.22 |
+72.38 |
+2.89% |
+10.55% |
|
|
|
 |
Fundamental and Technical Weakness Noted as Serious Concerns
Kenneth J. Gruneisen - Passed the CAN SLIM® Master's Exam
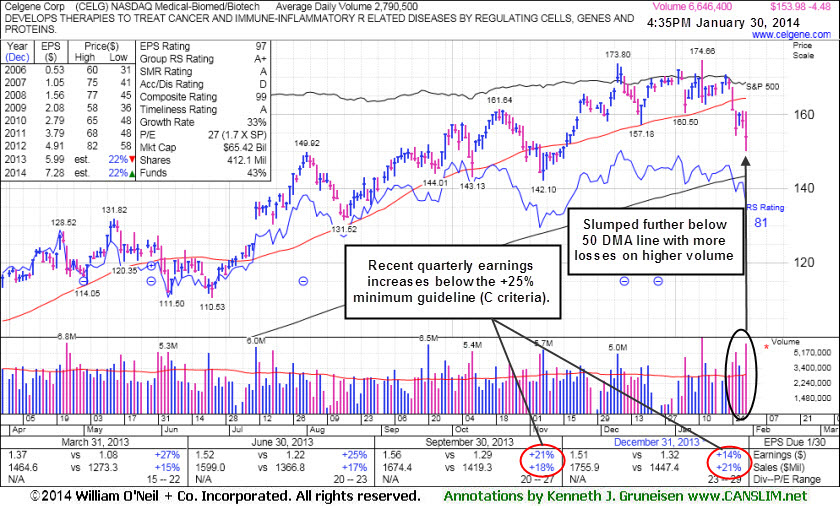
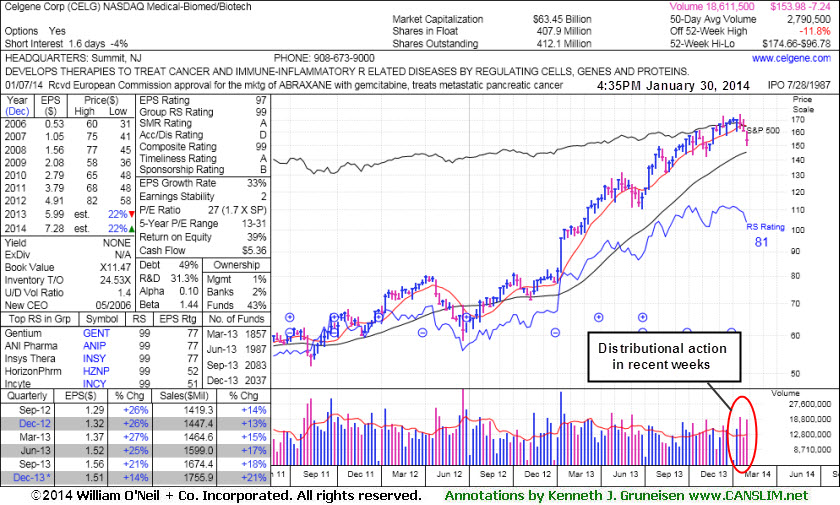
Celgene Corp (CELG -$4.48 or -2.83% to $153.98) was down again today with above average volume, raising greater concerns while slumping further below its 50-day moving average (DMA) line. It reported earnings +14% on +21% sales revenues for the Dec '13 quarter, well below the +25% minimum eaernings guideline (C criteria) for buy candidates. Based on fundamental and technical weakness it will be dropped from the Featured Stocks list tonight. Losses undercutting prior lows in the $157 area and its 50 DMA line were recently noted as the damaging declines triggered technical sell signals.
CELG's last appearance in this FSU section was on 1/07/14 with annotated graphs under the headline, "Found Support Above 50-Day Average After Gapping Down on Prior Session". At that time members were cautioned - "Fundamental flaws may be considered an over-riding concern arguing against new buying efforts. It reported earnings +21% on +18% sales revenues for the Sep '13 quarter. below the +25% minimum guideline (C criteria) - (see red circle on daily graph). Its C+ rating for Accumulation/Distribution is also cause for some concern."
The number of top-rated funds owning its shares rose from 1,856 in Mar '13 to 2,037 in Dec '13, a reassuring trend concerning the I criteria. However, the company is already well-known by the institutional crowd, and that means that very few are likely to just be discovering it.
|
|
|
Color Codes Explained :
Y - Better candidates highlighted by our
staff of experts.
G - Previously featured
in past reports as yellow but may no longer be buyable under the
guidelines.
***Last / Change / Volume data in this table is the closing quote data***
Symbol/Exchange
Company Name
Industry Group |
PRICE |
CHANGE
(%Change) |
Day High |
Volume
(% DAV)
(% 50 day avg vol) |
52 Wk Hi
% From Hi |
Featured
Date |
Price
Featured |
Pivot Featured |
|
Max Buy |
CELG
-
NASDAQ
Celgene Corp
DRUGS - Drug Manufacturers - Major
|
$153.98
|
-4.48
-2.83% |
$160.83
|
6,827,396
253.93% of 50 DAV
50 DAV is 2,688,700
|
$174.66
-11.84%
|
9/12/2013
|
$149.50
|
PP = $150.02
|
|
MB = $157.52
|
 Most Recent Note - 1/30/2014 5:25:49 PM
Down again today with above average volume, raising greater concerns while slumping further below its 50 DMA line. It will be dropped from the Featured Stocks list tonight. See the latest FSU analysis for more details and new annotated graphs.
>>> FEATURED STOCK ARTICLE : Fundamental and Technical Weakness Noted as Serious Concerns - 1/30/2014
View all notes |
Set NEW NOTE alert |
CANSLIM.net Company Profile |
SEC
News |
Chart |
Request a new note
C
A N
S L
I M


|
EGOV
-
NASDAQ
N I C Inc
INTERNET - Internet Software and Services
|
$21.69
|
-0.13
-0.60% |
$22.46
|
335,105
132.40% of 50 DAV
50 DAV is 253,100
|
$25.99
-16.54%
|
12/20/2013
|
$24.00
|
PP = $26.09
|
|
MB = $27.39
|
Most Recent Note - 1/28/2014 5:15:24 PM
G - Slumped further below its 50 DMA line today on higher volume and undercut the recent low ($22.17 on 12/16/13) raising greater concerns. Its Relative Strength (RS) rating has fallen to 67, below the 80+ minimum guideline for buy candidates. A rally above recent resistance in the $25-26 area is needed for its technical stance to turn bullish. See the latest FSU analysis for more details and new annotated graphs.
>>> FEATURED STOCK ARTICLE : Relative Strength Rating Wanes While Slumping on Higher Volume - 1/28/2014
View all notes |
Set NEW NOTE alert |
CANSLIM.net Company Profile |
SEC
News |
Chart |
Request a new note
C
A N
S L
I M
|
EQM
-
NYSE
E Q T Midstream Partners
ENERGY - Oil and Gas Pipelines
|
$63.16
|
+0.33
0.53% |
$63.82
|
58,954
55.10% of 50 DAV
50 DAV is 107,000
|
$63.66
-0.79%
|
12/12/2013
|
$53.17
|
PP = $56.51
|
|
MB = $59.34
|
Most Recent Note - 1/24/2014 4:19:48 PM
G - Stubbornly holding its ground while very extended from any sound base pattern. Prior highs in the $56 area define support to watch on pullbacks.
>>> FEATURED STOCK ARTICLE : Extended From Base After Six Consecutive Weekly Gains - 1/17/2014
View all notes |
Set NEW NOTE alert |
CANSLIM.net Company Profile |
SEC
News |
Chart |
Request a new note
C
A N
S L
I M
|
FB
-
NASDAQ
Facebook Inc Cl A
INTERNET
|
$61.08
|
+7.55
14.10% |
$62.50
|
150,013,692
234.59% of 50 DAV
50 DAV is 63,948,100
|
$59.31
2.98%
|
12/12/2013
|
$51.40
|
PP = $54.93
|
|
MB = $57.68
|
Most Recent Note - 1/30/2014 12:40:38 PM
Y - Reported earnings +82% on +63% sales revenues for the Dec '13 quarter. Gapped up and hit a new 52-week high today after finding support at its 50 DMA line during its latest consolidation. Color code is changed to yellow. Market conditions argue against new buying efforts until a FTD from at least one of the major averages confirms a new rally. One may consider a valid secondary buy point from its successful test of the 10 week average up to +5% above the recent high ($59.31 on 1/22/14).
>>> FEATURED STOCK ARTICLE : Following New Offering Prior Highs Acted As Support - 1/15/2014
View all notes |
Set NEW NOTE alert |
CANSLIM.net Company Profile |
SEC
News |
Chart |
Request a new note
C
A N
S L
I M
|
JAZZ
-
NASDAQ
Jazz Pharmaceuticals Plc
DRUGS - Biotechnology
|
$156.57
|
+4.95
3.26% |
$158.38
|
951,353
121.94% of 50 DAV
50 DAV is 780,200
|
$159.14
-1.62%
|
9/30/2013
|
$93.20
|
PP = $89.10
|
|
MB = $93.56
|
Most Recent Note - 1/28/2014 12:52:33 PM
G - Rebounding toward its 52-week high with a gap up gain today following 2 consecutive big losses on above average volume. Its 50 DMA line ($125.973 now) defines important support to watch on pullbacks.
>>> FEATURED STOCK ARTICLE : Very Extended From Sound Base Following Big Volume-Driven Gains - 1/14/2014
View all notes |
Set NEW NOTE alert |
CANSLIM.net Company Profile |
SEC
News |
Chart |
Request a new note
C
A N
S L
I M
|
Symbol/Exchange
Company Name
Industry Group |
PRICE |
CHANGE
(%Change) |
Day High |
Volume
(% DAV)
(% 50 day avg vol) |
52 Wk Hi
% From Hi |
Featured
Date |
Price
Featured |
Pivot Featured |
|
Max Buy |
KORS
-
NYSE
Michael Kors Hldgs Ltd
RETAIL - Apparel Stores
|
$80.39
|
+1.65
2.10% |
$81.00
|
3,085,400
73.50% of 50 DAV
50 DAV is 4,197,800
|
$84.58
-4.95%
|
8/6/2013
|
$69.66
|
PP = $66.28
|
|
MB = $69.59
|
Most Recent Note - 1/29/2014 3:13:27 PM
G - Slumping back below its 50 DMA line today. Recent losses on higher volume indicated distributional pressure. Reports quarterly financial results on Tuesday, February 4, 2014, before the market opens.
>>> FEATURED STOCK ARTICLE : Technical Deterioration and RS Rating Slump Raises Concerns - 1/9/2014
View all notes |
Set NEW NOTE alert |
CANSLIM.net Company Profile |
SEC
News |
Chart |
Request a new note
C
A N
S L
I M
|
MRLN
-
NASDAQ
Marlin Business Services
DIVERSIFIED SERVICES - Rental and Leasing Services
|
$26.15
|
+0.31
1.20% |
$26.40
|
23,390
73.09% of 50 DAV
50 DAV is 32,000
|
$29.58
-11.59%
|
12/19/2013
|
$26.69
|
PP = $28.74
|
|
MB = $30.18
|
Most Recent Note - 1/29/2014 6:01:52 PM
Y - Down today on lighter volume, finishing at the session low with a 4th consecutive loss. Slumped near its 50 DMA line where a violation would raise more serious concerns. Disciplined investor always limit losses by selling any stock that falls more than -7% from their purchase price.
>>> FEATURED STOCK ARTICLE : Hovering Near 52-Week High Following Technical Breakout - 1/22/2014
View all notes |
Set NEW NOTE alert |
CANSLIM.net Company Profile |
SEC
News |
Chart |
Request a new note
C
A N
S L
I M
|
PCLN
-
NASDAQ
Priceline.Com Inc
INTERNET - Internet Software and Services
|
$1,160.00
|
+26.21
2.31% |
$1,162.76
|
789,903
133.59% of 50 DAV
50 DAV is 591,300
|
$1,214.97
-4.52%
|
12/18/2013
|
$1,156.20
|
PP = $1,198.85
|
|
MB = $1,258.79
|
Most Recent Note - 1/29/2014 5:57:38 PM
G - Slumped further below its 50 DMA line today with slightly higher volume. Prior low ($1,113.01 on 1/06/13) defines near-term support to watch. See the latest FSU analysis for more details and new annotated graphs.
>>> FEATURED STOCK ARTICLE : Violation of 50-Day Average After Failing to Trigger New Buy Signal - 1/29/2014
View all notes |
Set NEW NOTE alert |
CANSLIM.net Company Profile |
SEC
News |
Chart |
Request a new note
C
A N
S L
I M
|
RGR
-
NYSE
Sturm Ruger & Co Inc
CONSUMER DURABLES - Sporting Goods
|
$75.80
|
+1.99
2.70% |
$76.59
|
257,232
75.77% of 50 DAV
50 DAV is 339,500
|
$85.93
-11.79%
|
1/8/2014
|
$78.87
|
PP = $80.38
|
|
MB = $84.40
|
Most Recent Note - 1/24/2014 4:12:59 PM
G- Violated its 50 DMA line with today's loss on higher volume triggering a technical sell signal. Color code is changed to green. A prompt rebound above the 50 DMA line is needed for its outlook to improve. Disciplined investors always limit losses by selling any stock if it falls more than -7% from their purchase price."
>>> FEATURED STOCK ARTICLE : Hit New Highs With 6th Consecutive Gain - 1/13/2014
View all notes |
Set NEW NOTE alert |
CANSLIM.net Company Profile |
SEC
News |
Chart |
Request a new note
C
A N
S L
I M
|
SFUN
-
NYSE
Soufun Hldgs Ltd Ads A
INTERNET - Internet Information Providers
|
$82.20
|
+1.77
2.20% |
$84.10
|
948,362
81.03% of 50 DAV
50 DAV is 1,170,400
|
$95.39
-13.83%
|
10/17/2013
|
$58.02
|
PP = $53.87
|
|
MB = $56.56
|
Most Recent Note - 1/28/2014 1:51:10 PM
G - Gain today halted its slide at its 50 DMA line after 3 consecutive volume-driven losses.Very extended from any sound base, and its 50 DMA line ($77.60 now) defines important support to watch.
>>> FEATURED STOCK ARTICLE : Extended From Base Following More Volume-Driven Gains - 1/10/2014
View all notes |
Set NEW NOTE alert |
CANSLIM.net Company Profile |
SEC
News |
Chart |
Request a new note
C
A N
S L
I M
|
Symbol/Exchange
Company Name
Industry Group |
PRICE |
CHANGE
(%Change) |
Day High |
Volume
(% DAV)
(% 50 day avg vol) |
52 Wk Hi
% From Hi |
Featured
Date |
Price
Featured |
Pivot Featured |
|
Max Buy |
SILC
-
NASDAQ
Silicom Ltd
COMPUTER HARDWARE - Networking andamp; Communication Dev
|
$62.20
|
+0.16
0.26% |
$62.21
|
45,696
132.84% of 50 DAV
50 DAV is 34,400
|
$63.91
-2.68%
|
12/23/2013
|
$44.62
|
PP = $46.25
|
|
MB = $48.56
|
Most Recent Note - 1/29/2014 2:40:53 PM
G - Hovering near its 52-week high today, extended from any sound base. Stubbornly holding its ground since a considerable gap up on 1/23/14 after reporting earnings +92% on +52% sales for the Dec '13 quarter, beating consensus estimates.
>>> FEATURED STOCK ARTICLE : Considerable Gap Up Following Strong Earnings Report - 1/23/2014
View all notes |
Set NEW NOTE alert |
CANSLIM.net Company Profile |
SEC
News |
Chart |
Request a new note
C
A N
S L
I M
|
SSNC
-
NASDAQ
S S & C Technologies
COMPUTER SOFTWARE and SERVICES - Application Software
|
$39.11
|
-0.29
-0.74% |
$39.66
|
584,032
221.90% of 50 DAV
50 DAV is 263,200
|
$46.61
-16.08%
|
10/22/2013
|
$39.17
|
PP = $40.04
|
|
MB = $42.04
|
Most Recent Note - 1/29/2014 3:12:07 PM
G- Gapped down today, raising greater concerns while slumping further below its 50 DMA line with above average volume behind its damaging 4th consecutive loss. A rebound above the 50 DMA line is needed for its outlook improve.
>>> FEATURED STOCK ARTICLE : Enduring Distributional Pressure While Retreating Near Prior Highs - 1/16/2014
View all notes |
Set NEW NOTE alert |
CANSLIM.net Company Profile |
SEC
News |
Chart |
Request a new note
C
A N
S L
I M
|
ULTI
-
NASDAQ
Ultimate Software Group
INTERNET - Internet Software and Services
|
$162.32
|
+6.45
4.14% |
$163.21
|
379,203
279.24% of 50 DAV
50 DAV is 135,800
|
$162.88
-0.34%
|
1/27/2014
|
$153.75
|
PP = $162.98
|
|
MB = $171.13
|
Most Recent Note - 1/30/2014 5:31:08 PM
Y - Rallied for a new 52-week high and its best-ever close with heavy volume behind today's gain clearing all resistance due to overhead supply. Did not close above the pivot point cited based on its 10/30/13 high plus 10 cents, however the bullish action had the look of institutional accumulation. Broader market conditions (M criteria) argue for caution until at least one of the major averages produces a convincing follow through day of gains on higher volume.
>>> FEATURED STOCK ARTICLE : Forming New Base But Enduring Distributional Pressure - 1/27/2014
View all notes |
Set NEW NOTE alert |
CANSLIM.net Company Profile |
SEC
News |
Chart |
Request a new note
C
A N
S L
I M
|
VRX
-
NYSE
Valeant Pharmaceuticals
DRUGS - Drug Manufacturers - Other
|
$136.60
|
+3.80
2.86% |
$136.99
|
1,166,037
100.95% of 50 DAV
50 DAV is 1,155,100
|
$140.36
-2.68%
|
9/11/2013
|
$100.26
|
PP = $105.50
|
|
MB = $110.78
|
Most Recent Note - 1/28/2014 1:38:14 PM
G - Extended from any sound base and enduring mild distributional pressure for the past week. Its 50 DMA line and prior highs near $115 define near-term support to watch.
>>> FEATURED STOCK ARTICLE : Bullish Action Has Continued Despite Fundamental Concerns - 1/21/2014
View all notes |
Set NEW NOTE alert |
CANSLIM.net Company Profile |
SEC
News |
Chart |
Request a new note
C
A N
S L
I M
|
|
|
|
THESE ARE NOT BUY RECOMMENDATIONS!
Comments contained in the body of this report are technical
opinions only. The material herein has been obtained
from sources believed to be reliable and accurate, however,
its accuracy and completeness cannot be guaranteed.
This site is not an investment advisor, hence it does
not endorse or recommend any securities or other investments.
Any recommendation contained in this report may not
be suitable for all investors and it is not to be deemed
an offer or solicitation on our part with respect to
the purchase or sale of any securities. All trademarks,
service marks and trade names appearing in this report
are the property of their respective owners, and are
likewise used for identification purposes only.
This report is a service available
only to active Paid Premium Members.
You may opt-out of receiving report notifications
at any time. Questions or comments may be submitted
by writing to Premium Membership Services 665 S.E. 10 Street, Suite 201 Deerfield Beach, FL 33441-5634 or by calling 1-800-965-8307
or 954-785-1121.
|
|
|

