You are not logged in.
This means you
CAN ONLY VIEW reports that were published prior to Monday, March 10, 2025.
You
MUST UPGRADE YOUR MEMBERSHIP if you want to see any current reports.
AFTER MARKET UPDATE - WEDNESDAY, JANUARY 30TH, 2013
Previous After Market Report Next After Market Report >>>
|
|
|
|
DOW |
-44.00 |
13,910.42 |
-0.32% |
|
Volume |
704,617,930 |
-2% |
|
Volume |
1,943,103,580 |
+2% |
|
NASDAQ |
-11.35 |
3,142.31 |
-0.36% |
|
Advancers |
990 |
32% |
|
Advancers |
755 |
29% |
|
S&P 500 |
-5.88 |
1,501.96 |
-0.39% |
|
Decliners |
1,969 |
63% |
|
Decliners |
1,722 |
67% |
|
Russell 2000 |
-10.40 |
896.91 |
-1.15% |
|
52 Wk Highs |
252 |
|
|
52 Wk Highs |
142 |
|
|
S&P 600 |
-6.09 |
502.16 |
-1.20% |
|
52 Wk Lows |
11 |
|
|
52 Wk Lows |
16 |
|
|
 |
Major Averages Pulled Back With Negative Breadth
Kenneth J. Gruneisen - Passed the CAN SLIM® Master's Exam
The major averages lost ground on Wednesday's choppy range-bound session as investors responded to mixed economic data. The volume totals were reported mixed, lighter on the NYSE and slightly higher on the Nasdaq exchange. Breadth was negative as decliners led advancers by a 2-1 margin on the NYSE and on the Nasdaq exchange. The total number of stocks hitting new 52-week highs still easily outnumbered new 52-week lows on the NYSE and on the Nasdaq exchange. There were 61 high-ranked companies from the CANSLIM.net Leaders List making new 52-week highs and appearing on the CANSLIM.net BreakOuts Page, down from the prior session total of 66 stocks. There were gains for only 2 of the 11 high-ranked companies currently included on the Featured Stocks Page.
Despite a positive ADP jobs report, an unexpected -0.1% contraction in fourth-quarter GDP weighed on equities. Investors were also focused on the conclusion of the Fed's two-day policy meeting. The central bank reiterated their commitment to bond purchases until further improvement in the economy and unemployment situation.
Eight of the 10 sectors on the S&P finished lower, led by declines in the industrial space including 3M Co (MMM -0.99%). On the earnings front, Amazon.com Inc (AMZN +4.77%) rebounded following 2 consecutive volume-driven losses after reporting better-than-expected quarterly results. The Boeing Co (BA +1.28%) advanced after the company posted better-than-expected earnings and said recent problems with their 787 Dreamliners would not impact operations or earnings. In other news, Research In Motion Ltd (RIMM -12.01%) fell after the company unveiled its new smartphone and said it was changing the company's name to Blackberry. Facebook Inc (FB +1.46%) shares gained ahead of the social media website's scheduled earnings report
Turning to fixed income markets, Treasuries were little changed with the benchmark 10-year note flat to yield 2.00%.
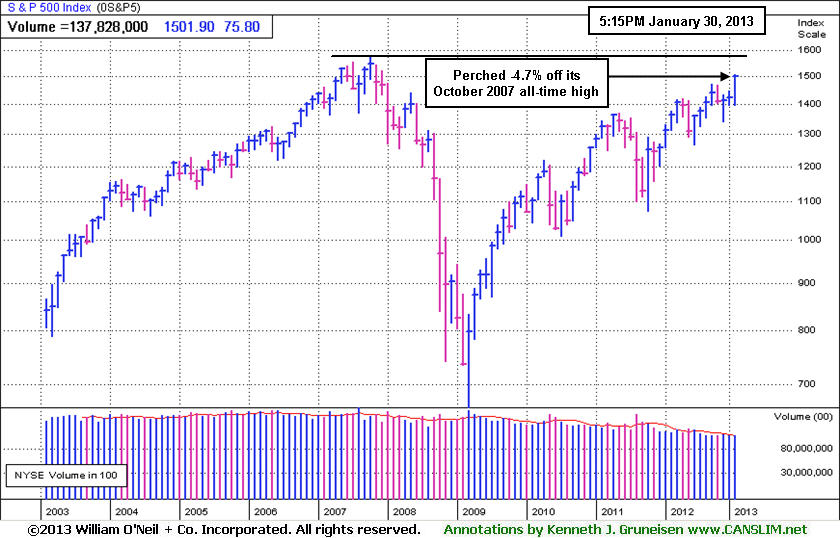
The latest rally has produced a few action worthy candidates meeting all of the fact-based investment system's criteria. Selectivity and discipline are required, as always. Investors may consider new buying efforts in stocks meeting all key criteria, as the market's (M criteria) confirmed uptrend has been comprised by great leadership (stocks hitting new 52-week highs) in the broader market. Widespread gains helped all of the major averages blast higher, and the benchmark S&P 500 Index is perched at its best level in more than five years.
Watch for an announcement via email concerning the next WEBCAST. The webcast will also be available via an updated link highlighted at the top of the Premium Member Homepage.
PICTURED: The monthly graph of the benchmark S&P 500 Index shows it rallying above its 2012 highs for new recovery highs. It is now perched only -4.7% off its all-time high from October 2007 of 1,576.
|
 Kenneth J. Gruneisen started out as a licensed stockbroker in August 1987, a couple of months prior to the historic stock market crash that took the Dow Jones Industrial Average down -22.6% in a single day. He has published daily fact-based fundamental and technical analysis on high-ranked stocks online for two decades. Through FACTBASEDINVESTING.COM, Kenneth provides educational articles, news, market commentary, and other information regarding proven investment systems that work in good times and bad.
Comments contained in the body of this report are technical opinions only and are not necessarily those of Gruneisen Growth Corp. The material herein has been obtained from sources believed to be reliable and accurate, however, its accuracy and completeness cannot be guaranteed. Our firm, employees, and customers may effect transactions, including transactions contrary to any recommendation herein, or have positions in the securities mentioned herein or options with respect thereto. Any recommendation contained in this report may not be suitable for all investors and it is not to be deemed an offer or solicitation on our part with respect to the purchase or sale of any securities. |
|
 |
Tech, Defensive, and Energy-Related Groups Pulled Market Lower
Kenneth J. Gruneisen - Passed the CAN SLIM® Master's Exam
The Broker/Dealer Index ($XBD +0.34%) posted a small gain and the Bank Index ($BKX +0.04%) and Retail Index ($RLX +0.09%) finished virtually unchanged. The tech sector created a drag on the major averages as the Networking Index ($NWX -1.98%), Biotechnology Index ($BTK -1.27%), and Internet Index ($IIX -0.78%) lost ground while the Semiconductor Index ($SOX +0.20%) eked out a small gain. Weakness in the energy-group pulled the Oil Services Index ($OSX -0.77%) and the Integrated Oil Index ($XOI -0.37%) down. Defensive groups including the Healthcare Index ($HMO -0.70%) and the Gold & Silver Index ($XAU -0.51%) also ended with modest losses, rounding out the mostly negative session.
Charts courtesy www.stockcharts.com
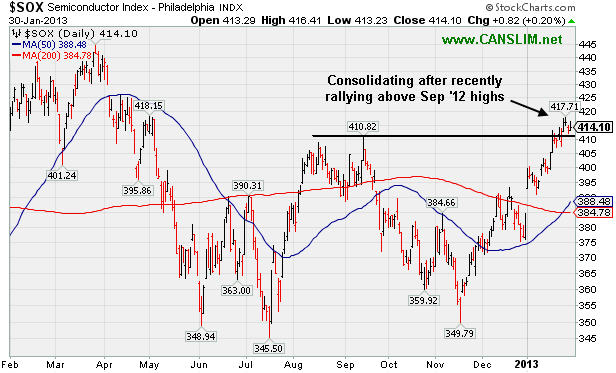
PICTURED: The Semiconductor Index ($SOX +0.20%) is consolidating after recently rallying above its September 2012 highs.
| Oil Services |
$OSX |
246.05 |
-1.90 |
-0.77% |
+11.76% |
| Healthcare |
$HMO |
2,670.17 |
-18.95 |
-0.70% |
+6.20% |
| Integrated Oil |
$XOI |
1,363.46 |
-5.04 |
-0.37% |
+9.79% |
| Semiconductor |
$SOX |
414.10 |
+0.82 |
+0.20% |
+7.82% |
| Networking |
$NWX |
236.91 |
-4.78 |
-1.98% |
+4.57% |
| Internet |
$IIX |
351.78 |
-2.76 |
-0.78% |
+7.58% |
| Broker/Dealer |
$XBD |
104.40 |
+0.35 |
+0.34% |
+10.67% |
| Retail |
$RLX |
702.86 |
+0.66 |
+0.09% |
+7.63% |
| Gold & Silver |
$XAU |
150.95 |
-0.77 |
-0.51% |
-8.85% |
| Bank |
$BKX |
53.94 |
+0.02 |
+0.04% |
+5.19% |
| Biotech |
$BTK |
1,654.52 |
-21.34 |
-1.27% |
+6.95% |
|
|
|
 |
Retreating From All-Time Highs After Getting Extended
Kenneth J. Gruneisen - Passed the CAN SLIM® Master's Exam
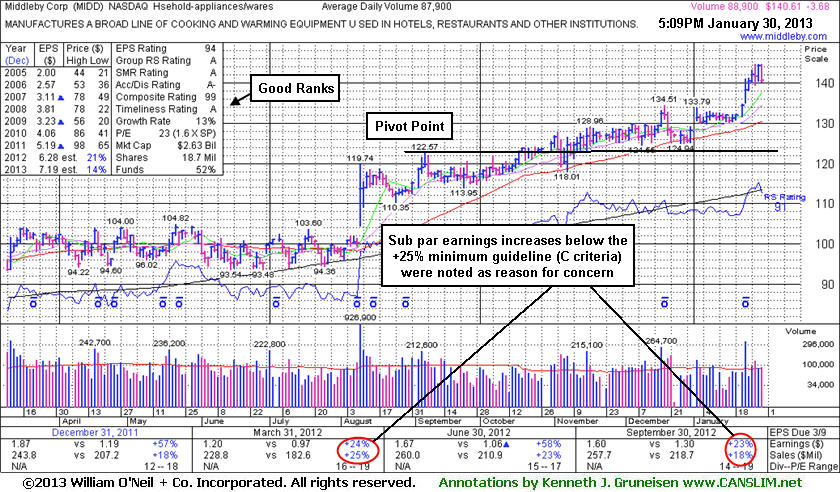
Middleby Corp (MIDD -$3.68 or -2.55% to $140.61) pulled back on average volume today, retreating from new all-time high territory hit this week. Prior mid-day reports noted - "Disciplined investors may watch closely for sell signals if holding it and giving it a chance to produce more climactic gains. Its 50-day moving average (DMA) line defines near-term chart support to watch where any violation would trigger a technical sell signal." Earnings +23% on +18% sales for the Sep '12 quarter, below the +25% minimum earnings guideline (C criteria), raised concerns.
Its last appearance in this FSU section was on 1/14/13 with an annotated graph under the headline, "Found Technical Support But Fundamental Flaws Remain a Concern". The number of top-rated funds owning its shares rose from 351 in Dec '11 to 389 in Dec '12, a reassuring sign concerning the I criteria. Today its current Up/Down Volume Ratio of 1.7 is an unbiased indication its shares have been under accumulation over the past 50 days. Its small supply (S criteria) of only 17.1 million shares in the public float can contribute to greater price volatility in the event of institutional buying or selling. It has traded up as much as +22% since first highlighted in yellow in the 8/09/12 mid-day report as it gapped up and broke out from a long flat base with a considerable gain 9 times average volume. A "breakaway gap" was noted as the one exception where buying at more than +5% above prior highs is permitted under the fact-based system (read here).
Investors who are disciplined, selective, and patient would likely watch for a fresh breakout in another high-ranked stock without any fundamental flaws, rather than looking for excuses to buy one with flaws and one that is extended from a sound base.
|
|
|
Color Codes Explained :
Y - Better candidates highlighted by our
staff of experts.
G - Previously featured
in past reports as yellow but may no longer be buyable under the
guidelines.
***Last / Change / Volume data in this table is the closing quote data***
Symbol/Exchange
Company Name
Industry Group |
PRICE |
CHANGE
(%Change) |
Day High |
Volume
(% DAV)
(% 50 day avg vol) |
52 Wk Hi
% From Hi |
Featured
Date |
Price
Featured |
Pivot Featured |
|
Max Buy |
CELG
-
NASDAQ
Celgene Corp
DRUGS - Drug Manufacturers - Major
|
$98.47
|
-0.73
-0.74% |
$99.73
|
3,423,457
93.80% of 50 DAV
50 DAV is 3,649,600
|
$100.12
-1.65%
|
12/11/2012
|
$82.24
|
PP = $81.34
|
|
MB = $85.41
|
 Most Recent Note - 1/30/2013 2:09:49 PM
G - Volume totals have been cooling while hovering in a tight range near its all-time high, very extended from its prior base. See the recent Featured Stock Update (FSU) analysis for the latest annotated graph and more details under the headline, "Rule Suggests Letting Explosive Winners Have Time For Greater Gains - Thursday, January 17, 2013 ".
>>> The latest Featured Stock Update with an annotated graph appeared on 1/17/2013. Click here.
View all notes |
Alert me of new notes |
CANSLIM.net Company Profile |
SEC |
Zacks Reports |
StockTalk |
News |
Chart |
Request a new note
C
A N
S L
I M


|
CFNL
-
NASDAQ
Cardinal Financial Corp
BANKING - Regional - Southeast Banks
|
$16.34
|
-0.13
-0.79% |
$16.51
|
138,293
61.66% of 50 DAV
50 DAV is 224,300
|
$16.90
-3.31%
|
12/3/2012
|
$15.20
|
PP = $16.31
|
|
MB = $17.13
|
Most Recent Note - 1/30/2013 2:11:51 PM
Y - Consolidating in a tight range above support at its 50 DMA line and trading just above its pivot point. Subsequent losses leading to a damaging violation and a slump below the recent low ($15.74 on 1/18/13) would raise concerns and trigger technical sell signals.
>>> The latest Featured Stock Update with an annotated graph appeared on 1/15/2013. Click here.
View all notes |
Alert me of new notes |
CANSLIM.net Company Profile |
SEC |
Zacks Reports |
StockTalk |
News |
Chart |
Request a new note
C
A N
S L
I M
|
CMCSA
-
NASDAQ
Comcast Corp Cl A
MEDIA - CATV Systems
|
$39.03
|
-0.08
-0.20% |
$39.34
|
15,038,040
134.87% of 50 DAV
50 DAV is 11,149,800
|
$40.28
-3.10%
|
12/3/2012
|
$37.08
|
PP = $38.06
|
|
MB = $39.96
|
Most Recent Note - 1/29/2013 6:13:47 PM
Y - Encountering recent distributional pressure yet still consolidating above its pivot point and below its "max buy" level, perched only -2.9% off its 52-week high with no resistance remaining due to overhead supply. See the latest FSU analysis for more details and a new annotated graph.
>>> The latest Featured Stock Update with an annotated graph appeared on 1/29/2013. Click here.
View all notes |
Alert me of new notes |
CANSLIM.net Company Profile |
SEC |
Zacks Reports |
StockTalk |
News |
Chart |
Request a new note
C
A N
S L
I M
|
KORS
-
NYSE
Michael Kors Hldgs Ltd
RETAIL - Apparel Stores
|
$56.32
|
-1.15
-2.00% |
$57.52
|
3,847,851
112.08% of 50 DAV
50 DAV is 3,433,100
|
$60.00
-6.13%
|
1/23/2013
|
$54.98
|
PP = $58.72
|
|
MB = $61.66
|
Most Recent Note - 1/30/2013 2:08:03 PM
Y - Hovering near its high since a "negative reversal" after touching a new 52-week high on 1/28/13, and it recently tallied gains with ever-increasing volume as it approached its 52-week high and pivot point. Disciplined investors may watch for volume-driven gains above the pivot point to trigger a proper technical buy signal before taking action. See the latest FSU analysis under the headline, "High-Ranked Luxury Apparel Firm Worthy For Watchlist - Wednesday, January 23, 2013", for more details and an annotated weekly graph.
>>> The latest Featured Stock Update with an annotated graph appeared on 1/23/2013. Click here.
View all notes |
Alert me of new notes |
CANSLIM.net Company Profile |
SEC |
Zacks Reports |
StockTalk |
News |
Chart |
Request a new note
C
A N
S L
I M
|
MIDD
-
NASDAQ
Middleby Corp
MANUFACTURING - Diversified Machinery
|
$140.61
|
-3.68
-2.55% |
$144.71
|
90,122
102.53% of 50 DAV
50 DAV is 87,900
|
$144.70
-2.83%
|
10/8/2012
|
$118.46
|
PP = $122.67
|
|
MB = $128.80
|
Most Recent Note - 1/30/2013 5:57:49 PM
G - Pulled back from all-time highs today after getting extended from any sound base. See the latest FSU analysis for more details and a new annotated graph.
>>> The latest Featured Stock Update with an annotated graph appeared on 1/30/2013. Click here.
View all notes |
Alert me of new notes |
CANSLIM.net Company Profile |
SEC |
Zacks Reports |
StockTalk |
News |
Chart |
Request a new note
C
A N
S L
I M
|
Symbol/Exchange
Company Name
Industry Group |
PRICE |
CHANGE
(%Change) |
Day High |
Volume
(% DAV)
(% 50 day avg vol) |
52 Wk Hi
% From Hi |
Featured
Date |
Price
Featured |
Pivot Featured |
|
Max Buy |
N
-
NYSE
Netsuite Inc
DIVERSIFIED SERVICES - Business/Management Services
|
$68.95
|
-0.09
-0.13% |
$69.83
|
151,968
43.54% of 50 DAV
50 DAV is 349,000
|
$71.51
-3.58%
|
12/12/2012
|
$64.75
|
PP = $67.12
|
|
MB = $70.48
|
Most Recent Note - 1/25/2013 4:18:10 PM
G - Gain today lifted it above its "max buy" level and its color code is changed to green. Recent gains above its pivot point were marked by sub par volume, still leaving questions concerning the level of institutional buying demand lurking.
>>> The latest Featured Stock Update with an annotated graph appeared on 1/18/2013. Click here.
View all notes |
Alert me of new notes |
CANSLIM.net Company Profile |
SEC |
Zacks Reports |
StockTalk |
News |
Chart |
Request a new note
C
A N
S L
I M
|
NP
-
NYSE
Neenah Paper Inc
CONSUMER NON-DURABLES - Paper and Paper Products
|
$30.11
|
-1.12
-3.59% |
$31.28
|
142,948
192.39% of 50 DAV
50 DAV is 74,300
|
$32.57
-7.55%
|
1/25/2013
|
$31.80
|
PP = $31.76
|
|
MB = $33.35
|
Most Recent Note - 1/30/2013 2:00:01 PM
Y - Retreating further below its pivot point with today's loss. Its "negative reversal" for a loss on heavy volume after hitting a new 52-week high on 1/25/13 was noted as a worrisome sign of distributional pressure as it failed to finish strong and did not clinch a technical buy signal See the latest FSU analysis for more details and annotated daily and weekly graphs.
>>> The latest Featured Stock Update with an annotated graph appeared on 1/25/2013. Click here.
View all notes |
Alert me of new notes |
CANSLIM.net Company Profile |
SEC |
Zacks Reports |
StockTalk |
News |
Chart |
Request a new note
C
A N
S L
I M
|
NSR
-
NYSE
Neustar Inc
TELECOMMUNICATIONS - Diversified Communication Serv
|
$45.00
|
-0.04
-0.09% |
$45.30
|
400,785
99.52% of 50 DAV
50 DAV is 402,700
|
$45.49
-1.08%
|
12/11/2012
|
$41.85
|
PP = $41.41
|
|
MB = $43.48
|
Most Recent Note - 1/30/2013 2:14:39 PM
G - Perched near its 52-week high today and poised for a best-ever close while on track for a 6th consecutive small gain. Its 50 DMA line defines near-term support.
>>> The latest Featured Stock Update with an annotated graph appeared on 1/16/2013. Click here.
View all notes |
Alert me of new notes |
CANSLIM.net Company Profile |
SEC |
Zacks Reports |
StockTalk |
News |
Chart |
Request a new note
C
A N
S L
I M
|
RAX
-
NYSE
Rackspace Hosting Inc
INTERNET - Internet Software and; Services
|
$74.36
|
-0.50
-0.67% |
$75.10
|
1,235,343
108.04% of 50 DAV
50 DAV is 1,143,400
|
$81.36
-8.60%
|
12/18/2012
|
$71.88
|
PP = $70.10
|
|
MB = $73.61
|
Most Recent Note - 1/29/2013 12:40:35 PM
G - Its 50 DMA line (now $71.79) defines near-term support to watch while consolidating after recent gains. Gapped down today for a loss on higher volume indicating distributional pressure while retreating from the new all-time high hit last week with a volume-driven gain. Last noted on 1/24/13 with caution - "It is extended from the previously noted base. Company will announce its fourth quarter 2012 financial results on Tuesday, February 12, 2013 after the close."
>>> The latest Featured Stock Update with an annotated graph appeared on 1/22/2013. Click here.
View all notes |
Alert me of new notes |
CANSLIM.net Company Profile |
SEC |
Zacks Reports |
StockTalk |
News |
Chart |
Request a new note
C
A N
S L
I M
|
RNF
-
NYSE
Rentech Nitrogen Ptnr Lp
CHEMICALS - Agricultural Chemicals
|
$48.18
|
+0.71
1.50% |
$48.80
|
276,346
86.79% of 50 DAV
50 DAV is 318,400
|
$48.19
-0.02%
|
11/1/2012
|
$39.11
|
PP = $40.15
|
|
MB = $42.16
|
Most Recent Note - 1/30/2013 2:04:03 PM
G - Wedging higher today with lackluster volume behind its gain while inching further into new 52-week high territory. Extended from its prior base, its prior highs and 50 DMA line coincide in the $40 area defining important chart support.
>>> The latest Featured Stock Update with an annotated graph appeared on 1/24/2013. Click here.
View all notes |
Alert me of new notes |
CANSLIM.net Company Profile |
SEC |
Zacks Reports |
StockTalk |
News |
Chart |
Request a new note
C
A N
S L
I M
|
Symbol/Exchange
Company Name
Industry Group |
PRICE |
CHANGE
(%Change) |
Day High |
Volume
(% DAV)
(% 50 day avg vol) |
52 Wk Hi
% From Hi |
Featured
Date |
Price
Featured |
Pivot Featured |
|
Max Buy |
VRX
-
NYSE
Valeant Pharmaceuticals
DRUGS - Drug Manufacturers - Other
|
$66.17
|
+0.32
0.49% |
$67.13
|
2,312,277
152.97% of 50 DAV
50 DAV is 1,511,600
|
$66.33
-0.24%
|
12/20/2012
|
$60.24
|
PP = $61.21
|
|
MB = $64.27
|
Most Recent Note - 1/30/2013 2:05:33 PM
G - It is extended from a sound base and perched at its high today. Recently rallying further above its "max buy" level to new 52-week highs without great volume conviction behind its gains.
>>> The latest Featured Stock Update with an annotated graph appeared on 1/28/2013. Click here.
View all notes |
Alert me of new notes |
CANSLIM.net Company Profile |
SEC |
Zacks Reports |
StockTalk |
News |
Chart |
Request a new note
C
A N
S L
I M
|
|
|
|
THESE ARE NOT BUY RECOMMENDATIONS!
Comments contained in the body of this report are technical
opinions only. The material herein has been obtained
from sources believed to be reliable and accurate, however,
its accuracy and completeness cannot be guaranteed.
This site is not an investment advisor, hence it does
not endorse or recommend any securities or other investments.
Any recommendation contained in this report may not
be suitable for all investors and it is not to be deemed
an offer or solicitation on our part with respect to
the purchase or sale of any securities. All trademarks,
service marks and trade names appearing in this report
are the property of their respective owners, and are
likewise used for identification purposes only.
This report is a service available
only to active Paid Premium Members.
You may opt-out of receiving report notifications
at any time. Questions or comments may be submitted
by writing to Premium Membership Services 665 S.E. 10 Street, Suite 201 Deerfield Beach, FL 33441-5634 or by calling 1-800-965-8307
or 954-785-1121.
|
|
|

