You are not logged in.
This means you
CAN ONLY VIEW reports that were published prior to Monday, April 14, 2025.
You
MUST UPGRADE YOUR MEMBERSHIP if you want to see any current reports.
AFTER MARKET UPDATE - TUESDAY, JANUARY 29TH, 2013
Previous After Market Report Next After Market Report >>>
|
|
|
|
DOW |
+72.49 |
13,954.42 |
+0.52% |
|
Volume |
718,931,390 |
+11% |
|
Volume |
1,909,666,560 |
+6% |
|
NASDAQ |
-0.64 |
3,153.66 |
-0.02% |
|
Advancers |
1,746 |
56% |
|
Advancers |
1,345 |
52% |
|
S&P 500 |
+7.66 |
1,507.84 |
+0.51% |
|
Decliners |
1,249 |
40% |
|
Decliners |
1,102 |
42% |
|
Russell 2000 |
+0.60 |
907.31 |
+0.07% |
|
52 Wk Highs |
303 |
|
|
52 Wk Highs |
181 |
|
|
S&P 600 |
+0.42 |
508.25 |
+0.08% |
|
52 Wk Lows |
10 |
|
|
52 Wk Lows |
9 |
|
|
 |
Markets Finish Mostly Higher With Positive Bias
Kenneth J. Gruneisen - Passed the CAN SLIM® Master's Exam
The major averages ended mostly higher on Tuesday. The volume totals were reported higher on the NYSE and on the Nasdaq exchange. Breadth was positive as advancers led decliners by almost a 3-2 margin on the NYSE and by a narrower 7-6 margin on the Nasdaq exchange. The total number of stocks hitting new 52-week highs easily outnumbered new 52-week lows on the NYSE and on the Nasdaq exchange. There were 66 high-ranked companies from the CANSLIM.net Leaders List making new 52-week highs and appearing on the CANSLIM.net BreakOuts Page, down from the prior session total of 98 stocks. There were gains for 7 of the 11 high-ranked companies currently included on the Featured Stocks Page.
The major averages rose as generally positive corporate earnings results offset a disappointing January consumer confidence report. Investors were cautious as the Federal Reserve kicked off its two-day policy meeting. Economic data was mixed, with the Case-Shiller index showing gradual improvement in housing prices, and January consumer confidence falling more than expected.
Eight of the 10 sectors on the S&P ended higher. Energy was the best performing group with Valero Energy Corp (VLO +12.78%) rallying for a big gain on its quarterly results. Health care also outperformed with Eli Lilly and Co (LLY +3.19%) rising following a better-than-expected fourth-quarter report. On the downside, Ford Motor Co (F -4.64%) fell despite lifting its first-quarter sales expectations as the company warned of a bigger-than-expected loss in its European operations. Yahoo! Inc (YHOO -3.00%) reversed earlier gains to finish the session lower following their positive report. Shares of VMware Inc (VMW -21.54%) dove after providing a weaker-than-expected revenue forecast.
Turning to fixed income markets, Treasuries were lower along the curve. The benchmark 10-year note was down 9/32 to yield 2.00% and the 30-year bond was off 17/32 to yield 3.18%.
The latest rally has produced a few action worthy candidates meeting all of the fact-based investment system's criteria. Selectivity and discipline are required, as always. Investors may consider new buying efforts in stocks meeting all key criteria, as the market's (M criteria) confirmed uptrend has been comprised by great leadership (stocks hitting new 52-week highs) in the broader market. Widespread gains helped all of the major averages blast higher, and the benchmark S&P 500 Index is perched at its best level in more than five years and -4.4% off its October 2007 all-time high.
Watch for an announcement via email concerning the next WEBCAST. The webcast will also be available via an updated link highlighted at the top of the Premium Member Homepage.
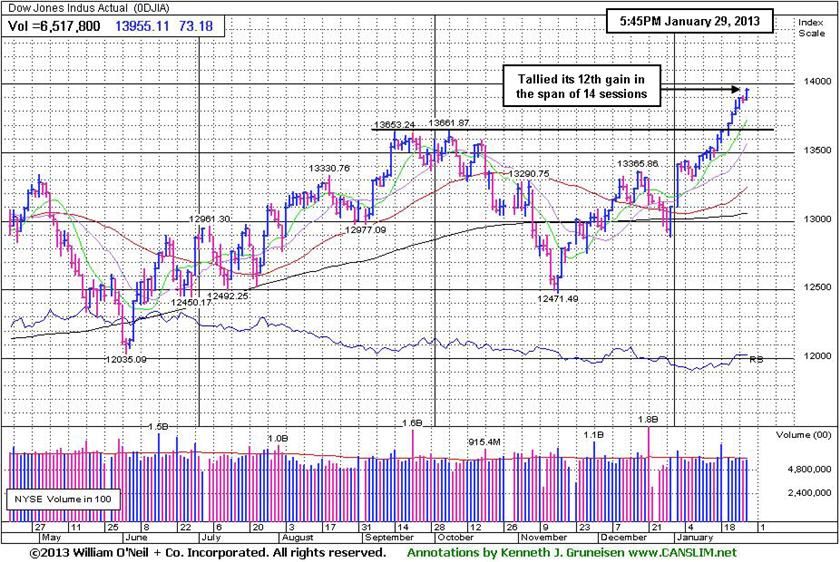
PICTURED: The Dow Jones Industrial Average has tallied 12 gains in the span of 14 trading sessions while rallying above its 2012 highs for new recovery highs. It is now perched only -1.7% off its all-time high from October 2007 of 14,198.
|
 Kenneth J. Gruneisen started out as a licensed stockbroker in August 1987, a couple of months prior to the historic stock market crash that took the Dow Jones Industrial Average down -22.6% in a single day. He has published daily fact-based fundamental and technical analysis on high-ranked stocks online for two decades. Through FACTBASEDINVESTING.COM, Kenneth provides educational articles, news, market commentary, and other information regarding proven investment systems that work in good times and bad.
Comments contained in the body of this report are technical opinions only and are not necessarily those of Gruneisen Growth Corp. The material herein has been obtained from sources believed to be reliable and accurate, however, its accuracy and completeness cannot be guaranteed. Our firm, employees, and customers may effect transactions, including transactions contrary to any recommendation herein, or have positions in the securities mentioned herein or options with respect thereto. Any recommendation contained in this report may not be suitable for all investors and it is not to be deemed an offer or solicitation on our part with respect to the purchase or sale of any securities. |
|
 |
Commodity-Linked Groups and Broker/Dealer Index Led Gainers
Kenneth J. Gruneisen - Passed the CAN SLIM® Master's Exam
The Broker/Dealer Index ($XBD +1.51%) posted a solid gain but the Bank Index ($BKX +0.06%) finished flat. The Gold & Silver Index ($XAU +1.68%) led the defensive groups higher while the Healthcare Index ($HMO +0.21%) posted a smaller gain. The Integrated Oil Index ($XOI +2.70%) outpaced the Oil Services Index ($OSX +0.66%) as energy-related shares rose. Weakness in the Networking Index ($NWX -2.40%) led the tech sector lower while the Internet Index ($IIX -0.97%) and the Semiconductor Index ($SOX -0.69%) ended with smaller losses and the Biotechnology Index ($BTK +0.03%) finished flat. The Retail Index ($RLX -0.44%) also sputtered, limiting the major averages' ability to rally.
Charts courtesy www.stockcharts.com
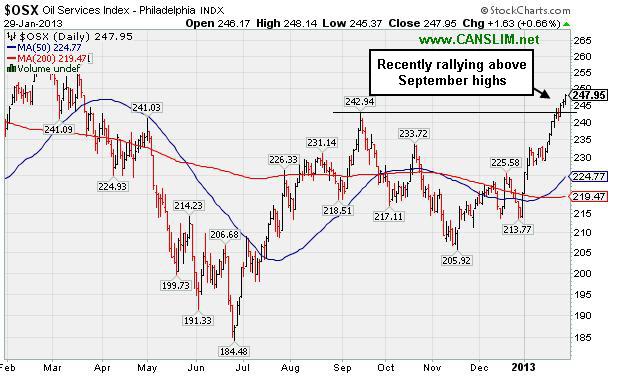
PICTURED: The Oil Services Index ($OSX +0.66%) has been recently rallying above its September highs.
| Oil Services |
$OSX |
247.95 |
+1.63 |
+0.66% |
+12.62% |
| Healthcare |
$HMO |
2,689.13 |
+5.58 |
+0.21% |
+6.96% |
| Integrated Oil |
$XOI |
1,368.50 |
+35.93 |
+2.70% |
+10.20% |
| Semiconductor |
$SOX |
413.28 |
-2.88 |
-0.69% |
+7.61% |
| Networking |
$NWX |
241.68 |
-5.93 |
-2.40% |
+6.68% |
| Internet |
$IIX |
354.54 |
-3.46 |
-0.97% |
+8.42% |
| Broker/Dealer |
$XBD |
104.04 |
+1.55 |
+1.51% |
+10.30% |
| Retail |
$RLX |
702.20 |
-3.10 |
-0.44% |
-38.41% |
| Gold & Silver |
$XAU |
151.72 |
+2.51 |
+1.68% |
-8.38% |
| Bank |
$BKX |
53.92 |
+0.03 |
+0.06% |
+5.15% |
| Biotech |
$BTK |
1,675.85 |
+0.57 |
+0.03% |
+8.33% |
|
|
|
 |
Distributional Pressure After Wedging Higher Following Breakout
Kenneth J. Gruneisen - Passed the CAN SLIM® Master's Exam
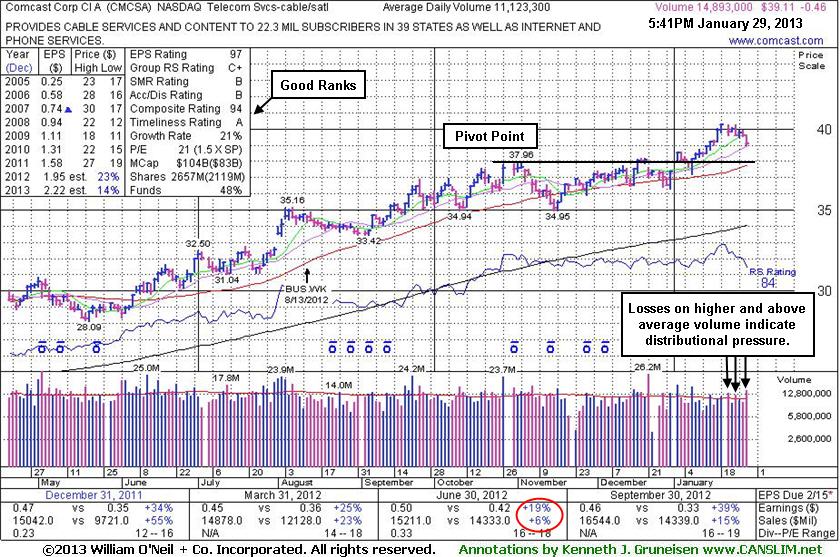
Comcast Corp Cl A (CMCSA -$0.46 or -1.16% to $39.11) pulled back today for another small loss with above average volume. Recent action has been indicative of some mild distributional pressure, as illustrated on the annotated graph below. It is still perched only -2.9% off its 52-week high, however, and free to rally unhindered by resistance due to overhead supply. Its rally above its pivot point on 1/02/13 had sufficient volume to trigger a technical buy signal.
Comcast wedged higher without great volume conviction behind gains since last shown in this FSU section on 1/11/13 with an annotated graph under the headline "Stalled After Latest Breakout Gain With Sufficient Volume". It had managed an impressive "positive reversal" on 1/08/13 for a gain on higher volume after dipping near its 50-day moving average (DMA) line intra-day. Closely coinciding with that important short-term average now, the prior highs in the $38 area help define chart support to watch on pullbacks.
The high-ranked Telecom Services - Cable/Satellite firm reported earnings +39% on +15% sales revenues for the Sep '12 quarter, above the fact-based investment system's +25% minimum guideline for the C criteria, a reassuring follow-up to the previously noted sub par quarter (see red circle). It has earned good ranks. Its annual earnings (A criteria) history has been strong and leadership from other firms in the industry group is a reassuring sign concerning the L criteria. The number of top-rated funds owning its shares rose from 1,916 in Jun '11 to 2,229 in Dec '12, a reassuring sign concerning the I criteria. Its huge supply of 2.097 billion shares in the float could make it less likely to be a great sprinter, meanwhile, the S criteria calls for investors to usually look at small-cap or mid-cap companies.
|
|
|
Color Codes Explained :
Y - Better candidates highlighted by our
staff of experts.
G - Previously featured
in past reports as yellow but may no longer be buyable under the
guidelines.
***Last / Change / Volume data in this table is the closing quote data***
Symbol/Exchange
Company Name
Industry Group |
PRICE |
CHANGE
(%Change) |
Day High |
Volume
(% DAV)
(% 50 day avg vol) |
52 Wk Hi
% From Hi |
Featured
Date |
Price
Featured |
Pivot Featured |
|
Max Buy |
CELG
-
NASDAQ
Celgene Corp
DRUGS - Drug Manufacturers - Major
|
$99.20
|
+0.25
0.25% |
$99.59
|
2,475,430
67.31% of 50 DAV
50 DAV is 3,677,600
|
$100.12
-0.92%
|
12/11/2012
|
$82.24
|
PP = $81.34
|
|
MB = $85.41
|
Most Recent Note - 1/24/2013 2:59:35 PM
G - Hovering in a tight range near its all-time high, very extended from its prior base. See the recent Featured Stock Update (FSU) analysis for the latest annotated graph and more details under the headline, "Rule Suggests Letting Explosive Winners Have Time For Greater Gains - Thursday, January 17, 2013 ".
>>> The latest Featured Stock Update with an annotated graph appeared on 1/17/2013. Click here.
View all notes |
Alert me of new notes |
CANSLIM.net Company Profile |
SEC |
Zacks Reports |
StockTalk |
News |
Chart |
Request a new note
C
A N
S L
I M


|
CFNL
-
NASDAQ
Cardinal Financial Corp
BANKING - Regional - Southeast Banks
|
$16.47
|
+0.17
1.04% |
$16.55
|
159,562
71.30% of 50 DAV
50 DAV is 223,800
|
$16.90
-2.54%
|
12/3/2012
|
$15.20
|
PP = $16.31
|
|
MB = $17.13
|
Most Recent Note - 1/24/2013 3:04:06 PM
Y - Found support at its 50 DMA line recently. That important short-term average acted as support throughout its ongoing ascent. Subsequent losses leading to a damaging violation and a slump below the recent low ($15.74 on 1/18/13) would raise concerns and trigger technical sell signals.
>>> The latest Featured Stock Update with an annotated graph appeared on 1/15/2013. Click here.
View all notes |
Alert me of new notes |
CANSLIM.net Company Profile |
SEC |
Zacks Reports |
StockTalk |
News |
Chart |
Request a new note
C
A N
S L
I M
|
CMCSA
-
NASDAQ
Comcast Corp Cl A
MEDIA - CATV Systems
|
$39.11
|
-0.46
-1.16% |
$39.59
|
14,897,806
133.93% of 50 DAV
50 DAV is 11,123,300
|
$40.28
-2.90%
|
12/3/2012
|
$37.08
|
PP = $38.06
|
|
MB = $39.96
|
 Most Recent Note - 1/29/2013 6:13:47 PM
Y - Encountering recent distributional pressure yet still consolidating above its pivot point and below its "max buy" level, perched only -2.9% off its 52-week high with no resistance remaining due to overhead supply. See the latest FSU analysis for more details and a new annotated graph.
>>> The latest Featured Stock Update with an annotated graph appeared on 1/29/2013. Click here.
View all notes |
Alert me of new notes |
CANSLIM.net Company Profile |
SEC |
Zacks Reports |
StockTalk |
News |
Chart |
Request a new note
C
A N
S L
I M
|
KORS
-
NYSE
Michael Kors Hldgs Ltd
RETAIL - Apparel Stores
|
$57.47
|
-0.28
-0.48% |
$57.73
|
2,566,240
73.15% of 50 DAV
50 DAV is 3,508,300
|
$60.00
-4.22%
|
1/23/2013
|
$54.98
|
PP = $58.72
|
|
MB = $61.66
|
Most Recent Note - 1/28/2013 12:14:10 PM
Y - Touched a new 52-week high today but reversed into the red. Recently tallied gains with ever-increasing volume as it approached its 52-week high and pivot point. Disciplined investors may watch for volume-driven gains above the pivot point to trigger a proper technical buy signal before taking action. See the latest FSU analysis under the headline, "High-Ranked Luxury Apparel Firm Worthy For Watchlist - Wednesday, January 23, 2013", for more details and an annotated weekly graph.
>>> The latest Featured Stock Update with an annotated graph appeared on 1/23/2013. Click here.
View all notes |
Alert me of new notes |
CANSLIM.net Company Profile |
SEC |
Zacks Reports |
StockTalk |
News |
Chart |
Request a new note
C
A N
S L
I M
|
MIDD
-
NASDAQ
Middleby Corp
MANUFACTURING - Diversified Machinery
|
$144.29
|
+2.71
1.91% |
$144.61
|
84,588
96.78% of 50 DAV
50 DAV is 87,400
|
$144.70
-0.28%
|
10/8/2012
|
$118.46
|
PP = $122.67
|
|
MB = $128.80
|
Most Recent Note - 1/25/2013 4:16:32 PM
G - Rallied for a 6th consecutive gain today and further into new all-time high territory. Prior mid-day reports noted - "Disciplined investors may watch closely for sell signals if holding it and giving it a chance to produce more climactic gains. Its 50-day moving average (DMA) line defines near-term chart support to watch where any violation would trigger a technical sell signal." Earnings +23% on +18% sales for the Sep '12 quarter, below the +25% minimum earnings guideline (C criteria), raised concerns.
>>> The latest Featured Stock Update with an annotated graph appeared on 1/14/2013. Click here.
View all notes |
Alert me of new notes |
CANSLIM.net Company Profile |
SEC |
Zacks Reports |
StockTalk |
News |
Chart |
Request a new note
C
A N
S L
I M
|
Symbol/Exchange
Company Name
Industry Group |
PRICE |
CHANGE
(%Change) |
Day High |
Volume
(% DAV)
(% 50 day avg vol) |
52 Wk Hi
% From Hi |
Featured
Date |
Price
Featured |
Pivot Featured |
|
Max Buy |
N
-
NYSE
Netsuite Inc
DIVERSIFIED SERVICES - Business/Management Services
|
$69.04
|
-1.50
-2.13% |
$69.95
|
177,176
50.56% of 50 DAV
50 DAV is 350,400
|
$71.51
-3.46%
|
12/12/2012
|
$64.75
|
PP = $67.12
|
|
MB = $70.48
|
Most Recent Note - 1/25/2013 4:18:10 PM
G - Gain today lifted it above its "max buy" level and its color code is changed to green. Recent gains above its pivot point were marked by sub par volume, still leaving questions concerning the level of institutional buying demand lurking.
>>> The latest Featured Stock Update with an annotated graph appeared on 1/18/2013. Click here.
View all notes |
Alert me of new notes |
CANSLIM.net Company Profile |
SEC |
Zacks Reports |
StockTalk |
News |
Chart |
Request a new note
C
A N
S L
I M
|
NP
-
NYSE
Neenah Paper Inc
CONSUMER NON-DURABLES - Paper and Paper Products
|
$31.23
|
+0.22
0.71% |
$31.30
|
60,521
81.45% of 50 DAV
50 DAV is 74,300
|
$32.57
-4.11%
|
1/25/2013
|
$31.80
|
PP = $31.76
|
|
MB = $33.35
|
Most Recent Note - 1/25/2013 6:49:34 PM
Y - Its "negative reversal" for a loss on heavy volume after hitting a new 52-week high today was noted as is a worrisome sign of distributional pressure. It was highlighted in yellow with pivot point cited based on its 3/19/12 high plus 10 cents in the mid-day report while noted - "A strong close above its pivot point backed by at least +40% above average volume may clinch a technical buy signal. Recent gains lacked great volume conviction while wedging above previously stubborn resistance in the $31 area. Quarterly earnings increases above the +25% guideline satisfy the C criteria. Annual earnings (A criteria) have been improving steadily after a worrisome downturn in FY '08. Its small supply of 15.9 million shares could contribute to greater price volatility." See the latest FSU analysis for more details and annotated daily and weekly graphs.
>>> The latest Featured Stock Update with an annotated graph appeared on 1/25/2013. Click here.
View all notes |
Alert me of new notes |
CANSLIM.net Company Profile |
SEC |
Zacks Reports |
StockTalk |
News |
Chart |
Request a new note
C
A N
S L
I M
|
NSR
-
NYSE
Neustar Inc
TELECOMMUNICATIONS - Diversified Communication Serv
|
$45.04
|
+0.36
0.81% |
$45.12
|
496,279
122.96% of 50 DAV
50 DAV is 403,600
|
$45.49
-0.99%
|
12/11/2012
|
$41.85
|
PP = $41.41
|
|
MB = $43.48
|
Most Recent Note - 1/24/2013 2:55:30 PM
G - Volume totals have been cooling while consolidating well above its 50 DMA line defining chart support to watch. After hitting a new 52-week high on 1/17/13 there was a worrisome "negative reversal".
>>> The latest Featured Stock Update with an annotated graph appeared on 1/16/2013. Click here.
View all notes |
Alert me of new notes |
CANSLIM.net Company Profile |
SEC |
Zacks Reports |
StockTalk |
News |
Chart |
Request a new note
C
A N
S L
I M
|
RAX
-
NYSE
Rackspace Hosting Inc
INTERNET - Internet Software and; Services
|
$74.86
|
-3.54
-4.52% |
$76.95
|
1,831,026
161.18% of 50 DAV
50 DAV is 1,136,000
|
$81.36
-7.99%
|
12/18/2012
|
$71.88
|
PP = $70.10
|
|
MB = $73.61
|
Most Recent Note - 1/29/2013 12:40:35 PM
G - Its 50 DMA line (now $71.79) defines near-term support to watch while consolidating after recent gains. Gapped down today for a loss on higher volume indicating distributional pressure while retreating from the new all-time high hit last week with a volume-driven gain. Last noted on 1/24/13 with caution - "It is extended from the previously noted base. Company will announce its fourth quarter 2012 financial results on Tuesday, February 12, 2013 after the close."
>>> The latest Featured Stock Update with an annotated graph appeared on 1/22/2013. Click here.
View all notes |
Alert me of new notes |
CANSLIM.net Company Profile |
SEC |
Zacks Reports |
StockTalk |
News |
Chart |
Request a new note
C
A N
S L
I M
|
RNF
-
NYSE
Rentech Nitrogen Ptnr Lp
CHEMICALS - Agricultural Chemicals
|
$47.47
|
+0.75
1.61% |
$47.88
|
259,721
80.63% of 50 DAV
50 DAV is 322,100
|
$48.19
-1.49%
|
11/1/2012
|
$39.11
|
PP = $40.15
|
|
MB = $42.16
|
Most Recent Note - 1/24/2013 6:43:36 PM
G - Encountering more distributional pressure today with higher volume behind its loss. Prior highs in the $40 area define near-term support to watch. See the latest FSU analysis for more details and a new annotated graph.
>>> The latest Featured Stock Update with an annotated graph appeared on 1/24/2013. Click here.
View all notes |
Alert me of new notes |
CANSLIM.net Company Profile |
SEC |
Zacks Reports |
StockTalk |
News |
Chart |
Request a new note
C
A N
S L
I M
|
Symbol/Exchange
Company Name
Industry Group |
PRICE |
CHANGE
(%Change) |
Day High |
Volume
(% DAV)
(% 50 day avg vol) |
52 Wk Hi
% From Hi |
Featured
Date |
Price
Featured |
Pivot Featured |
|
Max Buy |
VRX
-
NYSE
Valeant Pharmaceuticals
DRUGS - Drug Manufacturers - Other
|
$65.85
|
+0.30
0.46% |
$66.33
|
1,604,883
106.55% of 50 DAV
50 DAV is 1,506,200
|
$65.94
-0.14%
|
12/20/2012
|
$60.24
|
PP = $61.21
|
|
MB = $64.27
|
Most Recent Note - 1/24/2013 5:58:48 PM
G - It is extended from a sound base and posted another small gain today, rallying further above its "max buy" level without great volume conviction.
>>> The latest Featured Stock Update with an annotated graph appeared on 1/28/2013. Click here.
View all notes |
Alert me of new notes |
CANSLIM.net Company Profile |
SEC |
Zacks Reports |
StockTalk |
News |
Chart |
Request a new note
C
A N
S L
I M
|
|
|
|
THESE ARE NOT BUY RECOMMENDATIONS!
Comments contained in the body of this report are technical
opinions only. The material herein has been obtained
from sources believed to be reliable and accurate, however,
its accuracy and completeness cannot be guaranteed.
This site is not an investment advisor, hence it does
not endorse or recommend any securities or other investments.
Any recommendation contained in this report may not
be suitable for all investors and it is not to be deemed
an offer or solicitation on our part with respect to
the purchase or sale of any securities. All trademarks,
service marks and trade names appearing in this report
are the property of their respective owners, and are
likewise used for identification purposes only.
This report is a service available
only to active Paid Premium Members.
You may opt-out of receiving report notifications
at any time. Questions or comments may be submitted
by writing to Premium Membership Services 665 S.E. 10 Street, Suite 201 Deerfield Beach, FL 33441-5634 or by calling 1-800-965-8307
or 954-785-1121.
|
|
|

