You are not logged in.
This means you
CAN ONLY VIEW reports that were published prior to Monday, April 14, 2025.
You
MUST UPGRADE YOUR MEMBERSHIP if you want to see any current reports.
AFTER MARKET UPDATE - FRIDAY, JANUARY 29TH, 2010
Previous After Market Report Next After Market Report >>>
|
|
|
|
DOW |
-53.13 |
10,067.33 |
-0.52% |
|
Volume |
1,579,978,030 |
+41% |
|
Volume |
3,167,701,610 |
+9% |
|
NASDAQ |
-31.65 |
2,147.35 |
-1.45% |
|
Advancers |
953 |
30% |
|
Advancers |
954 |
34% |
|
S&P 500 |
-10.66 |
1,073.87 |
-0.98% |
|
Decliners |
2,065 |
66% |
|
Decliners |
1,737 |
62% |
|
Russell 2000 |
-5.89 |
602.04 |
-0.97% |
|
52 Wk Highs |
54 |
|
|
52 Wk Highs |
38 |
|
|
S&P 600 |
-3.06 |
321.14 |
-0.94% |
|
52 Wk Lows |
7 |
|
|
52 Wk Lows |
22 |
|
|
 |
Distributional Pressure Drove Stocks Lower In January
Adam Sarhan, Contributing Writer,
Stocks ended the day, week, and first month of the new year lower as investors digested the latest round of tepid economic and earnings data. Volume totals on Friday were higher compared to the prior session on the Nasdaq exchange and on the NYSE. Decliners trumped advancers by over a 2-to-1 ratio on the NYSE and by near a 2-to-1 ratio on the Nasdaq exchange. There were 9 high-ranked companies from the CANSLIM.net Leaders List that made a new 52-week high and appeared on the CANSLIM.net BreakOuts Page, matching the 9 issues that appeared on the prior session. New 52-week highs still outnumbered new 52-week lows on the NYSE and on the Nasdaq exchange.
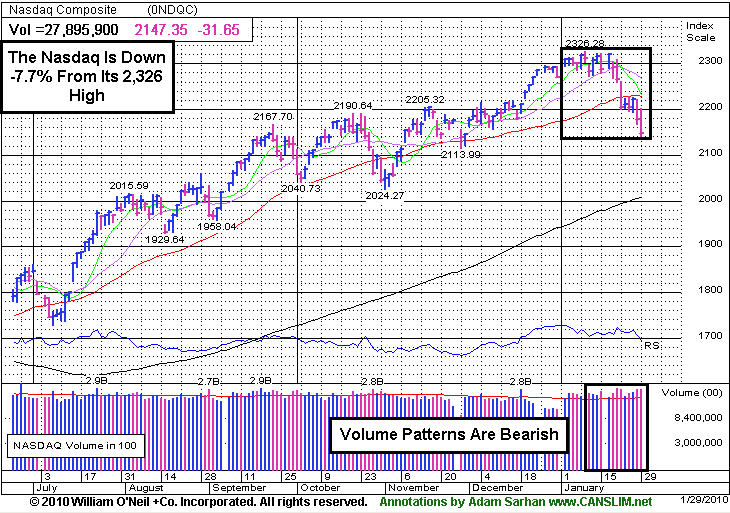
On Friday, January 22, US stocks ended their 46 week rally and entered a correction when all the major averages plunged below their respective 50-day moving average (DMA) lines. Since the March 2009 low, none of the major averages fell more than -10% from their post recovery highs which reiterates how strong this market actually is. Now that the market is in a correction again and the Nasdaq Composite Index is down approximately -8% below its recent high it will be very interesting to see if the bulls show up and quell the bearish pressure, or if the selling intensifies. It is important to note that even other developed markets overseas have performed rather well over the past 10 months. However, the Hang Seng Index, Hong Kong's stock market, fell -10% from its recent high which could drag the rest of the world markets lower.
The latest round of corporate earnings continues to top analysts' estimates but fails to impress Wall Street. In the last full week of January more than 130 companies in the benchmark S&P 500 reported their Q4 results, but stocks sold off. Barring some unforeseen event, earnings will have expanded nearly +70% and snapped a record nine-quarter earnings slump. Longstanding readers of this column know that in addition to analyzing the earnings numbers we pay equal, if not more, attention to how the market reacts to the numbers. So far, the reaction has been lackluster at best.
The latest round of economic data was also a disappointment. On Monday, a weaker than expected existing home sales report was released. The data showed that sales plunged in December even though home prices held steady during the month. Existing home sales skidded a whopping -16.7% for the largest monthly decline in over 40 years! Meanwhile, the annual rate of 5.45 million units fell short of the Street's estimate for 5.90 million.
Two important economic reports were released on Tuesday: the latest read on consumer confidence and the S&P Case/Shiller home price index. The Conference Board’s confidence index beat estimates and rose to55.9 largely due to a stronger labor market. This helped offset concerns that China's efforts to cool their booming economy will adversely affect the global economy and a disappointing report from the ailing housing market. The S&P/Case-Shiller home price index rose for a sixth straight month in 20 major US cities. The index rose +0.2% on a seasonally adjusted basis, but was down -5.3% from November 2008.
Stocks positively reversed on Wednesday after the Federal Reserve held rates steady and raised their outlook for 2010. In the after meeting commentary, the Fed said it believes "economic activity has continued to strengthen" since its last meeting in December. However, the Fed did not repeat its view that the housing market continues to improve. News on the economic front was less than stellar specifically in the ailing housing market. The Commerce Department said new-home sales plunged by -7.6% to an annual pace of 342,000 which is the lowest reading since March 2009! The report showed that for all of 2009, sales skidded -23% to 374,000 which was the lowest reading since records began in 1963. The negative housing data followed a string of weaker than expected reports released earlier this week.
Stocks reacted poorly to President Barack Obama’s first State of the Union address largely due to his plan to increase taxes on the upper class and his plan to end proprietary trading and hedge-fund investments at large banks. Some highlights from his speech were: “the worst of the storm has passed", we still face a "deficit of trust", while claiming that he is "not interested in punishing banks." For the past ten days, investors were concerned that Congress would not reconfirm Federal Reserve Chairman Ben S. Bernanke for another term. However, those concerns were allayed when Bernanke received enough votes for a second term. The economic data of the day was less than stellar. Durable goods missed estimates and experienced its largest decline in history in 2009! Elsewhere, investors were disconcerted to see that jobless claims fell -8,000 last week to 470,000 (prior week revised -4,000 lower to 478,000). It was somewhat encouraging to see the smoother four week average rise +9,500 to 456,250 for a second straight week but the overall report suggests that the jobs market is still weak.
Stocks ended lower on Friday even after the government said Q4 GDP rose +5.7%. The major averages all closed near their session lows while slipping further below their respective 50-day moving average (DMA) lines, which is not healthy action. Until the indices rally back above their short-term averages the technical damage remaining on the charts is a serious concern that prompts great caution. So far, the market's reaction has been tepid at best to the latest round of economic and earnings data. Remember that the recent series of distribution days coupled with the deleterious action in the major averages suggests large institutions are aggressively selling stocks. Disciplined investors will now wait for a new follow-through day to be produced before resuming any buying efforts. Until then, patience is key.
Professional Money Management Services - A Winning System - Inquire today!
Our skilled team of portfolio managers knows how to follow the rules of this fact-based investment system. We do not follow opinion or the "conviction list" of some large Wall Street institution which would have us fully invested even during horrific bear markets. Instead, we remain fluid and only buy the best stocks when they are triggering proper technical buy signals. If you are not completely satisfied with the way your portfolio is being managed, Click here to submit your inquiry. *Accounts over $250,000 please. ** Serious inquires only, please.
PICTURED: The Nasdaq Composite Index has fallen -7.7% from its January 11, 2010 high of 2,326.
|
|
|
 |
Financial Indexes Giving Mixed Signals
Kenneth J. Gruneisen - Passed the CAN SLIM® Master's Exam
The Gold & Silver Index ($XAU -3.58%) was smacked with a big loss on Friday, and energy shares' weakness weighed down the Oil Services Index ($OSX -1.76%) and the Integrated Oil Index ($XOI -1.00%). The Healthcare Index ($HMO -1.51%) was another defensive group that slumped, closing under its 50-day moving average line for the first time since early November. The Semiconductor Index ($SOX -3.42%) also fell hard for a second consecutive loss in the -3% range, meanwhile the Networking Index ($NWX -1.68%) and Internet Index ($IIX -1.26%) ended with smaller losses. The Retail Index ($RLX -0.22%) held up much better than most groups, and the Biotechnology Index ($BTK +0.54%) bucked the widely negative market action as it posted a small gain.
Longtime followers of this commentary know the importance that has continually been placed on following the action of stocks in the financial group, because the group is a reliable leading indicator. Rarely do the major averages get clobbered when financial shares are showing healthy action and strength. Right now, however, the two main financial indexes we routinely track are showing us mixed signals.
Charts courtesy www.stockcharts.com
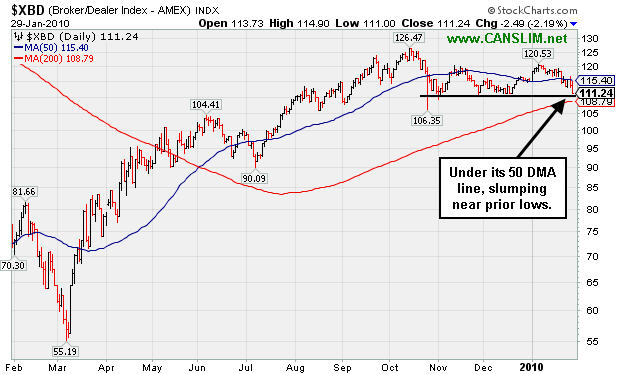
PICTURED 1: The Broker/Dealer Index ($XBD -2.19%) is currently struggling near prior chart lows after recently slumping below its 50-day moving average (DMA) line. A violation of recent chart lows could easily lead to more weakness and a test of its longer-term 200 DMA line appears somewhat likely in the near term. Since zigzagging above the 200 DMA line in May 2009 it has not revisited that important long-term average.
Charts courtesy www.stockcharts.com
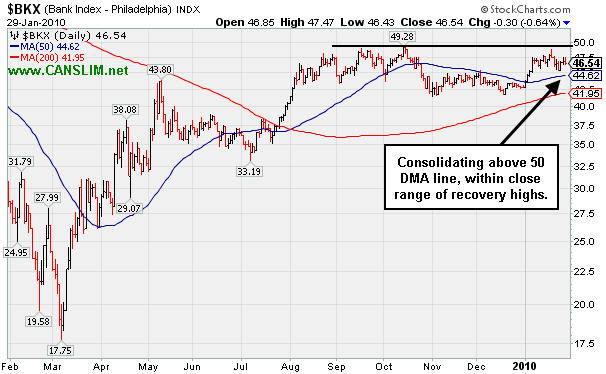
PICTURED 2: The Bank Index ($BKX -0.64%) is in much healthier shape, currently hovering above its 50 DMA line and in fairly close range of its recovery highs.
| Oil Services |
$OSX |
192.74 |
-3.46 |
-1.76% |
-1.12% |
| Healthcare |
$HMO |
1,451.61 |
-22.31 |
-1.51% |
-1.45% |
| Integrated Oil |
$XOI |
1,016.78 |
-10.31 |
-1.00% |
-4.81% |
| Semiconductor |
$SOX |
316.07 |
-11.18 |
-3.42% |
-12.18% |
| Networking |
$NWX |
221.48 |
-3.79 |
-1.68% |
-4.15% |
| Internet |
$IIX |
218.06 |
-2.79 |
-1.26% |
-6.76% |
| Broker/Dealer |
$XBD |
111.24 |
-2.49 |
-2.19% |
-3.31% |
| Retail |
$RLX |
397.48 |
-0.86 |
-0.22% |
-3.32% |
| Gold & Silver |
$XAU |
147.93 |
-5.49 |
-3.58% |
-12.08% |
| Bank |
$BKX |
46.54 |
-0.30 |
-0.64% |
+8.97% |
| Biotech |
$BTK |
964.34 |
+5.17 |
+0.54% |
+2.36% |
|
|
|
 |
Distributional Action Hurts Outlook
Kenneth J. Gruneisen - Passed the CAN SLIM® Master's Exam
AsiaInfo Holdings, Inc. (ASIA -$0.08 or -0.33% to $23.90) ended today's session with a small loss on heavy volume after it reported solid results again for the period ended December 31, 2009. Worrisome losses on higher volume have followed its half-hearted stand of 2 small gains on light volume which had halted a streak of 6 consecutive losses on higher volume. It was noted on 1/20/10 - "violating its 50-day moving average (DMA) line and breaching recent chart lows, raising concerns and triggering technical sell signals." Losses on heavy volume are signs of distributional pressure (institutional selling) that have caused greater technical damage since its last appearance in this FSU section on 1/12/10 under the headline "Recent Distributional Action Prompts Caution."
Prior chart lows and some earlier chart highs help to define an area of likely near-term support in the $22-23 area, but gains back above its 50 DMA line are needed for its outlook to improve. ASIA was featured 10/14/09 in the mid-day report (read here) as it gapped up for a new 52-week high with 5 times average volume, triggering a technical buy signal by blasting above its pivot point. It traded up as much as +68.13% since first featured in the August 2009 CANSLIM.net News (read here).

|
|
|
Color Codes Explained :
Y - Better candidates highlighted by our
staff of experts.
G - Previously featured
in past reports as yellow but may no longer be buyable under the
guidelines.
***Last / Change / Volume quote data in this table corresponds with the timestamp on the note***
Symbol/Exchange
Company Name
Industry Group |
Last |
Chg. |
Vol
% DAV |
Date Featured |
Price Featured |
Latest Pivot Point
Featured |
Status |
| Latest Max Buy Price |
ARST
-
|
$23.75
|
-1.09
|
367,900
72% DAV
509,000
|
12/22/2009
(Date
Featured) |
$25.94
(Price
Featured) |
PP = $27.20 |
G |
| MB = $28.56 |
Most Recent Note - 1/29/2010 5:41:15 PM
G - Today's 3rd consecutive loss on light volume led to a violation and close under its 50 DMA line as it sunk to a new January low. Distributional pressure negated its latest breakout. ARST was first featured in yellow at $19.91 in the 9/01/09 mid-day report with an annotated daily graph (read here).
>>> The latest Featured Stock Update with an annotated graph appeared on 1/21/2010. click here.
|
|
C
A
S
I |
News |
Chart |
SEC
View all notes Alert
me of new notes
Company
Profile
|
ASIA
-
|
$23.90
|
-0.08
|
2,620,471
208% DAV
1,261,700
|
12/24/2009
(Date
Featured) |
$31.05
(Price
Featured) |
PP = $32.40 |
G |
| MB = $34.02 |
Most Recent Note - 1/29/2010 6:18:13 PM
G - Small loss today on heavy volume after reporting strong earnings and sales for the latest quarter. Distributional action has been pressuring it toward an earlier pivot point after its latest breakout failed. Noted on 1/20/10 - "violating its 50-day moving average (DMA) line and breaching recent chart lows, raising concerns and triggering technical sell signals." Traded up as much as +68.13% since first featured in the August 2009 CANSLIM.net News (read here).
>>> The latest Featured Stock Update with an annotated graph appeared on 1/29/2010. click here.
|
|
C
A
S
I |
News |
Chart |
SEC
View all notes Alert
me of new notes
Company
Profile
|
BIDU
- NASDAQ
Baidu Inc Ads
INTERNET - Internet Information Providers
|
$411.71
|
-6.14
|
1,273,357
71% DAV
1,802,400
|
1/13/2010
(Date
Featured) |
$431.25
(Price
Featured) |
PP = $426.75 |
G |
| MB = $448.09 |
Most Recent Note - 1/29/2010 6:23:21 PM
G - Another loss today on below average volume, closing further below its 50 DMA line. Correction - Due to report earnings after the close on February 9th. Gaps down for considerable losses on 1/19 and 1/22 pressured it under its November '09 highs and violated its short-term average line, hurting its outlook after recently spiking to new all-time highs.
>>> The latest Featured Stock Update with an annotated graph appeared on 1/14/2010. click here.
|
|
C
A
S
I |
News |
Chart |
SEC
View all notes Alert
me of new notes
Company
Profile
|
CACC
- NASDAQ
Credit Acceptance Corp
FINANCIAL SERVICES - Credit Services
|
$53.22
|
+0.10
|
66,554
141% DAV
47,300
|
9/29/2009
(Date
Featured) |
$33.48
(Price
Featured) |
PP = $37.10 |
G |
| MB = $38.96 |
Most Recent Note - 1/29/2010 6:25:40 PM
G - Small gain today on heavier than average volume for a new all-time high close. Its current streak of 5 straight gains leaves it very extended from any sound base. Well above its 50 DMA line, an important support level to watch. On Monday Jan 25th the company announced the pricing of $250 Million Senior Secured Notes.
>>> The latest Featured Stock Update with an annotated graph appeared on 1/28/2010. click here.
|
|
C
A
S
I |
News |
Chart |
SEC
View all notes Alert
me of new notes
Company
Profile
|
CRM
- NYSE
Salesforce.com Inc
INTERNET - Internet Software & Services
|
$63.55
|
-0.61
|
1,570,233
80% DAV
1,973,900
|
12/18/2009
(Date
Featured) |
$67.32
(Price
Featured) |
PP = $67.82 |
G |
| MB = $71.21 |
Most Recent Note - 1/29/2010 6:27:32 PM
G - Edged lower today for a 3rd consecutive loss on below average volume, remaining below its 50 DMA line. Previously noted weakness triggered technical sell signals. A damaging gap down on 1/12/10 was noted as "indicative of institutional (I criteria) distribution."
>>> The latest Featured Stock Update with an annotated graph appeared on 1/27/2010. click here.
|
|
C
A
S
I |
News |
Chart |
SEC
View all notes Alert
me of new notes
Company
Profile
|
CTRP
- NASDAQ
Ctrip.com Intl Ltd Adr
LEISURE - Resorts & Casinos
|
$31.29
|
-1.69
|
2,727,284
135% DAV
2,022,100
|
1/14/2010
(Date
Featured) |
$36.67
(Price
Featured) |
PP = $39.35 |
G |
| MB = $41.32 |
Most Recent Note - 1/29/2010 6:30:35 PM
G - Considerable loss today on above average volume, diving toward its prior chart highs in the $31 area. Damaging losses previously violated its 50 DMA line and recent chart lows, triggering technical sell signals. Do not be confused by the 2:1 split effective as of 1/21/10. PP and Featured Price adjusted for split.
>>> The latest Featured Stock Update with an annotated graph appeared on 1/20/2010. click here.
|
|
C
A
S
I |
News |
Chart |
SEC
View all notes Alert
me of new notes
Company
Profile
|
GMCR
- NASDAQ
Green Mtn Coffee Roastrs
FOOD & BEVERAGE - Processed & Packaged Goods
|
$84.82
|
-2.78
|
2,037,747
137% DAV
1,492,300
|
12/28/2009
(Date
Featured) |
$77.49
(Price
Featured) |
PP = $76.50 |
G |
| MB = $80.33 |
Most Recent Note - 1/29/2010 6:34:02 PM
G - Today's loss erased a large part of its 1/28/10 gain after very strong earnings and sales increases for the quarter ended Dec 31, 2009. This outlier has been working against ugly market conditions (M criteria). Until a new follow-through day emerges from at least one of the major averages, the investment system rules discourage accumulating shares in any company. Recent chart lows in the $78 area are an important support level to watch now.
>>> The latest Featured Stock Update with an annotated graph appeared on 1/13/2010. click here.
|
|
C
A
S
I |
News |
Chart |
SEC
View all notes Alert
me of new notes
Company
Profile
|
ISRG
- NASDAQ
Intuitive Surgical Inc
HEALTH SERVICES - Medical Appliances & Equipment
|
$328.06
|
-6.95
|
644,398
127% DAV
506,100
|
1/22/2010
(Date
Featured) |
$340.40
(Price
Featured) |
PP = $314.00 |
Y |
| MB = $329.70 |
Most Recent Note - 1/29/2010 6:36:10 PM
Y - Loss today on higher volume led to a pullback and close under its "max buy" level for the first time since featured in yellow in the 1/22/10 mid-day report (read here). Its annual earnings history (the A criteria) has been very impressive. ISRG has rebounded impressively from its March low ($84.86) and may be on course for its all-time high ($359 in 2007). Notes outlined technical deterioration before and when it was last dropped from the Featured Stocks list on 6/10/08. ISRG traded up more than 13-fold since first featured in yellow in CANSLIM.net reports in the summer of 2004.
>>> The latest Featured Stock Update with an annotated graph appeared on 1/22/2010. click here.
|
|
C
A
S
I |
News |
Chart |
SEC
View all notes Alert
me of new notes
Company
Profile
|
LFT
-
|
$34.66
|
-1.38
|
3,548,782
741% DAV
478,600
|
11/17/2009
(Date
Featured) |
$31.77
(Price
Featured) |
PP = $33.04 |
G |
| MB = $34.69 |
Most Recent Note - 1/29/2010 6:38:57 PM
G - Gapped down today for a loss with very heavy volume. Still trading below its 50 DMA line while probing its prior chart highs in the $31-33 area which define the next technical support level. Due to report earnings on Wednesday, February 10 after the market close. Widespread weakness in China-based issues has clearly been a factor in recent days.
>>> The latest Featured Stock Update with an annotated graph appeared on 1/26/2010. click here.
|
|
C
A
S
I |
News |
Chart |
SEC
View all notes Alert
me of new notes
Company
Profile
|
PEGA
- NASDAQ
Pegasystems Inc
COMPUTER SOFTWARE & SERVICES - Business Software & Services
|
$33.25
|
-2.46
|
314,284
190% DAV
165,700
|
1/4/2010
(Date
Featured) |
$34.00
(Price
Featured) |
PP = $36.19 |
G |
| MB = $38.00 |
Most Recent Note - 1/29/2010 6:40:52 PM
G - A considerable loss today followed the previously noted negative reversal. It has completely negated its 1/27/10 breakout. Color code was changed to green based on distributional action and technical damage while it quickly dove back toward its 50 DMA line. That short-term average and recent chart lows near $32.50 define important technical support, where violations would trigger more worrisome sell signals. Negative market conditions (M criteria) are currently an overriding concern prompting great caution, since a follow-through day is still needed to confirm a new rally. After a hiatus from the Featured Stocks list, PEGA was featured again in the January 2010 issue of CANSLIM.net News (read here).
>>> The latest Featured Stock Update with an annotated graph appeared on 1/25/2010. click here.
|
|
C
A
S
I |
News |
Chart |
SEC
View all notes Alert
me of new notes
Company
Profile
|
VIT
-
|
$16.03
|
-1.69
|
601,847
102% DAV
588,700
|
12/24/2009
(Date
Featured) |
$20.07
(Price
Featured) |
PP = $21.17 |
G |
| MB = $22.23 |
Most Recent Note - 1/29/2010 6:42:03 PM
G - Considerable loss today with average volume, slumping back to $16.00, perfectly matching its 11/19/09 low. The 1/22/10 violation of its 50 DMA line triggered a technical sell signal. Distributional pressure raised concerns as it abruptly reversed under its pivot point following its big 1/06/10 gain on heavy volume and 1/11/10 gain on +36% above average volume.
>>> The latest Featured Stock Update with an annotated graph appeared on 1/11/2010. click here.
|
|
C
A
S
I |
News |
Chart |
SEC
View all notes Alert
me of new notes
Company
Profile
|
|
|
|
THESE ARE NOT BUY RECOMMENDATIONS!
Comments contained in the body of this report are technical
opinions only. The material herein has been obtained
from sources believed to be reliable and accurate, however,
its accuracy and completeness cannot be guaranteed.
This site is not an investment advisor, hence it does
not endorse or recommend any securities or other investments.
Any recommendation contained in this report may not
be suitable for all investors and it is not to be deemed
an offer or solicitation on our part with respect to
the purchase or sale of any securities. All trademarks,
service marks and trade names appearing in this report
are the property of their respective owners, and are
likewise used for identification purposes only.
This report is a service available
only to active Paid Premium Members.
You may opt-out of receiving report notifications
at any time. Questions or comments may be submitted
by writing to Premium Membership Services 665 S.E. 10 Street, Suite 201 Deerfield Beach, FL 33441-5634 or by calling 1-800-965-8307
or 954-785-1121.
|
|
|


