***Last / Change / Volume data in this table is the closing quote data***
Symbol/Exchange
Company Name
Industry Group |
PRICE |
CHANGE
(%Change) |
Day High |
Volume
(% DAV)
(% 50 day avg vol) |
52 Wk Hi
% From Hi |
Featured
Date |
Price
Featured |
Pivot Featured |
|
Max Buy |
ARUN
-
NASDAQ
Aruba Networks Inc
COMPUTER HARDWARE - Networking andamp; Communication Dev
|
$21.33
|
-0.78
-3.53% |
$22.29
|
2,163,992
78.59% of 50 DAV
50 DAV is 2,753,500
|
$26.00
-17.96%
|
1/3/2011
|
$22.55
|
PP = $24.38
|
|
MB = $25.60
|
 Most Recent Note - 1/28/2011 4:24:06 PM
G - After damaging losses it has been quietly consolidating above prior lows in the $20.50 area that define chart support to watch above its 200 DMA line. Gains above its 50 DMA line are needed for its outlook to improve. Based on weak action it will be dropped from the Featured Stocks list tonight. See the latest FSU analysis for more details and an annotated graph.
>>> The latest Featured Stock Update with an annotated graph appeared on 1/24/2011. Click here.
View all notes |
Alert me of new notes |
CANSLIM.net Company Profile |
SEC |
Zacks Reports |
StockTalk |
News |
Chart |
Request a new note
C
A N
S L
I M


|
CCME
-
NASDAQ
China Mediaexpress Hldgs
FINANCIAL SERVICES - Diversified Investments
|
$20.86
|
-1.95
-8.55% |
$23.97
|
5,999,952
442.34% of 50 DAV
50 DAV is 1,356,400
|
$23.15
-9.89%
|
1/27/2011
|
$22.37
|
PP = $21.50
|
|
MB = $22.58
|
Most Recent Note - 1/28/2011 4:31:47 PM
Y - Following early gains for a new 52-week high today a negative reversal on higher volume led to a close below its pivot point while it erased a big part of the prior session's considerable gain. Its 1/27/11 breakout from a cup-with-handle type base with more than 4 times average volume triggered a technical buy signal. In the mid-day report on 1/27/11 it was highlighted in yellow with an annotated graph as the pivot point cited was based on its 1/14/11 high plus ten cents.

There are no Featured Stock Updates™ available for this stock at this time. You may request one by clicking the Request a New Note link below
View all notes |
Alert me of new notes |
CANSLIM.net Company Profile |
SEC |
Zacks Reports |
StockTalk |
News |
Chart |
Request a new note
C
A N
S L
I M
|
CIS
-
NYSE
Camelot Info Systems Ads
COMPUTER SOFTWARE andamp; SERVICES - Information Technology Service
|
$24.08
|
-1.26
-4.97% |
$25.50
|
278,975
58.04% of 50 DAV
50 DAV is 480,700
|
$28.18
-14.55%
|
11/26/2010
|
$18.93
|
PP = $19.72
|
|
MB = $20.71
|
Most Recent Note - 1/28/2011 4:32:27 PM
G - Slumped below prior highs in the $25 area without great volume conviction behind today's loss. Still in healthy shape, technically, and well above chart support at its 50 DMA line.
>>> The latest Featured Stock Update with an annotated graph appeared on 1/11/2011. Click here.
View all notes |
Alert me of new notes |
CANSLIM.net Company Profile |
SEC |
Zacks Reports |
StockTalk |
News |
Chart |
Request a new note
C
A N
S L
I M
|
CRUS
-
NASDAQ
Cirrus Logic Inc
ELECTRONICS - Semiconductor - Specialized
|
$20.72
|
-0.57
-2.68% |
$21.72
|
8,980,807
273.97% of 50 DAV
50 DAV is 3,278,000
|
$21.44
-3.36%
|
1/28/2011
|
$20.69
|
PP = $19.17
|
|
MB = $20.13
|
Most Recent Note - 1/28/2011 4:34:36 PM
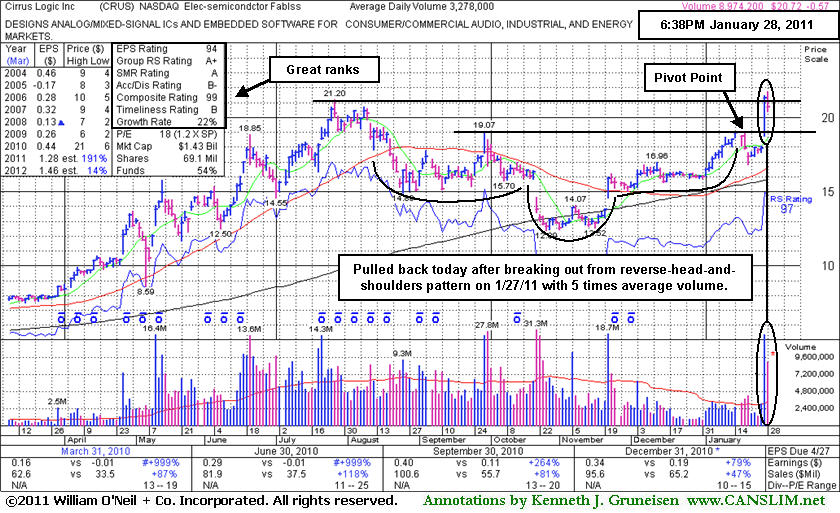
Y - Reversed into the red while churning heavy volume today following a considerable breakout gain on 1/27/11, rising from a bullish reverse-head-and-shoulders type pattern and reaching new 52-week highs. Color code was changed to yellow with pivot point cited based on its 1/19/11 high plus ten cents. It found support near its 200 DMA line during its deep consolidation since noted in the mid-day report on 7/23/10 with cautionary remarks. Quarterly sales revenues and earnings increases in quarterly comparisons versus the year ago period have shown impressive increases. Its annual earnings (A criteria) history was up and down in the past, but strong in FY '09 and '10.
There are no Featured Stock Updates™ available for this stock at this time. You may request one by clicking the Request a New Note link below
View all notes |
Alert me of new notes |
CANSLIM.net Company Profile |
SEC |
Zacks Reports |
StockTalk |
News |
Chart |
Request a new note
C
A N
S L
I M
|
DECK
-
NASDAQ
Deckers Outdoor Corp
CONSUMER NON-DURABLES - Textile - Apparel Footwear
|
$74.41
|
-2.21
-2.88% |
$76.98
|
925,035
48.28% of 50 DAV
50 DAV is 1,915,900
|
$87.88
-15.33%
|
10/27/2010
|
$54.16
|
PP = $54.86
|
|
MB = $57.60
|
Most Recent Note - 1/28/2011 4:35:57 PM
G - Consolidating quietly below its 50 DMA line, and that short term average may now act as resistance. See the latest FSU article for detailed analysis and an annotated graph.
>>> The latest Featured Stock Update with an annotated graph appeared on 1/26/2011. Click here.
View all notes |
Alert me of new notes |
CANSLIM.net Company Profile |
SEC |
Zacks Reports |
StockTalk |
News |
Chart |
Request a new note
C
A N
S L
I M
|
Symbol/Exchange
Company Name
Industry Group |
PRICE |
CHANGE
(%Change) |
Day High |
Volume
(% DAV)
(% 50 day avg vol) |
52 Wk Hi
% From Hi |
Featured
Date |
Price
Featured |
Pivot Featured |
|
Max Buy |
EZCH
-
NASDAQ
Ezchip Semiconductor Ltd
ELECTRONICS - Semiconductor - Specialized
|
$29.92
|
-1.23
-3.95% |
$31.12
|
302,880
102.71% of 50 DAV
50 DAV is 294,900
|
$33.20
-9.88%
|
12/2/2010
|
$27.53
|
PP = $26.00
|
|
MB = $27.30
|
Most Recent Note - 1/28/2011 4:37:58 PM
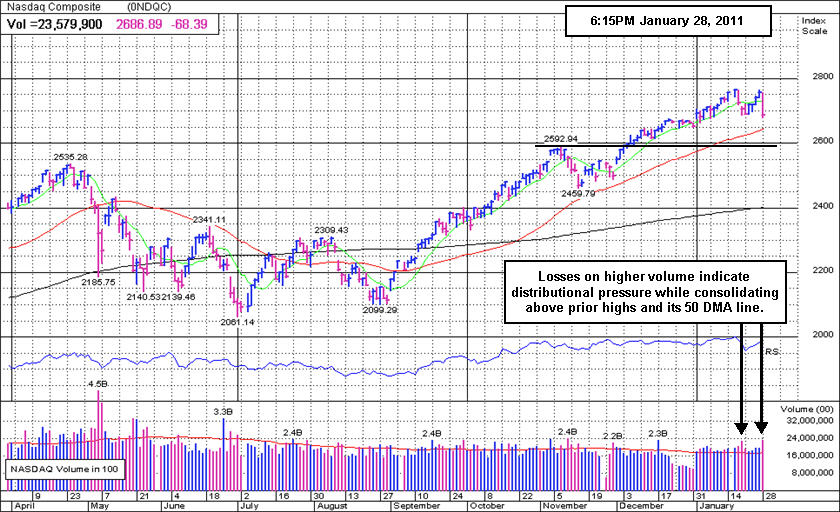
G - Enduring minor distributional pressure today while consolidating above prior chart highs in the $29 area which define initial support to watch well above its 50 DMA line. It is not near a sound base.
>>> The latest Featured Stock Update with an annotated graph appeared on 1/21/2011. Click here.
View all notes |
Alert me of new notes |
CANSLIM.net Company Profile |
SEC |
Zacks Reports |
StockTalk |
News |
Chart |
Request a new note
C
A N
S L
I M
|
EZPW
-
NASDAQ
Ezcorp Inc Cl A
SPECIALTY RETAIL - Specialty Retail, Other
|
$27.22
|
-1.14
-4.02% |
$28.56
|
406,962
98.92% of 50 DAV
50 DAV is 411,400
|
$29.94
-9.08%
|
11/5/2010
|
$24.02
|
PP = $23.85
|
|
MB = $25.04
|
Most Recent Note - 1/28/2011 4:40:36 PM
G - Finished near the session low with a considerable loss on average volume, closing near its 50 DMA line. That short-term average recently acted as support, but it is not near any sound base.
>>> The latest Featured Stock Update with an annotated graph appeared on 12/29/2010. Click here.
View all notes |
Alert me of new notes |
CANSLIM.net Company Profile |
SEC |
Zacks Reports |
StockTalk |
News |
Chart |
Request a new note
C
A N
S L
I M
|
FOSL
-
NASDAQ
Fossil Inc
CONSUMER DURABLES - Recreational Goods, Other
|
$69.96
|
-0.94
-1.33% |
$71.44
|
529,017
72.58% of 50 DAV
50 DAV is 728,900
|
$74.34
-5.89%
|
11/26/2010
|
$69.10
|
PP = $70.17
|
|
MB = $73.68
|
Most Recent Note - 1/28/2011 4:45:09 PM
G - Quietly consolidating near its 50 DMA line which acted as resistance this week while building an orderly flat base. A subsequent violation of its recent chart low ($66.05 on 1/25/11) would raise greater concerns and trigger an additional sell signal.
>>> The latest Featured Stock Update with an annotated graph appeared on 1/12/2011. Click here.
View all notes |
Alert me of new notes |
CANSLIM.net Company Profile |
SEC |
Zacks Reports |
StockTalk |
News |
Chart |
Request a new note
C
A N
S L
I M
|
HMSY
-
NASDAQ
H M S Holdings Corp
COMPUTER SOFTWARE and SERVICES - Healthcare Information Service
|
$64.76
|
-1.47
-2.22% |
$66.28
|
182,509
124.07% of 50 DAV
50 DAV is 147,100
|
$67.42
-3.95%
|
11/19/2010
|
$61.89
|
PP = $63.01
|
|
MB = $66.16
|
Most Recent Note - 1/28/2011 4:47:39 PM
G - Touched a new high this week but ended by slumping with above average volume near support at its 50 DMA line. Building a base-on-base type pattern, its waning Relative Strength rank (now 75) has been noted as a concern.
>>> The latest Featured Stock Update with an annotated graph appeared on 1/3/2011. Click here.
View all notes |
Alert me of new notes |
CANSLIM.net Company Profile |
SEC |
Zacks Reports |
StockTalk |
News |
Chart |
Request a new note
C
A N
S L
I M
|
JOBS
-
NASDAQ
Fifty One Job Inc Ads
DIVERSIFIED SERVICES - Staffing and; Outsourcing Service
|
$53.50
|
-2.30
-4.12% |
$56.32
|
127,209
86.65% of 50 DAV
50 DAV is 146,800
|
$61.28
-12.70%
|
10/13/2010
|
$42.07
|
PP = $40.60
|
|
MB = $42.63
|
Most Recent Note - 1/28/2011 4:49:20 PM
G - Slumped today with lighter than average volume to just below prior chart highs. Its 50 DMA line defines support, while more damaging losses would raise concerns and trigger a technical sell signal.
>>> The latest Featured Stock Update with an annotated graph appeared on 12/30/2010. Click here.
View all notes |
Alert me of new notes |
CANSLIM.net Company Profile |
SEC |
Zacks Reports |
StockTalk |
News |
Chart |
Request a new note
C
A N
S L
I M
|
Symbol/Exchange
Company Name
Industry Group |
PRICE |
CHANGE
(%Change) |
Day High |
Volume
(% DAV)
(% 50 day avg vol) |
52 Wk Hi
% From Hi |
Featured
Date |
Price
Featured |
Pivot Featured |
|
Max Buy |
LULU
-
NASDAQ
Lululemon Athletica
MANUFACTURING - Textile Manufacturing
|
$68.61
|
-1.69
-2.40% |
$71.25
|
1,463,703
71.69% of 50 DAV
50 DAV is 2,041,600
|
$74.60
-8.03%
|
1/26/2011
|
$68.11
|
PP = $74.70
|
|
MB = $78.44
|
Most Recent Note - 1/28/2011 4:51:33 PM
Y - Volume totals have been lighter while consolidating since its big gap up gain on 1/12/11. Color code was changed to yellow with new pivot point cited based on its 52-week high plus 10 cents. Subsequent gains to new highs with at least +50% above average volume may trigger a new (or add-on) technical buy signal, meanwhile any breach of its recent low ($65.30) or its 50 DMA line may trigger a more worrisome sell signal.
>>> The latest Featured Stock Update with an annotated graph appeared on 1/14/2011. Click here.
View all notes |
Alert me of new notes |
CANSLIM.net Company Profile |
SEC |
Zacks Reports |
StockTalk |
News |
Chart |
Request a new note
C
A N
S L
I M
|
MWIV
-
NASDAQ
M W I Veterinary Supply
HEALTH SERVICES - Medical Instruments and; Supplies
|
$62.62
|
-0.97
-1.53% |
$63.50
|
173,222
316.10% of 50 DAV
50 DAV is 54,800
|
$67.13
-6.72%
|
11/4/2010
|
$61.79
|
PP = $59.60
|
|
MB = $62.58
|
Most Recent Note - 1/28/2011 4:55:04 PM
G - Churned heavy volume today while consolidating near its 50 DMA line. More damaging losses below this week's low ($59.95 on 1/25/11) could raise concerns and trigger a technical sell signal.
>>> The latest Featured Stock Update with an annotated graph appeared on 12/21/2010. Click here.
View all notes |
Alert me of new notes |
CANSLIM.net Company Profile |
SEC |
Zacks Reports |
StockTalk |
News |
Chart |
Request a new note
C
A N
S L
I M
|
NFLX
-
NASDAQ
Netflix Inc
SPECIALTY RETAIL - Music and Video Stores
|
$217.98
|
+7.11
3.37% |
$218.00
|
8,972,624
154.09% of 50 DAV
50 DAV is 5,822,800
|
$211.79
2.92%
|
1/10/2011
|
$187.88
|
PP = $209.34
|
|
MB = $219.81
|
Most Recent Note - 1/28/2011 4:58:56 PM
Y - Charged higher today and closed near the session high with a second consecutive volume-driven gain for a new high. A considerable gap up gain on 1/27/11 followed a strong quarterly earnings report and confirmed a technical buy signal. Color code was changed to yellow based on its powerful sign of fundamental and technical strength, quickly helping its outlook to improve.
>>> The latest Featured Stock Update with an annotated graph appeared on 1/10/2011. Click here.
View all notes |
Alert me of new notes |
CANSLIM.net Company Profile |
SEC |
Zacks Reports |
StockTalk |
News |
Chart |
Request a new note
C
A N
S L
I M
|
NTAP
-
NASDAQ
Netapp Inc
COMPUTER HARDWARE - Data Storage Devices
|
$54.03
|
-1.30
-2.35% |
$55.85
|
4,921,898
87.60% of 50 DAV
50 DAV is 5,618,800
|
$59.79
-9.63%
|
1/6/2011
|
$57.49
|
PP = $58.06
|
|
MB = $60.96
|
Most Recent Note - 1/28/2011 5:00:52 PM
G - Slumped on lighter volume today and closed the week below its 50 DMA line. More damaging losses could raise greater concerns.
>>> The latest Featured Stock Update with an annotated graph appeared on 12/27/2010. Click here.
View all notes |
Alert me of new notes |
CANSLIM.net Company Profile |
SEC |
Zacks Reports |
StockTalk |
News |
Chart |
Request a new note
C
A N
S L
I M
|
OPEN
-
NASDAQ
Opentable Inc
INTERNET - Internet Software and Services
|
$77.32
|
-2.08
-2.62% |
$79.99
|
650,212
81.58% of 50 DAV
50 DAV is 797,000
|
$82.70
-6.50%
|
1/5/2011
|
$74.05
|
PP = $76.79
|
|
MB = $80.63
|
Most Recent Note - 1/28/2011 5:02:08 PM
Y - Small loss today with lighter volume, finishing the week above its pivot point after nearly challenging its all-time high. Recent lows and its 50 DMA line define near-term chart support.
>>> The latest Featured Stock Update with an annotated graph appeared on 1/5/2011. Click here.
View all notes |
Alert me of new notes |
CANSLIM.net Company Profile |
SEC |
Zacks Reports |
StockTalk |
News |
Chart |
Request a new note
C
A N
S L
I M
|
Symbol/Exchange
Company Name
Industry Group |
PRICE |
CHANGE
(%Change) |
Day High |
Volume
(% DAV)
(% 50 day avg vol) |
52 Wk Hi
% From Hi |
Featured
Date |
Price
Featured |
Pivot Featured |
|
Max Buy |
ORCL
-
NASDAQ
Oracle Corp
COMPUTER SOFTWARE and SERVICES - Application Software
|
$32.00
|
-0.92
-2.79% |
$33.30
|
30,818,223
108.54% of 50 DAV
50 DAV is 28,394,200
|
$33.09
-3.29%
|
1/20/2011
|
$32.31
|
PP = $32.37
|
|
MB = $33.99
|
Most Recent Note - 1/28/2011 5:05:04 PM
Y - Considerable loss today on slightly higher (yet near average) volume led to a close just below its pivot point, raising some concerns. Recent chart low $30.80 defines near-term support above its 50 DMA line.
>>> The latest Featured Stock Update with an annotated graph appeared on 1/7/2011. Click here.
View all notes |
Alert me of new notes |
CANSLIM.net Company Profile |
SEC |
Zacks Reports |
StockTalk |
News |
Chart |
Request a new note
C
A N
S L
I M
|
PAY
-
NYSE
Verifone Systems Inc
COMPUTER HARDWARE - Transaction Automation Systems
|
$39.99
|
-1.78
-4.26% |
$42.09
|
1,007,665
61.16% of 50 DAV
50 DAV is 1,647,600
|
$44.87
-10.88%
|
1/27/2011
|
$41.77
|
PP = $44.00
|
|
MB = $46.20
|
Most Recent Note - 1/28/2011 5:07:41 PM
Y - Closed near the session low today with a loss on light volume, finishing -10.9% off its 52-week high. Working on an ascending base pattern since breaking out in July. Its 50 DMA line defines important near-term chart support to watch. Color code was changed to yellow while a new pivot point was cited based on its 52-week high plus ten cents. Subsequent gains with heavy volume may trigger a new (or add-on) technical buy signal. See the latest FSU article for analysis with an annotated graph.
>>> The latest Featured Stock Update with an annotated graph appeared on 1/27/2011. Click here.
View all notes |
Alert me of new notes |
CANSLIM.net Company Profile |
SEC |
Zacks Reports |
StockTalk |
News |
Chart |
Request a new note
C
A N
S L
I M
|
PCLN
-
NASDAQ
Priceline.Com Inc
INTERNET - Internet Software and Services
|
$425.31
|
-11.83
-2.71% |
$439.00
|
1,278,296
136.76% of 50 DAV
50 DAV is 934,700
|
$443.19
-4.03%
|
11/1/2002
|
$399.55
|
PP = $428.20
|
|
MB = $449.61
|
Most Recent Note - 1/28/2011 5:10:26 PM
Y - Loss today with +37% above average volume led to a close back below its pivot point. Finished near the session low and -4.0% off its 52-week high after its 3rd consecutive weekly loss. Its 50 DMA line defines important support to watch above recent chart lows.
>>> The latest Featured Stock Update with an annotated graph appeared on 1/2/2011. Click here.
View all notes |
Alert me of new notes |
CANSLIM.net Company Profile |
SEC |
Zacks Reports |
StockTalk |
News |
Chart |
Request a new note
C
A N
S L
I M
|
RAX
-
NYSE
Rackspace Hosting Inc
INTERNET - Internet Software and; Services
|
$33.77
|
+1.56
4.84% |
$35.87
|
5,145,131
318.88% of 50 DAV
50 DAV is 1,613,500
|
$35.00
-3.51%
|
1/10/2011
|
$22.84
|
PP = $32.76
|
|
MB = $34.40
|
Most Recent Note - 1/28/2011 5:13:30 PM
G - Gapped up today and hit a new all-time high, yet closed in the lower half of its intra-day range. Found prompt support near its 50 DMA line recently after a 1/20/11 gap down completely negated its 1/11/11 technical breakout. Its recent low ($29.52 on 1/20/10) now defines important support to watch where subsequent violations would raise more serious concerns.
>>> The latest Featured Stock Update with an annotated graph appeared on 12/31/2010. Click here.
View all notes |
Alert me of new notes |
CANSLIM.net Company Profile |
SEC |
Zacks Reports |
StockTalk |
News |
Chart |
Request a new note
C
A N
S L
I M
|
ROVI
-
NASDAQ
Rovi Corp
COMPUTER SOFTWARE andamp; SERVICES - Security Software andamp; Services
|
$60.97
|
-3.89
-6.00% |
$64.16
|
3,132,984
197.02% of 50 DAV
50 DAV is 1,590,200
|
$69.50
-12.27%
|
10/29/2010
|
$49.99
|
PP = $53.10
|
|
MB = $55.76
|
Most Recent Note - 1/28/2011 3:28:56 PM
G - Down considerably today with heavier volume, slumping near the previously noted upward trendline. Its 50 DMA line and 1/10/11 low define near-term chart support to watch. See the latest FSU analysis for additional details and an annotated graph.
>>> The latest Featured Stock Update with an annotated graph appeared on 1/25/2011. Click here.
View all notes |
Alert me of new notes |
CANSLIM.net Company Profile |
SEC |
Zacks Reports |
StockTalk |
News |
Chart |
Request a new note
C
A N
S L
I M
|
Symbol/Exchange
Company Name
Industry Group |
PRICE |
CHANGE
(%Change) |
Day High |
Volume
(% DAV)
(% 50 day avg vol) |
52 Wk Hi
% From Hi |
Featured
Date |
Price
Featured |
Pivot Featured |
|
Max Buy |
UA
-
NYSE
Under Armour Inc Cl A
CONSUMER NON-DURABLES - Textile - Apparel Clothing
|
$59.75
|
-0.04
-0.07% |
$60.98
|
1,221,419
168.66% of 50 DAV
50 DAV is 724,200
|
$60.14
-0.65%
|
1/27/2011
|
$58.31
|
PP = $56.99
|
|
MB = $59.84
|
Most Recent Note - 1/28/2011 1:52:52 PM
Y - Touched a new 52-week high today then reversed slightly into the red. A strong finish after a considerable gap up gain above its 50 DMA line helped it break out on 1/27/11 from a near-minimum-length 8-week "double bottom" type base, triggering a technical buy signal. The strength was noted as an immediate reaction to strong earnings and sales revenues increases reported for the quarter ended Dec 31, 2011 with positive guidance. Color code was changed to yellow with new pivot point cited based on its 1/19/11 high. Previously noted that it may encounter resistance at its 52-week high, and it remains well off its 2007 all-time high ($73.40).
>>> The latest Featured Stock Update with an annotated graph appeared on 12/23/2010. Click here.
View all notes |
Alert me of new notes |
CANSLIM.net Company Profile |
SEC |
Zacks Reports |
StockTalk |
News |
Chart |
Request a new note
C
A N
S L
I M
|
ULTA
-
NASDAQ
Ulta Salon Cosm & Frag
SPECIALTY RETAIL - Specialty Retail, Other
|
$36.73
|
-0.33
-0.89% |
$37.12
|
546,954
92.14% of 50 DAV
50 DAV is 593,600
|
$38.25
-3.97%
|
1/6/2011
|
$36.12
|
PP = $37.34
|
|
MB = $39.21
|
Most Recent Note - 1/28/2011 5:15:37 PM
Y - Perched only -4% off its 52-week high, subsequent volume-driven gains above its pivot point would be a very reassuring sign. Its 50 DMA line defines important chart support to watch.
>>> The latest Featured Stock Update with an annotated graph appeared on 1/6/2011. Click here.
View all notes |
Alert me of new notes |
CANSLIM.net Company Profile |
SEC |
Zacks Reports |
StockTalk |
News |
Chart |
Request a new note
C
A N
S L
I M
|