You are not logged in.
This means you
CAN ONLY VIEW reports that were published prior to Monday, April 14, 2025.
You
MUST UPGRADE YOUR MEMBERSHIP if you want to see any current reports.
AFTER MARKET UPDATE - THURSDAY, JANUARY 28TH, 2010
Previous After Market Report Next After Market Report >>>
|
|
|
|
DOW |
-115.70 |
10,120.46 |
-1.13% |
|
Volume |
1,117,037,140 |
-14% |
|
Volume |
2,915,765,530 |
+15% |
|
NASDAQ |
-42.41 |
2,179.00 |
-1.91% |
|
Advancers |
804 |
26% |
|
Advancers |
773 |
28% |
|
S&P 500 |
-12.97 |
1,084.53 |
-1.18% |
|
Decliners |
2,231 |
71% |
|
Decliners |
1,932 |
69% |
|
Russell 2000 |
-10.45 |
607.93 |
-1.69% |
|
52 Wk Highs |
56 |
|
|
52 Wk Highs |
31 |
|
|
S&P 600 |
-5.97 |
324.20 |
-1.81% |
|
52 Wk Lows |
8 |
|
|
52 Wk Lows |
14 |
|
|
 |
Downdraft Continues As Widespread Losses End Latest Rally Effort
Adam Sarhan, Contributing Writer,
Stocks got smacked on Thursday as the dollar and shorter-term Treasuries rose after a series of negative economic data was released. Volume totals were mixed compared to the prior session; higher on the Nasdaq and lower on the NYSE. Decliners trumped advancers by almost a 3-to-1 ratio on the NYSE and on the Nasdaq exchange. There were 9 high-ranked companies from the CANSLIM.net Leaders List that made a new 52-week high and appeared on the CANSLIM.net BreakOuts Page, lower than the 10 issues that appeared on the prior session. New 52-week highs still outnumbered new 52-week lows on the NYSE and on the Nasdaq exchange.
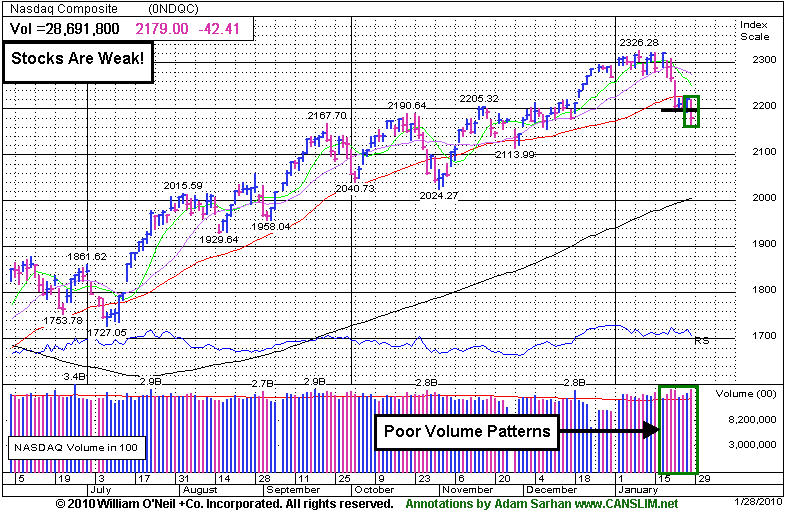
The major averages negatively reversed, effectively ended their latest rally attempt and reset the day count after a slew of weaker than expected economic data was released. Stocks reacted poorly to Obama’s first State of the Union address largely due to his plan to increase taxes on the upper class and his plan to end proprietary trading and hedge-fund investments at large banks. Some highlights from his speech were: “the worst of the storm has passed, we face a deficit of trust, and that he wasn’t interested in punishing banks." For the past ten days, investors were concerned that Congress would not reconfirm Federal Reserve Chairman Ben S. Bernanke for another term. However, those concerns were allayed four minutes before the closing bell when CNBC reported that Bernanke received enough votes for a second term.
Large cap technology stocks got smacked on Thursday after Qualcomm Inc. (QCOM -14.24%) gapped lower after lowering guidance for 2010. Qualcomm, the largest manufacturer of mobile-phone chips, said a “subdued” economic recovery caused the company to lower its forecast. A host of other large cap tech stocks got smacked on similar concerns. The Dollar Index, which tracks the greenback against six major counterparts, rallied for a third straight day which put pressure on dollar denominated assets- mainly stocks and commodities.
The economic data of the day was less than stellar. Durable goods missed estimates and experienced its largest decline in history in 2009! The report, which tracks goods made to last at least 3 years, showed that the manufacturing sector was slowly improving. In December, new orders rebounded +0.3% after a revised -0.4% decline in November. Excluding the highly volatile transportation component, new orders rose another +0.9%, following a +2.1% rebound in November. Elsewhere, investors were disconcerted to see that jobless claims fell -8,000 last week to 470,000 (prior week revised -4,000 lower to 478,000). It was somewhat encouraging to see the smoother four week average rise +9,500 to 456,250 for a second straight week but the overall report suggests that the jobs market is still weak.
Looking at the market, Thursday's ominous action took our Wednesday's lows and effectively ended the brief rally attempt which suggests a steeper correction may unfold. It is also important to see how the major averages react to their respective 50-day moving average (DMA) lines which were support and are now resistance. Until they all close above that important level the technical damage remaining on the charts is a concern. So far, the market's reaction has been tepid at best to the latest round of economic and earnings data. Remember that the recent series of distribution days coupled with the deleterious action in the major averages suggests large institutions are aggressively selling stocks. Disciplined investors will now wait for a new follow-through day to be produced before resuming any buying efforts. Until then, patience is paramount.
Professional Money Management Services - A Winning System - Inquire today!
Our skilled team of portfolio managers knows how to follow the rules of this fact-based investment system. We do not follow opinion or the "conviction list" of some large Wall Street institution which would have us fully invested even during horrific bear markets. Instead, we remain fluid and only buy the best stocks when they are triggering proper technical buy signals. If you are not completely satisfied with the way your portfolio is being managed, Click here to submit your inquiry. *Accounts over $250,000 please. ** Serious inquires only, please.
PICTURED: The Nasdaq Composite Index violated Wednesday's lows, which means the day count is reset.
|
|
|
 |
Tech Sector Slumping Badly As Outlook Turns More Questionable
Kenneth J. Gruneisen - Passed the CAN SLIM® Master's Exam
Tech shares were especially weak on Thursday as the Semiconductor Index ($SOX -3.02%) led the declining tech indices, followed by losses from the Internet Index ($IIX -2.08%), Networking Index ($NWX -1.92%), and Biotechnology Index ($BTK -1.33%). Energy-related shares lost ground as the Oil Services Index ($OSX -1.93%) and Integrated Oil Index ($XOI -1.03%) fell, and other defensive groups including the Gold & Silver Index ($XAU -0.85%) and Healthcare Index ($HMO -0.59%) also lost ground. There was a modest loss for the Retail Index ($RLX -0.46%), and the Broker/Dealer Index ($XBD -1.56%) was also a negative influence while the Bank Index ($BKX +0.30%) was a standout performer with its small gain on the mostly negative session.
Charts courtesy www.stockcharts.com
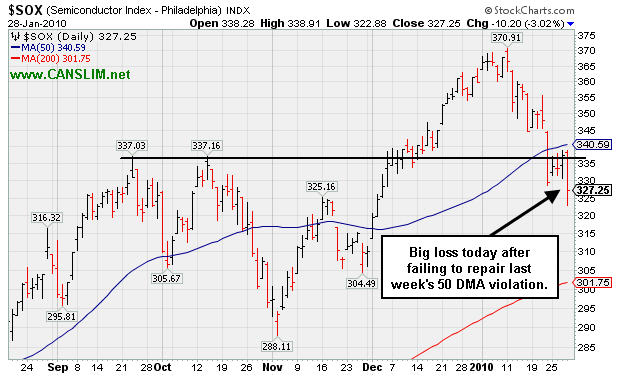
PICTURED: The Semiconductor Index ($SOX -3.02%) suffered a big loss after failing to repair last week's 50-day moving average (DMA) line violation. Among the prominent tech names that created a drag on the tech sector Thursday, Qualcomm Inc (QCOM -14.24%) dove after giving investors a disappointing outlook. Meanwhile, Apple Corp (AAPL -4.13%) gapped down and slumped under its 50 DMA as investors reacted skeptically to the launch of its new iPad tablet computer.
| Oil Services |
$OSX |
196.20 |
-3.87 |
-1.93% |
+0.66% |
| Healthcare |
$HMO |
1,473.92 |
-8.72 |
-0.59% |
+0.07% |
| Integrated Oil |
$XOI |
1,027.09 |
-10.70 |
-1.03% |
-3.85% |
| Semiconductor |
$SOX |
327.25 |
-10.20 |
-3.02% |
-9.07% |
| Networking |
$NWX |
225.27 |
-4.42 |
-1.92% |
-2.51% |
| Internet |
$IIX |
220.85 |
-4.70 |
-2.08% |
-5.56% |
| Broker/Dealer |
$XBD |
113.73 |
-1.80 |
-1.56% |
-1.15% |
| Retail |
$RLX |
398.34 |
-1.83 |
-0.46% |
-3.11% |
| Gold & Silver |
$XAU |
153.42 |
-1.31 |
-0.85% |
-8.81% |
| Bank |
$BKX |
46.84 |
+0.14 |
+0.30% |
+9.67% |
| Biotech |
$BTK |
959.17 |
-12.93 |
-1.33% |
+1.81% |
|
|
|
 |
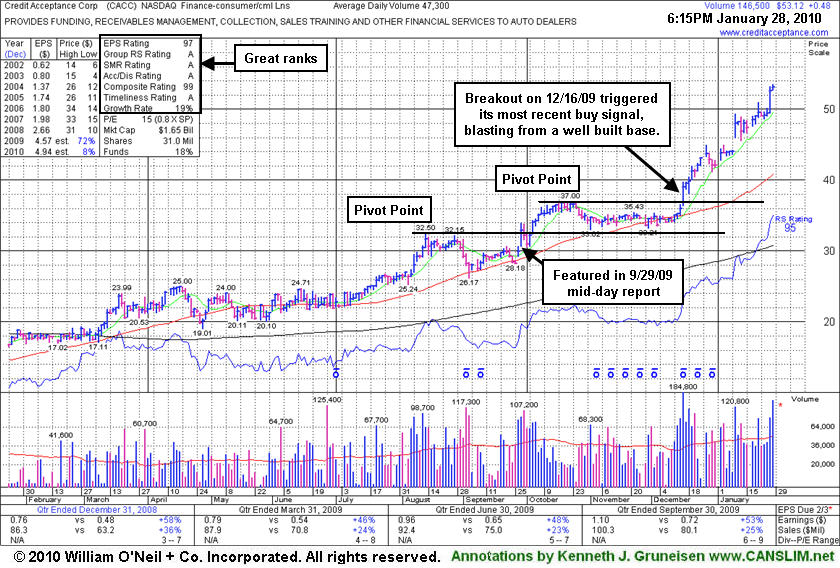
Strong Leader Extended After Producing Big Gains
Kenneth J. Gruneisen - Passed the CAN SLIM® Master's Exam
Credit Acceptance Corp (CACC +$0.48 or +0.91% to $53.12) has traded as much as +59.80% higher since it was featured in yellow in the 9/29/09 mid-day report (read here) when a breakout gain was backed by more than 2 times average volume. After it was initially featured, it went on to later build a new sound base on top of its prior base. New pivot point and max buy levels were noted on 11/19/09, yet it stubbornly held its ground in a tight range for another month plus before finally blasting to new all-time highs with heavy volume on 12/16/09. It has hardly dipped lower since, and the latest gains leave it very extended from its latest base. It is well above its 50-day moving average (DMA) line, an important support level to watch above its previous chart highs at $37, the next important support level to watch.
Disciplined investors avoid chasing extended stocks that have risen more than +5% above their prior chart high or pivot point. If they miss the ideal window of opportunity, patience may allow investors to accumulate shares on light volume pullbacks, or when another new base forms and a new buy signal is triggered. Investors can then "force feed" their winners by adding to already profitable positions whenever additional buys can be made within the proper parameters. According to the investment system rules, averaging down should never be done.
On Monday Jan 25th the company announced the pricing of $250 Million Senior Secured Notes. The Finance - Consumer/Commercial Loans firm has maintained a great track record of annual and quarterly sales revenues and earnings increases that satisfy the C and A criteria of the investment system. Right now, however, the M criteria is an overriding concern which discourages new buying efforts until a proper follow-through day emerges. Should market conditions further erode, investors may be further prompted to consider locking in profits to raise cash.
|
|
|
Color Codes Explained :
Y - Better candidates highlighted by our
staff of experts.
G - Previously featured
in past reports as yellow but may no longer be buyable under the
guidelines.
***Last / Change / Volume quote data in this table corresponds with the timestamp on the note***
Symbol/Exchange
Company Name
Industry Group |
Last |
Chg. |
Vol
% DAV |
Date Featured |
Price Featured |
Latest Pivot Point
Featured |
Status |
| Latest Max Buy Price |
ARST
-
|
$25.38
|
-0.62
|
101,815
20% DAV
509,000
|
12/22/2009
(Date
Featured) |
$25.94
(Price
Featured) |
PP = $27.20 |
G |
| MB = $28.56 |
Most Recent Note - 1/28/2010 5:08:27 PM
G - Loss today on light volume led to a violation and close under its 50 DMA line. Distributional pressure negated its latest breakout. ARST was first featured in yellow at $19.91 in the 9/01/09 mid-day report with an annotated daily graph (read here).
>>> The latest Featured Stock Update with an annotated graph appeared on 1/21/2010. click here.
|
|
C
A
S
I |
News |
Chart |
SEC
View all notes Alert
me of new notes
Company
Profile
|
ASIA
-
|
$23.80
|
-1.05
|
430,017
34% DAV
1,261,700
|
12/24/2009
(Date
Featured) |
$31.05
(Price
Featured) |
PP = $32.40 |
G |
| MB = $34.02 |
Most Recent Note - 1/28/2010 5:16:47 PM
G - Reported earnings today after a loss on higher volume following its half-hearted stand of 2 small gains on light volume halted a streak of 6 consecutive losses on higher volume. Noted on 1/20/10 - "violating its 50-day moving average (DMA) line and breaching recent chart lows, raising concerns and triggering technical sell signals." Traded up as much as +68.13% since first featured in the August 2009 CANSLIM.net News (read here).
>>> The latest Featured Stock Update with an annotated graph appeared on 1/12/2010. click here.
|
|
C
A
S
I |
News |
Chart |
SEC
View all notes Alert
me of new notes
Company
Profile
|
BIDU
- NASDAQ
Baidu Inc Ads
INTERNET - Internet Information Providers
|
$422.98
|
-1.39
|
527,703
29% DAV
1,802,400
|
1/13/2010
(Date
Featured) |
$431.25
(Price
Featured) |
PP = $426.75 |
G |
| MB = $448.09 |
Most Recent Note - 1/28/2010 5:18:32 PM
G - Reversed an early gain today for a loss on lighter volume, closing under its 50 DMA line. Due to report earnings after the close on Friday, January 29th. Gaps down for considerable losses on 1/19 and 1/22 pressured it under its November '09 highs and violated its short-term average line, hurting its outlook after recently spiking to new all-time highs.
>>> The latest Featured Stock Update with an annotated graph appeared on 1/14/2010. click here.
|
|
C
A
S
I |
News |
Chart |
SEC
View all notes Alert
me of new notes
Company
Profile
|
CACC
- NASDAQ
Credit Acceptance Corp
FINANCIAL SERVICES - Credit Services
|
$52.99
|
+0.35
|
51,990
110% DAV
47,300
|
9/29/2009
(Date
Featured) |
$33.48
(Price
Featured) |
PP = $37.10 |
G |
| MB = $38.96 |
Most Recent Note - 1/28/2010 5:54:25 PM
G - Small gain today on heavier than average volume for a new all-time high after a big gain on 1/27/10. Extended from any sound base, it is well above its 50 DMA line, an important support level to watch. On Monday Jan 25th the company announced the pricing of $250 Million Senior Secured Notes.
>>> The latest Featured Stock Update with an annotated graph appeared on 1/28/2010. click here.
|
|
C
A
S
I |
News |
Chart |
SEC
View all notes Alert
me of new notes
Company
Profile
|
CRM
- NYSE
Salesforce.com Inc
INTERNET - Internet Software & Services
|
$64.18
|
-1.22
|
732,349
37% DAV
1,973,900
|
12/18/2009
(Date
Featured) |
$67.32
(Price
Featured) |
PP = $67.82 |
G |
| MB = $71.21 |
Most Recent Note - 1/28/2010 5:56:13 PM
G - Edging lower today on light volume, remaining below its 50 DMA line. Previously noted weakness triggered technical sell signals. A damaging gap down on 1/12/10 was noted as "indicative of institutional (I criteria) distribution."
>>> The latest Featured Stock Update with an annotated graph appeared on 1/27/2010. click here.
|
|
C
A
S
I |
News |
Chart |
SEC
View all notes Alert
me of new notes
Company
Profile
|
CTRP
- NASDAQ
Ctrip.com Intl Ltd Adr
LEISURE - Resorts & Casinos
|
$32.54
|
+0.28
|
953,773
47% DAV
2,022,100
|
1/14/2010
(Date
Featured) |
$36.67
(Price
Featured) |
PP = $39.35 |
G |
| MB = $41.32 |
Most Recent Note - 1/28/2010 5:58:01 PM
G - Posted a gain today on near average volume, with support recently being found near a prior chart high in the $31 area. Damaging losses with above average volume last week violated its 50 DMA line and recent chart lows, triggering technical sell signals. Do not be confused by the 2:1 split effective as of 1/21/10. PP and Featured Price adjusted for split.
>>> The latest Featured Stock Update with an annotated graph appeared on 1/20/2010. click here.
|
|
C
A
S
I |
News |
Chart |
SEC
View all notes Alert
me of new notes
Company
Profile
|
GMCR
- NASDAQ
Green Mtn Coffee Roastrs
FOOD & BEVERAGE - Processed & Packaged Goods
|
$85.89
|
+5.87
|
2,708,990
182% DAV
1,492,300
|
12/28/2009
(Date
Featured) |
$77.49
(Price
Featured) |
PP = $76.50 |
G |
| MB = $80.33 |
Most Recent Note - 1/28/2010 6:01:01 PM
G - Gapped up today for a considerable gain and new all-time, a prompt and encouraging response to good fundamental news after very strong earnings and sales increases for the quarter ended Dec 31, 2009. This outlier is bucking ugly market conditions (M criteria) which have recently turned less favorable for stock buyers. Until a new follow-through day emerges from at least one of the major averages, the investment system rules discourage accumulating shares in any company. Support to watch is at prior high closes in the $76-77 area.
>>> The latest Featured Stock Update with an annotated graph appeared on 1/13/2010. click here.
|
|
C
A
S
I |
News |
Chart |
SEC
View all notes Alert
me of new notes
Company
Profile
|
ISRG
- NASDAQ
Intuitive Surgical Inc
HEALTH SERVICES - Medical Appliances & Equipment
|
$336.30
|
-2.91
|
257,430
51% DAV
506,100
|
1/22/2010
(Date
Featured) |
$340.40
(Price
Featured) |
PP = $314.00 |
Y |
| MB = $329.70 |
Most Recent Note - 1/28/2010 6:01:53 PM
Y - Still holding its ground stubbornly near its 52-week high since featured in yellow in the 1/22/10 mid-day report (read here). Its annual earnings history (the A criteria) has been very impressive. ISRG has rebounded impressively from its March low ($84.86) and may be on course for its all-time high ($359 in 2007). Notes outlined technical deterioration before and when it was last dropped from the Featured Stocks list on 6/10/08. ISRG traded up more than 13-fold since first featured in yellow in CANSLIM.net reports in the summer of 2004.
>>> The latest Featured Stock Update with an annotated graph appeared on 1/22/2010. click here.
|
|
C
A
S
I |
News |
Chart |
SEC
View all notes Alert
me of new notes
Company
Profile
|
LFT
-
|
$35.74
|
+0.40
|
229,886
48% DAV
478,600
|
11/17/2009
(Date
Featured) |
$31.77
(Price
Featured) |
PP = $33.04 |
G |
| MB = $34.69 |
Most Recent Note - 1/28/2010 6:03:18 PM
G - Posted a small gain with average volume. Still trading below its 50 DMA line, while its prior chart highs in the $31-33 area define the next technical support level. Due to report earnings on Wednesday, February 10 after the market close. Widespread weakness in China-based issues has clearly been a factor in recent days.
>>> The latest Featured Stock Update with an annotated graph appeared on 1/26/2010. click here.
|
|
C
A
S
I |
News |
Chart |
SEC
View all notes Alert
me of new notes
Company
Profile
|
PEGA
- NASDAQ
Pegasystems Inc
COMPUTER SOFTWARE & SERVICES - Business Software & Services
|
$36.51
|
-0.71
|
206,391
125% DAV
165,700
|
1/4/2010
(Date
Featured) |
$34.00
(Price
Featured) |
PP = $36.19 |
Y |
| MB = $38.00 |
Most Recent Note - 1/28/2010 6:05:24 PM
Y - Today it hit new highs above its max buy level and then negatively reversed for a loss and closed back below its pivot point, raising concerns. Volume was 3 times average on 1/27/10 as it broke out above resistance in the $36 area. No overhead supply remains to hinder its progress, yet the action indicates that it is encountering some distributional pressure. Negative market conditions (M criteria) are currently an overriding concern prompting great caution, since a follow-through day is still needed to confirm a new rally. Found support recently right at its 50 DMA line. After a hiatus from the Featured Stocks list, PEGA was featured again in the January 2010 issue of CANSLIM.net News (read here).
>>> The latest Featured Stock Update with an annotated graph appeared on 1/25/2010. click here.
|
|
C
A
S
I |
News |
Chart |
SEC
View all notes Alert
me of new notes
Company
Profile
|
VIT
-
|
$17.15
|
+0.10
|
179,914
31% DAV
588,700
|
12/24/2009
(Date
Featured) |
$20.07
(Price
Featured) |
PP = $21.17 |
G |
| MB = $22.23 |
Most Recent Note - 1/28/2010 6:06:34 PM
G - Small gain today on light volume. On the prior session it sank to $16.00, perfectly matching its 11/19/09 low before positively reversing for a small gain. The 1/22/10 violation of its 50 DMA line triggered a technical sell signal. Distributional pressure raised concerns as it abruptly reversed under its pivot point following its big 1/06/10 gain on heavy volume and 1/11/10 gain on +36% above average volume.
>>> The latest Featured Stock Update with an annotated graph appeared on 1/11/2010. click here.
|
|
C
A
S
I |
News |
Chart |
SEC
View all notes Alert
me of new notes
Company
Profile
|
|
|
|
THESE ARE NOT BUY RECOMMENDATIONS!
Comments contained in the body of this report are technical
opinions only. The material herein has been obtained
from sources believed to be reliable and accurate, however,
its accuracy and completeness cannot be guaranteed.
This site is not an investment advisor, hence it does
not endorse or recommend any securities or other investments.
Any recommendation contained in this report may not
be suitable for all investors and it is not to be deemed
an offer or solicitation on our part with respect to
the purchase or sale of any securities. All trademarks,
service marks and trade names appearing in this report
are the property of their respective owners, and are
likewise used for identification purposes only.
This report is a service available
only to active Paid Premium Members.
You may opt-out of receiving report notifications
at any time. Questions or comments may be submitted
by writing to Premium Membership Services 665 S.E. 10 Street, Suite 201 Deerfield Beach, FL 33441-5634 or by calling 1-800-965-8307
or 954-785-1121.
|
|
|


