You are not logged in.
This means you
CAN ONLY VIEW reports that were published prior to Monday, February 26, 2024.
You
MUST UPGRADE YOUR MEMBERSHIP if you want to see any current reports.
AFTER MARKET UPDATE - MONDAY, JANUARY 27TH, 2020
Previous After Market Report Next After Market Report >>>
|
|
|
|
DOW |
-453.93 |
28,535.80 |
-1.57% |
|
Volume |
977,556,470 |
+12% |
|
Volume |
2,557,806,490 |
-2% |
|
NASDAQ |
-175.60 |
9,139.31 |
-1.89% |
|
Advancers |
623 |
22% |
|
Advancers |
760 |
24% |
|
S&P 500 |
-51.84 |
3,243.63 |
-1.57% |
|
Decliners |
2,260 |
78% |
|
Decliners |
2,435 |
76% |
|
Russell 2000 |
-18.09 |
1,644.14 |
-1.09% |
|
52 Wk Highs |
111 |
|
|
52 Wk Highs |
78 |
|
|
S&P 600 |
-12.05 |
1,003.93 |
-1.19% |
|
52 Wk Lows |
102 |
|
|
52 Wk Lows |
96 |
|
|
 |
Indices Fall as Stocks Encounter Pressure and Leadership Thins
Kenneth J. Gruneisen - Passed the CAN SLIM® Master's Exam
The S&P 500 dropped 1.6%, its fifth-consecutive loss and first move of more than 1% since mid-October. The Dow was down 453 points, turning slightly negative for the year, while the Nasdaq Composite shed 1.9%. Breadth was negative as decliners led advancers by more than a 3-1 margin on the NYSE and on the Nasdaq exchange. The reported volume totals were mixed, higher than the prior session total on the NYSE and lighter on the Nasdaq exchange. There were only 10 high-ranked companies from the Leaders List that hit a new 52-week high and were listed on the BreakOuts Page, down abruptly from the total of 89 on the prior session. New 52-week highs totals still outnumbered new 52-week lows totals on the NYSE but new lows outnumbered new highs on the Nasdaq exchange. The major indices (M criteria) are seeing their uptrend come under pressure and leadership has thinned in a disconcerting manner, so disciplined investors are wise to be watching individual holdings closely for any sell signals. The Featured Stocks Page provides the most timely analysis on high-ranked leaders. Charts used courtesy of www.stockcharts.com
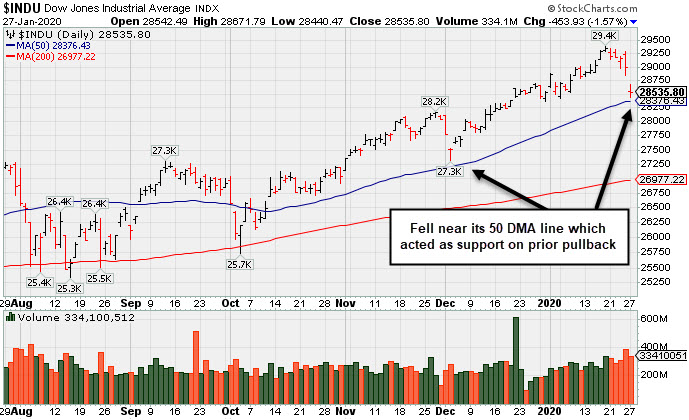
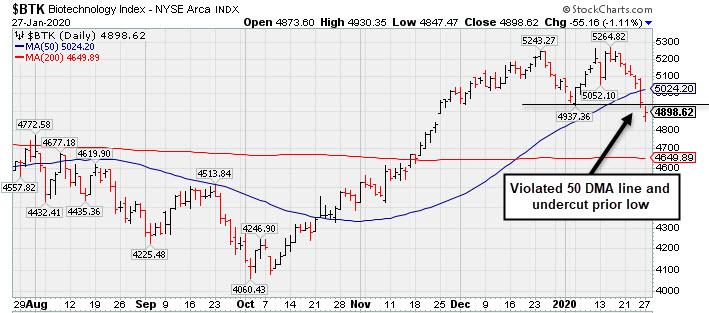
PICTURED: The Dow Jones Industrial Average has retreated from its record high with 5 consecutive losses. Its 50-day moving average line acted as support on the prior pullback.
Stocks declined the most in nearly four months on Monday amid increasing worries surrounding the potential economic impact of the Wuhan coronavirus. The virus originated in China and has since spread to other countries, including the U.S. and France. Chinese authorities have extended the Lunar New Year holiday to February 2 (from January 30) in an effort to contain the epidemic. The number of confirmed cases globally is approaching 3,000, with the death toll reaching more than 80.
Treasuries rallied amid the perceived “risk off” mood. The yield on the 10-year note was down eight basis points to 1.60%. In commodities, WTI crude lost 1.9% $53.14/barrel, its fifth-straight decline and worst closing price since mid-October. COMEX gold rose 0.6% to $1,581.90/ounce.
In earnings, 147 of S&P 500 companies are slated to post profit tallies this week, including some of the world’s largest corporations. D.R. Horton (DHI + 1.98%) rose after the homebuilder easily topped analyst profit estimates and raised its full-year guidance. In other corporate news, travel-related stocks slumped as worries surrounding the virus outbreak in China mounted. Starbucks (SBUX -3.59%) fell following an announcement of temporary store closures in China.
On the data front, a release revealed new home sales unexpectedly dipped 0.4% in December. A separate update showed manufacturing activity in the Dallas Fed region improved more than expected this month. |
 Kenneth J. Gruneisen started out as a licensed stockbroker in August 1987, a couple of months prior to the historic stock market crash that took the Dow Jones Industrial Average down -22.6% in a single day. He has published daily fact-based fundamental and technical analysis on high-ranked stocks online for two decades. Through FACTBASEDINVESTING.COM, Kenneth provides educational articles, news, market commentary, and other information regarding proven investment systems that work in good times and bad.
Comments contained in the body of this report are technical opinions only and are not necessarily those of Gruneisen Growth Corp. The material herein has been obtained from sources believed to be reliable and accurate, however, its accuracy and completeness cannot be guaranteed. Our firm, employees, and customers may effect transactions, including transactions contrary to any recommendation herein, or have positions in the securities mentioned herein or options with respect thereto. Any recommendation contained in this report may not be suitable for all investors and it is not to be deemed an offer or solicitation on our part with respect to the purchase or sale of any securities. |
|
 |
Energy and Semiconductor Indexes Led Widespread Losses
Kenneth J. Gruneisen - Passed the CAN SLIM® Master's Exam
Energy-linked groups had a clearly negative bias as the Oil Services Index ($OSX -5.80%) and the Integrated Oil Index ($XOI -3.01%) both outpaced the Gold & Silver Index ($XAU -1.57%) on the widely negative session. The Broker/Dealer Index ($XBD -1.70%) and the Bank Index ($BKX -1.83%) both outpaced the Retail Index ($RLX -1.16%) to the downside again. Meanwhile, the Semiconductor Index ($SOX -3.91%) led the tech sector's retreat while the Networking Index ($NWX -1.81%) and Biotech Index ($BTK -1.11%) both slumped.
PICTURED: The Biotech Index ($BTK -1.11%) violated its 50-day moving average (DMA) line and undercut the prior low during its streak of 6 consecutive losses.
| Oil Services |
$OSX |
64.44 |
-3.96 |
-5.79% |
-17.69% |
| Integrated Oil |
$XOI |
1,161.18 |
-36.00 |
-3.01% |
-8.61% |
| Semiconductor |
$SOX |
1,848.86 |
-75.17 |
-3.91% |
-0.04% |
| Networking |
$NWX |
585.54 |
-10.82 |
-1.81% |
+0.37% |
| Broker/Dealer |
$XBD |
289.35 |
-5.00 |
-1.70% |
-0.36% |
| Retail |
$RLX |
2,429.17 |
-28.52 |
-1.16% |
-0.82% |
| Gold & Silver |
$XAU |
103.17 |
-1.65 |
-1.57% |
-3.51% |
| Bank |
$BKX |
105.73 |
-1.97 |
-1.83% |
-6.73% |
| Biotech |
$BTK |
4,898.62 |
-55.16 |
-1.11% |
-3.33% |
|
|
|
 |
Showed Resilience With Close in Upper Third of Intra-day Range
Kenneth J. Gruneisen - Passed the CAN SLIM® Master's Exam
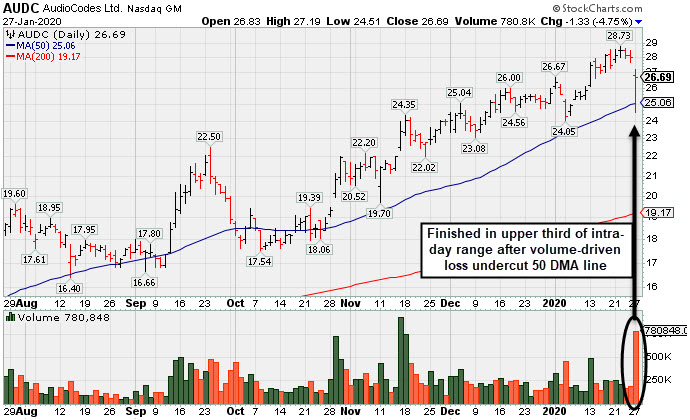
Audiocodes Ltd (AUDC -$1.33 or -4.75% to $26.69) showed resilience and ended in the upper third of its intra-day range today after gapping down testing its 50-day moving average (DMA) line ($25.04). The prior low ($24.05 on 1/06/20) defines additional near-term support to watch where subsequent violations may trigger a more worrisome technical sell signal. It is very extended from the previously noted base.
Fundamentals remain strong. Bullish action came after it reported earnings +26% on +15% sales revenues for the Sep '19 quarter, continuing its strong earnings track record for a 11th consecutive quarterly comparison above the +25% minimum guideline (C criteria). Annual earnings growth has been strong and it has a 99 Earnings Per Share Rating.
This Israel-based designer of advanced voice-over-IP products wedged higher with gains lacking great volume conviction since last shown in this FSU section on 1/06/20 with an annotated graph under the headline, "Large Loss With Higher Volume Indicates Distributional Pressure". The number of top-rated funds owning its shares rose from 33 in Mar '18 to 82 in Dec '19, a reassuring sign concerning the I criteria. Its current Up/Down Volume Ratio of 1.6 is still an unbiased indication its shares have been under accumulation over the past 50 days. It has a Timeliness Rating of A and Sponsorship Rating of A. The small supply of 22.7 million shares (S criteria) in the public float can contribute to greater price volatility in the event of institutional buying or selling.
Charts courtesy of www.stockcharts.com
 |
|
|
Color Codes Explained :
Y - Better candidates highlighted by our
staff of experts.
G - Previously featured
in past reports as yellow but may no longer be buyable under the
guidelines.
***Last / Change / Volume data in this table is the closing quote data***
Symbol/Exchange
Company Name
Industry Group |
PRICE |
CHANGE
(%Change) |
Day High |
Volume
(% DAV)
(% 50 day avg vol) |
52 Wk Hi
% From Hi |
Featured
Date |
Price
Featured |
Pivot Featured |
|
Max Buy |
 FTNT
-
NASDAQ
FTNT
-
NASDAQ
Fortinet Inc
Computer Sftwr-Security
|
$114.43
|
-3.56
-3.02% |
$115.80
|
1,203,073
104.80% of 50 DAV
50 DAV is 1,148,000
|
$120.44
-4.99%
|
12/9/2019
|
$103.85
|
PP = $106.10
|
|
MB = $111.41
|
 Most Recent Note - 1/27/2020 5:21:15 PM
G - Gapped down today, retreating from its all-time high. Very extended from any sound base. Its 50 DMA line ($108.50) defines important near-term support to watch.
>>> FEATURED STOCK ARTICLE : Extended From Base After Wedging Higher - 1/14/2020 |
View all notes |
Set NEW NOTE alert |
Company Profile |
SEC
News |
Chart |
Request a new note
C
A
S
I |
SPSC
-
NASDAQ
S P S Commerce Inc
COMPUTER SOFTWARE and SERVICES - Application Software
|
$58.04
|
-0.38
-0.65% |
$58.62
|
132,644
74.94% of 50 DAV
50 DAV is 177,000
|
$59.98
-3.23%
|
11/29/2019
|
$56.59
|
PP = $59.24
|
|
MB = $62.20
|
Most Recent Note - 1/22/2020 5:38:58 PM
Y - Posted a solid volume-driven gain today for its second-best ever close. Perched near its all-time high with no resistance remaining. Subsequent gains above its pivot point backed by at least +40% above average volume are needed to trigger a new technical buy signal. Fundamentals remain strong. Its Relative Strength Rating of 85 is above the 80+ minimum guideline for buy candidates.
>>> FEATURED STOCK ARTICLE : Still Lingering Below Prior Resistance - 1/13/2020 |
View all notes |
Set NEW NOTE alert |
Company Profile |
SEC
News |
Chart |
Request a new note
C
A
S
I |
AUDC
-
NASDAQ
Audiocodes Ltd
ELECTRONICS - Scientific and Technical Instrum
|
$26.69
|
-1.33
-4.75% |
$27.20
|
772,326
304.07% of 50 DAV
50 DAV is 254,000
|
$28.73
-7.10%
|
9/13/2019
|
$19.68
|
PP = $19.84
|
|
MB = $20.83
|
Most Recent Note - 1/27/2020 5:16:55 PM
G - Showed resilience and finished in the upper third of its intra-day range after a gap down. Tested its 50 DMA line ($25.04). The prior low ($24.05 on 1/06/20) defines additional near-term support to watch. Subsequent losses leading to violations may trigger technical sell signals. Fundamentals remain strong. See the latest FSU analysis for more details and a new annotated graph.
>>> FEATURED STOCK ARTICLE : Showed Resilience With Close in Upper Third of Intra-day Range - 1/27/2020 |
View all notes |
Set NEW NOTE alert |
Company Profile |
SEC
News |
Chart |
Request a new note
C
A
S
I |
CHDN
-
NASDAQ
Churchill Downs Inc
LEISURE - Gaming Activities
|
$142.52
|
-0.45
-0.31% |
$143.52
|
132,991
60.18% of 50 DAV
50 DAV is 221,000
|
$145.73
-2.20%
|
10/8/2019
|
$129.77
|
PP = $132.83
|
|
MB = $139.47
|
Most Recent Note - 1/27/2020 5:28:35 PM
G - Stubbornly holding its ground near its 52-week high following recent gains with light volume. Its 50 DMA line ($134) defines near-term support above the prior low ($132.55 on 1/03/19) The Jun and Sep '19 quarterly earnings versus the year ago periods were both below the +25% minimum guideline (C criteria) and raised fundamental concerns.
>>> FEATURED STOCK ARTICLE : Reversal From High Following 5 Gains With Light Volume - 1/21/2020 |
View all notes |
Set NEW NOTE alert |
Company Profile |
SEC
News |
Chart |
Request a new note
C
A
S
I |
LULU
-
NASDAQ
Lululemon Athletica
MANUFACTURING - Textile Manufacturing
|
$236.74
|
-3.61
-1.50% |
$237.87
|
1,289,122
65.27% of 50 DAV
50 DAV is 1,975,000
|
$247.51
-4.35%
|
9/6/2019
|
$201.25
|
PP = $194.35
|
|
MB = $204.07
|
Most Recent Note - 1/23/2020 4:59:16 PM
G - Still stubbornly holding its ground perched near its all-time high with volume totals cooling. Extended from any sound base. Its 50 DMA line ($228) and prior low ($218.18 on 12/12/19) define important near-term support to watch. Fundamentals remain strong.
>>> FEATURED STOCK ARTICLE : Perched at All-Time High After Gains Lacking Great Volume - 1/9/2020 |
View all notes |
Set NEW NOTE alert |
Company Profile |
SEC
News |
Chart |
Request a new note
C
A
S
I |
Symbol/Exchange
Company Name
Industry Group |
PRICE |
CHANGE
(%Change) |
Day High |
Volume
(% DAV)
(% 50 day avg vol) |
52 Wk Hi
% From Hi |
Featured
Date |
Price
Featured |
Pivot Featured |
|
Max Buy |
CPRT
-
NASDAQ
Copart Inc
SPECIALTY RETAIL - Auto Dealerships
|
$99.50
|
-0.79
-0.79% |
$100.01
|
1,016,667
54.90% of 50 DAV
50 DAV is 1,852,000
|
$101.11
-1.59%
|
1/2/2020
|
$92.80
|
PP = $92.51
|
|
MB = $97.14
|
Most Recent Note - 1/23/2020 4:58:23 PM
G - Perched at its all-time high and its color code is changed to green after wedging above its "max buy" level with gains marked by below average volume. Its 50 DMA line ($90.61) defines near-term support. Fundamentals remain strong.
>>> FEATURED STOCK ARTICLE : Perched at All-Time HIgh Following Recent Volume-Driven Gain - 1/7/2020 |
View all notes |
Set NEW NOTE alert |
Company Profile |
SEC
News |
Chart |
Request a new note
C
A
S
I |
NMIH
-
NASDAQ
N M I Holdings Inc Cl A
Finance-MrtgandRel Svc
|
$32.15
|
-0.51
-1.56% |
$32.62
|
397,843
77.40% of 50 DAV
50 DAV is 514,000
|
$35.79
-10.17%
|
11/8/2019
|
$32.89
|
PP = $31.44
|
|
MB = $33.01
|
Most Recent Note - 1/27/2020 5:30:31 PM
G - Still quietly sputtering, meanwhile, a rebound above the 50 DMA line ($33.19) is needed for its outlook to improve. Prior highs in the $30-31 area define the next important near-term support. Fundamentals remain strong.
>>> FEATURED STOCK ARTICLE : Outlook Hurt by Slump Below 50-Day Moving Average - 1/10/2020 |
View all notes |
Set NEW NOTE alert |
Company Profile |
SEC
News |
Chart |
Request a new note
C
A
S
I |
SPLK
-
NASDAQ
Splunk Inc
Computer Sftwr-Database
|
$153.59
|
-3.41
-2.17% |
$154.99
|
1,351,363
66.37% of 50 DAV
50 DAV is 2,036,000
|
$161.49
-4.89%
|
11/25/2019
|
$147.79
|
PP = $142.16
|
|
MB = $149.27
|
Most Recent Note - 1/22/2020 5:37:21 PM
G - Holding its ground stubbornly near its all-time high following recent gains backed by below average volume, extended from the previously noted base. Its 50 DMA line ($145) and prior highs in the $142-143 area define important support to watch on pullbacks.
>>> FEATURED STOCK ARTICLE : New High Hit With Another Gain on Near Average Volume - 1/8/2020 |
View all notes |
Set NEW NOTE alert |
Company Profile |
SEC
News |
Chart |
Request a new note
C
A
S
I |
PAYC
-
NYSE
Paycom Software Inc
COMPUTER SOFTWARE and SERVICES - Application Software
|
$312.53
|
-2.28
-0.72% |
$314.45
|
9,469,229
1,591.47% of 50 DAV
50 DAV is 595,000
|
$324.00
-3.54%
|
11/20/2019
|
$252.97
|
PP = $259.81
|
|
MB = $272.80
|
Most Recent Note - 1/27/2020 12:33:57 PM
G - Gapped up on 1/23/20 hitting a new all-time high, and it has been stubbornly holding its ground after getting extended from any sound base. Its prior high ($279.95 on 11/27/19) and its 50 DMA line ($271) define important near-term support levels to watch. Fundamentals remain strong.
>>> FEATURED STOCK ARTICLE : Gapped Up for New High But Ended Near Session Low - 1/23/2020 |
View all notes |
Set NEW NOTE alert |
Company Profile |
SEC
News |
Chart |
Request a new note
C
A
S
I |
BLD
-
NYSE
Topbuild Corp
Bldg-Constr Prds/Misc
|
$113.38
|
-0.32
-0.28% |
$114.81
|
206,486
74.81% of 50 DAV
50 DAV is 276,000
|
$119.99
-5.51%
|
12/9/2019
|
$109.71
|
PP = $113.84
|
|
MB = $119.53
|
Most Recent Note - 1/23/2020 4:56:41 PM
Y - Hit another new 52-week high and finished strong with today's 8th consecutive gain backed by volume slightly above average. Recent rebound above its 50 DMA line ($107.42) helped its outlook to improve.
>>> FEATURED STOCK ARTICLE : Fifth Consecutive Gain Leaves TopBuild Near 52-Week High - 1/17/2020 |
View all notes |
Set NEW NOTE alert |
Company Profile |
SEC
News |
Chart |
Request a new note
C
A
S
I |
Symbol/Exchange
Company Name
Industry Group |
PRICE |
CHANGE
(%Change) |
Day High |
Volume
(% DAV)
(% 50 day avg vol) |
52 Wk Hi
% From Hi |
Featured
Date |
Price
Featured |
Pivot Featured |
|
Max Buy |
TEAM
-
NASDAQ
Atlassian Corp Plc Cl A
Comp Sftwr-Spec Enterprs
|
$143.83
|
-2.96
-2.02% |
$146.49
|
2,564,675
177.24% of 50 DAV
50 DAV is 1,447,000
|
$150.71
-4.57%
|
1/24/2020
|
$144.66
|
PP = $140.49
|
|
MB = $147.51
|
Most Recent Note - 1/27/2020 12:39:39 PM
Y - Sputtering today amid widespread market weakness. Gapped up and touched a new all-time high on the prior session, rising from a cup-with-handle base pattern with volume +514% above average behind the considerable gain triggering a technical buy signal. Bullish action came after it reported earnings +48% on +37% sales revenues for the Dec '19 quarter. Fundamentals remained strong while it went through a deep consolidation below its 200 DMA line since dropped from the Featured Stocks list on 9/09/19. See the latest FSU analysis for more details and an annotated graph.
>>> FEATURED STOCK ARTICLE : Gapped Up Today Following Another Strong Earnings Report - 1/24/2020 |
View all notes |
Set NEW NOTE alert |
Company Profile |
SEC
News |
Chart |
Request a new note
C
A
S
I |
GLOB
-
NYSE
Globant SA
Computer-Tech Services
|
$123.25
|
-0.93
-0.75% |
$124.37
|
883,044
317.64% of 50 DAV
50 DAV is 278,000
|
$126.79
-2.79%
|
11/14/2019
|
$106.87
|
PP = $112.43
|
|
MB = $118.05
|
Most Recent Note - 1/27/2020 5:27:01 PM
G - Color code is changed to green after rising above its "max buy" level. Showed resilience today and ended in the upper third of its intra-day range with a small loss on higher volume after wedging to new highs with recent gains lacking great volume conviction. Its 50 DMA line ($107.40) defines important near-term support to watch on pullbacks. Fundamentals remain strong.
>>> FEATURED STOCK ARTICLE : Gain for New High Today Backed by Only +12% Above Average Volume - 1/15/2020 |
View all notes |
Set NEW NOTE alert |
Company Profile |
SEC
News |
Chart |
Request a new note
C
A
S
I |
STNE
-
NASDAQ
Stoneco Ltd Cl A
Finance-CrdtCard/PmtPr
|
$41.16
|
-1.99
-4.61% |
$42.03
|
2,000,680
100.64% of 50 DAV
50 DAV is 1,988,000
|
$45.62
-9.78%
|
1/22/2020
|
$43.94
|
PP = $45.72
|
|
MB = $48.01
|
Most Recent Note - 1/27/2020 5:19:55 PM
Y - Gapped down today abruptly retreating from near its 52-week high and testing its 50 DMA line ($39.71). More damaging losses would raise concerns. Subsequent gains above the pivot point backed by at least +40% above average volume are needed to trigger a technical buy signal.
>>> FEATURED STOCK ARTICLE : Perched Near High With Best-Ever Close After Volume-Driven Gain - 1/22/2020 |
View all notes |
Set NEW NOTE alert |
Company Profile |
SEC
News |
Chart |
Request a new note
C
A
S
I |
|
|
|
THESE ARE NOT BUY RECOMMENDATIONS!
Comments contained in the body of this report are technical
opinions only. The material herein has been obtained
from sources believed to be reliable and accurate, however,
its accuracy and completeness cannot be guaranteed.
This site is not an investment advisor, hence it does
not endorse or recommend any securities or other investments.
Any recommendation contained in this report may not
be suitable for all investors and it is not to be deemed
an offer or solicitation on our part with respect to
the purchase or sale of any securities. All trademarks,
service marks and trade names appearing in this report
are the property of their respective owners, and are
likewise used for identification purposes only.
This report is a service available
only to active Paid Premium Members.
You may opt-out of receiving report notifications
at any time. Questions or comments may be submitted
by writing to Premium Membership Services 665 S.E. 10 Street, Suite 201 Deerfield Beach, FL 33441-5634 or by calling 1-800-965-8307
or 954-785-1121.
|
|
|