You are not logged in.
This means you
CAN ONLY VIEW reports that were published prior to Monday, April 14, 2025.
You
MUST UPGRADE YOUR MEMBERSHIP if you want to see any current reports.
AFTER MARKET UPDATE - THURSDAY, JANUARY 27TH, 2011
Previous After Market Report Next After Market Report >>>
|
|
|
|
DOW |
+4.39 |
11,989.83 |
+0.04% |
|
Volume |
991,593,040 |
-15% |
|
Volume |
1,960,068,150 |
-1% |
|
NASDAQ |
+15.78 |
2,755.28 |
+0.58% |
|
Advancers |
1,653 |
53% |
|
Advancers |
1,361 |
49% |
|
S&P 500 |
+2.91 |
1,299.54 |
+0.22% |
|
Decliners |
1,354 |
43% |
|
Decliners |
1,297 |
47% |
|
Russell 2000 |
+1.71 |
795.43 |
+0.22% |
|
52 Wk Highs |
255 |
|
|
52 Wk Highs |
159 |
|
|
S&P 600 |
+1.82 |
423.82 |
+0.43% |
|
52 Wk Lows |
9 |
|
|
52 Wk Lows |
14 |
|
|
 |
Major Averages Post Small Gains On Lighter Volume
Kenneth J. Gruneisen - Passed the CAN SLIM® Master's Exam
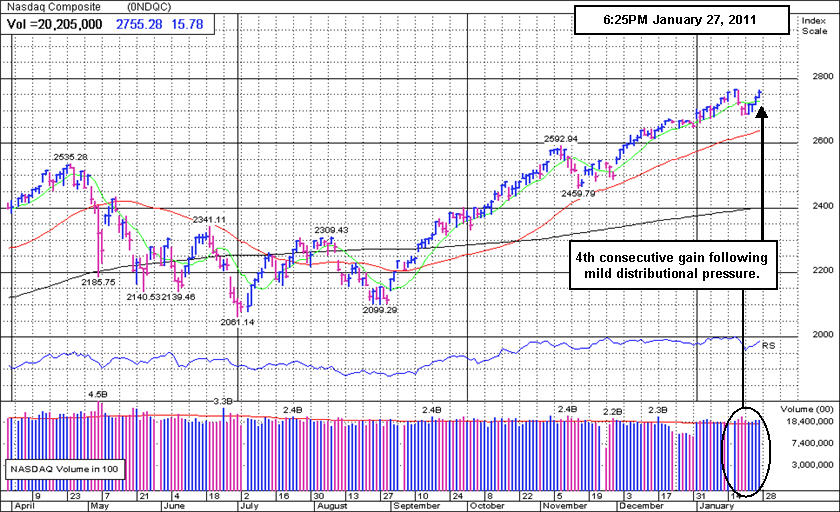
The S&P 500 Index reached the 1,300 mark for the first time since August of 2008. Advancing issues beat decliners by 4-3 on the NYSE and by 14-13 on the Nasdaq. Volume totals were lighter on the major exchanges, whereas Wednesday's reassuring gains were backed with a volume surge that provided an indication of institutional accumulation. The total number of 52-week highs solidly outnumbered new 52-week lows on the NYSE and on the Nasdaq exchange. There was a total of 68 high-ranked companies from the CANSLIM.net Leaders List that made new 52-week highs and appeared on the CANSLIM.net BreakOuts Page, up from the total of 59 on the prior session. On the Featured Stocks Page there were gains from 17 out of the 21 high-ranked leaders currently listed, and Netflix Inc (NFLX +15.4%) was among the standout gainers after its subscribers and revenue surged in the fourth quarter.
The market struggled to overcome a disappointing report on the labor market. Initial jobless claims soared to 454,000 in the latest week, well above expectations for 405,000. News on the housing market helped offset the employment numbers after pending home sales rose +2.0% in December, above expectations. Financial and technology stocks were among the market leaders. The jobs report put pressure on commodity prices, and crude oil fell to its lowest level in eight weeks.
Qualcomm Inc (QCOM +5.86%) was among standout earnings winners. AT&T (T -2.1%) was a drag on the telecommunications group after it reported that new wireless contracts fell to the lowest level in five years.Microsoft corp (MSFT +0.31%) inched higher after posting better-than-expected profits in the final half hour of trading.
Wednesday's fresh expansion in leadership (new highs) and new recovery highs for the Dow and S&P 500 Index were noted as reassuring signs concerning the "state of the rally" following last week's bout of distribution. Remain watchful in the coming days, however, as earnings news is still likely to be a catalyst for additional market volatility.
PICTURED: The Nasdaq Composite Index posted a 4th consecutive gain after encountering mild distributional pressure last week.
|
 Kenneth J. Gruneisen started out as a licensed stockbroker in August 1987, a couple of months prior to the historic stock market crash that took the Dow Jones Industrial Average down -22.6% in a single day. He has published daily fact-based fundamental and technical analysis on high-ranked stocks online for two decades. Through FACTBASEDINVESTING.COM, Kenneth provides educational articles, news, market commentary, and other information regarding proven investment systems that work in good times and bad.
Comments contained in the body of this report are technical opinions only and are not necessarily those of Gruneisen Growth Corp. The material herein has been obtained from sources believed to be reliable and accurate, however, its accuracy and completeness cannot be guaranteed. Our firm, employees, and customers may effect transactions, including transactions contrary to any recommendation herein, or have positions in the securities mentioned herein or options with respect thereto. Any recommendation contained in this report may not be suitable for all investors and it is not to be deemed an offer or solicitation on our part with respect to the purchase or sale of any securities. |
|
 |
Financial, Retail, Healthcare, and Tech Strength Underpins Rally
Kenneth J. Gruneisen - Passed the CAN SLIM® Master's Exam
The Bank Index ($BKX +1.02%), Broker/Dealer Index ($XBD +1.64%), and Retail Index ($RLX +1.71%) were all positive influences on the major averages, and the Healthcare Index ($HMO +2.11%) also posted a solid gain on Thursday. The Semiconductor Index ($SOX +1.88%) led the tech sector higher, followed by the Internet Index ($IIX +1.68%) and smaller gains from the Biotechnology Index ($BTK +0.26%) and the Networking Index ($NWX +0.39%). Meanwhile, the Gold & Silver Index ($XAU -2.57%) was a laggard as it gave up a big part the prior session's gain. The Oil Services Index ($OSX -0.36%) and Integrated Oil Index ($XOI +0.05%) did not show decisive action.
Charts courtesy www.stockcharts.com
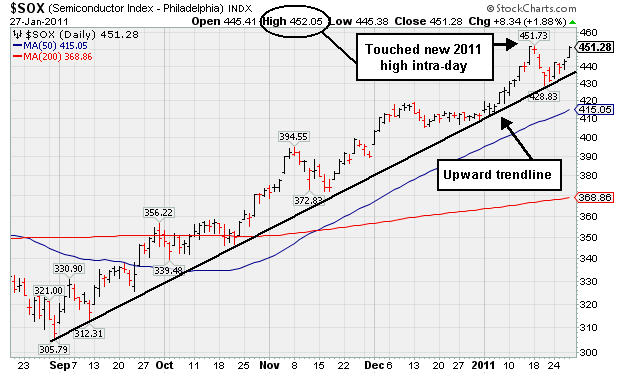
PICTURED: The Semiconductor Index ($SOX +1.88%) touched another new 2011 high, and it has established a clear upward trendline.
| Oil Services |
$OSX |
259.55 |
-0.93 |
-0.36% |
+5.89% |
| Healthcare |
$HMO |
1,906.30 |
+39.45 |
+2.11% |
+12.67% |
| Integrated Oil |
$XOI |
1,276.42 |
+0.61 |
+0.05% |
+5.21% |
| Semiconductor |
$SOX |
451.28 |
+8.34 |
+1.88% |
+9.58% |
| Networking |
$NWX |
299.43 |
+1.17 |
+0.39% |
+6.73% |
| Internet |
$IIX |
318.10 |
+5.26 |
+1.68% |
+3.37% |
| Broker/Dealer |
$XBD |
125.71 |
+2.03 |
+1.64% |
+3.46% |
| Retail |
$RLX |
514.02 |
+8.62 |
+1.71% |
+1.11% |
| Gold & Silver |
$XAU |
198.80 |
-5.24 |
-2.57% |
-12.26% |
| Bank |
$BKX |
53.29 |
+0.54 |
+1.02% |
+2.07% |
| Biotech |
$BTK |
1,309.86 |
+3.45 |
+0.26% |
+0.94% |
|
|
|
 |
Ascending Base Pattern Formed After +84% Rally
Kenneth J. Gruneisen - Passed the CAN SLIM® Master's Exam
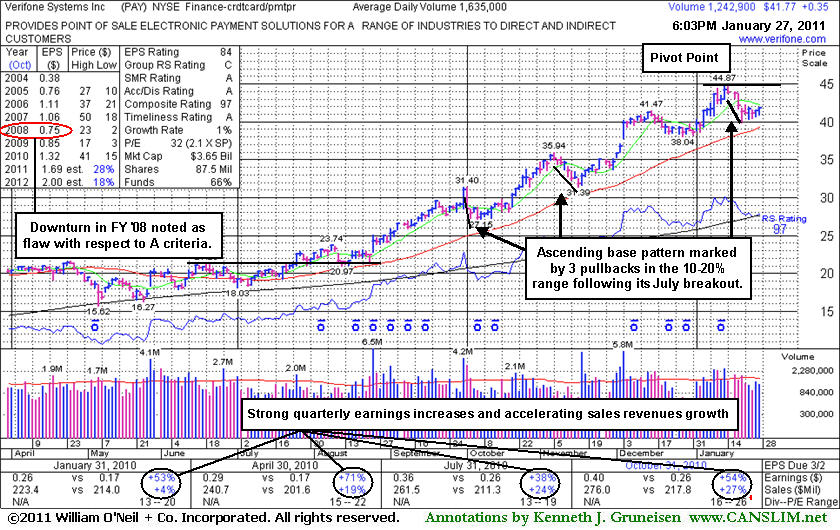
Verifone Systems Inc (PAY +$0.35 or +0.85% to $41.77) is now consolidating -7% off its 52-week high. It has formed a new "ascending base" pattern since breaking out in July. Its 50-day moving average (DMA) line defines important near-term chart support to watch. Its color code was changed to yellow while a new pivot point was cited based on its 52-week high plus ten cents. Subsequent gains with heavy volume may trigger a new (or add-on) technical buy signal.
Disciplined investors would avoid the temptation to get in "early" and watch for compelling proof of fresh institutional buying demand driving it to new highs. The number of top-rated funds owning its shares rose from 380 in March '10 to 500 in December 2010, a nice reassurance concerning the I criteria. It has traded up +84.65% from its price when it was featured on 8/25/10 in yellow at $24.30 in that day's mid-day report (read here) while then rising from a cup-with-handle base.
The downward turn in FY '08 annual earnings (A criteria) was previously noted as a concern, yet its recent bullish action and accelerating sales revenues growth in recent quarterly comparisons provided reassuring signs. Additionally. Leadership (new highs) from other electronic payment-related firms has recently provided reassurances with respect to the L criteria of the fact-based system, even though the Finance - Credit Card Payment Processing group currently has a mediocre Group RS rating of 40.
|
|
|
Color Codes Explained :
Y - Better candidates highlighted by our
staff of experts.
G - Previously featured
in past reports as yellow but may no longer be buyable under the
guidelines.
***Last / Change / Volume data in this table is the closing quote data***
Symbol/Exchange
Company Name
Industry Group |
PRICE |
CHANGE
(%Change) |
Day High |
Volume
(% DAV)
(% 50 day avg vol) |
52 Wk Hi
% From Hi |
Featured
Date |
Price
Featured |
Pivot Featured |
|
Max Buy |
ARUN
-
NASDAQ
Aruba Networks Inc
COMPUTER HARDWARE - Networking andamp; Communication Dev
|
$22.11
|
+0.22
1.01% |
$22.36
|
2,258,931
82.71% of 50 DAV
50 DAV is 2,731,300
|
$26.00
-14.96%
|
1/3/2011
|
$22.55
|
PP = $24.38
|
|
MB = $25.60
|
Most Recent Note - 1/26/2011 4:41:14 PM
G - Finished in the upper third of its intra-day range today, posting a gain after 5 consecutive damaging losses. Recent lows in the $20.50 area define chart support to watch. See the latest FSU analysis for more details and an annotated graph.
>>> The latest Featured Stock Update with an annotated graph appeared on 1/24/2011. Click here.
View all notes |
Alert me of new notes |
CANSLIM.net Company Profile |
SEC |
Zacks Reports |
StockTalk |
News |
Chart |
Request a new note
C
A N
S L
I M


|
CCME
-
NASDAQ
China Mediaexpress Hldgs
FINANCIAL SERVICES - Diversified Investments
|
$22.81
|
+3.25
16.62% |
$23.15
|
5,541,474
434.80% of 50 DAV
50 DAV is 1,274,500
|
$22.30
2.29%
|
1/27/2011
|
$22.37
|
PP = $21.50
|
|
MB = $22.58
|
 Most Recent Note - 1/27/2011 7:11:02 PM
Y - Gapped up today and hit a new 52-week high while rallying from a cup-with-handle type base with more than 4 times average volume behind its considerable gain, triggering a technical buy signal. Color code was changed to yellow with pivot point cited based on its 1/14/11 high plus ten cents.

There are no Featured Stock Updates™ available for this stock at this time. You may request one by clicking the Request a New Note link below
View all notes |
Alert me of new notes |
CANSLIM.net Company Profile |
SEC |
Zacks Reports |
StockTalk |
News |
Chart |
Request a new note
C
A N
S L
I M
|
CIS
-
NYSE
Camelot Info Systems Ads
COMPUTER SOFTWARE andamp; SERVICES - Information Technology Service
|
$25.34
|
-0.51
-1.97% |
$26.14
|
158,018
32.82% of 50 DAV
50 DAV is 481,500
|
$28.18
-10.08%
|
11/26/2010
|
$18.93
|
PP = $19.72
|
|
MB = $20.71
|
Most Recent Note - 1/27/2011 4:34:37 PM
G - Showing some resilience while quietly consolidating above prior highs in the $25 area, well above additional chart support at its 50 DMA line.
>>> The latest Featured Stock Update with an annotated graph appeared on 1/11/2011. Click here.
View all notes |
Alert me of new notes |
CANSLIM.net Company Profile |
SEC |
Zacks Reports |
StockTalk |
News |
Chart |
Request a new note
C
A N
S L
I M
|
DECK
-
NASDAQ
Deckers Outdoor Corp
CONSUMER NON-DURABLES - Textile - Apparel Footwear
|
$76.62
|
+0.88
1.16% |
$77.10
|
1,081,456
56.83% of 50 DAV
50 DAV is 1,903,000
|
$87.88
-12.81%
|
10/27/2010
|
$54.16
|
PP = $54.86
|
|
MB = $57.60
|
Most Recent Note - 1/27/2011 4:37:46 PM
G - Posted a third consecutive gain on lighter volume today. During a streak of 5 consecutive losses it violated its 50 DMA line last week and triggered a technical sell signal. That short term average may now act as resistance. See the latest FSU article for detailed analysis and an annotated graph.
>>> The latest Featured Stock Update with an annotated graph appeared on 1/26/2011. Click here.
View all notes |
Alert me of new notes |
CANSLIM.net Company Profile |
SEC |
Zacks Reports |
StockTalk |
News |
Chart |
Request a new note
C
A N
S L
I M
|
EZCH
-
NASDAQ
Ezchip Semiconductor Ltd
ELECTRONICS - Semiconductor - Specialized
|
$31.15
|
+0.16
0.52% |
$31.20
|
186,712
64.49% of 50 DAV
50 DAV is 289,500
|
$33.20
-6.17%
|
12/2/2010
|
$27.53
|
PP = $26.00
|
|
MB = $27.30
|
Most Recent Note - 1/26/2011 4:31:41 PM
G - Closed near the session high, yet it was down today with above average volume, a sign of distributional pressure. Consolidating above prior chart highs in the $29 area which define initial support to watch well above its 50 DMA line. It is not near a sound base.
>>> The latest Featured Stock Update with an annotated graph appeared on 1/21/2011. Click here.
View all notes |
Alert me of new notes |
CANSLIM.net Company Profile |
SEC |
Zacks Reports |
StockTalk |
News |
Chart |
Request a new note
C
A N
S L
I M
|
Symbol/Exchange
Company Name
Industry Group |
PRICE |
CHANGE
(%Change) |
Day High |
Volume
(% DAV)
(% 50 day avg vol) |
52 Wk Hi
% From Hi |
Featured
Date |
Price
Featured |
Pivot Featured |
|
Max Buy |
EZPW
-
NASDAQ
Ezcorp Inc Cl A
SPECIALTY RETAIL - Specialty Retail, Other
|
$28.36
|
+0.32
1.14% |
$28.55
|
399,193
98.66% of 50 DAV
50 DAV is 404,600
|
$29.94
-5.28%
|
11/5/2010
|
$24.02
|
PP = $23.85
|
|
MB = $25.04
|
Most Recent Note - 1/26/2011 4:35:10 PM
G - Closed near the session high with a considerable gain on above average volume. It promptly rebounded above its 50 DMA line, technically improving its outlook, but it is not near any sound base.
>>> The latest Featured Stock Update with an annotated graph appeared on 12/29/2010. Click here.
View all notes |
Alert me of new notes |
CANSLIM.net Company Profile |
SEC |
Zacks Reports |
StockTalk |
News |
Chart |
Request a new note
C
A N
S L
I M
|
FOSL
-
NASDAQ
Fossil Inc
CONSUMER DURABLES - Recreational Goods, Other
|
$70.90
|
+1.48
2.13% |
$71.20
|
538,091
72.49% of 50 DAV
50 DAV is 742,300
|
$74.34
-4.63%
|
11/26/2010
|
$69.10
|
PP = $70.17
|
|
MB = $73.68
|
Most Recent Note - 1/26/2011 4:38:14 PM
G - Gain today on below average volume, rising toward its 50 DMA line which may now act as resistance. Technical sell signals were triggered by recent damaging losses. A subsequent rally above its 50 DMA line would help its outlook.
>>> The latest Featured Stock Update with an annotated graph appeared on 1/12/2011. Click here.
View all notes |
Alert me of new notes |
CANSLIM.net Company Profile |
SEC |
Zacks Reports |
StockTalk |
News |
Chart |
Request a new note
C
A N
S L
I M
|
HMSY
-
NASDAQ
H M S Holdings Corp
COMPUTER SOFTWARE and SERVICES - Healthcare Information Service
|
$66.23
|
-0.26
-0.39% |
$66.59
|
108,838
71.79% of 50 DAV
50 DAV is 151,600
|
$67.42
-1.77%
|
11/19/2010
|
$61.89
|
PP = $63.01
|
|
MB = $66.16
|
Most Recent Note - 1/26/2011 6:36:55 PM
G - Touched a new high today but closed in the lower half of its intra-day range. Stubbornly holding its ground after a base-on-base type pattern. It found support at its 50 DMA line, while its waning Relative Strength rank (now 73) has been noted as a concern.
>>> The latest Featured Stock Update with an annotated graph appeared on 1/3/2011. Click here.
View all notes |
Alert me of new notes |
CANSLIM.net Company Profile |
SEC |
Zacks Reports |
StockTalk |
News |
Chart |
Request a new note
C
A N
S L
I M
|
JOBS
-
NASDAQ
Fifty One Job Inc Ads
DIVERSIFIED SERVICES - Staffing and; Outsourcing Service
|
$55.80
|
-0.79
-1.40% |
$56.99
|
57,087
36.64% of 50 DAV
50 DAV is 155,800
|
$61.28
-8.94%
|
10/13/2010
|
$42.07
|
PP = $40.60
|
|
MB = $42.63
|
Most Recent Note - 1/24/2011 5:50:13 PM
G - Positive reversal today was somewhat encouraging while consolidating above prior chart highs and its 50 DMA line defining support.
>>> The latest Featured Stock Update with an annotated graph appeared on 12/30/2010. Click here.
View all notes |
Alert me of new notes |
CANSLIM.net Company Profile |
SEC |
Zacks Reports |
StockTalk |
News |
Chart |
Request a new note
C
A N
S L
I M
|
LULU
-
NASDAQ
Lululemon Athletica
MANUFACTURING - Textile Manufacturing
|
$70.30
|
+2.19
3.22% |
$70.47
|
1,319,198
65.49% of 50 DAV
50 DAV is 2,014,200
|
$74.60
-5.76%
|
1/26/2011
|
$68.11
|
PP = $74.70
|
|
MB = $78.44
|
Most Recent Note - 1/27/2011 7:08:29 PM
Y - Closed with another gain on light volume following a positive reversal on the prior session. Color code was changed to yellow with new pivot point cited based on its 52-week high plus 10 cents. Subsequent gains to new highs with at least +50% above average volume may trigger a new (or add-on) technical buy signal, meanwhile any breach of its recent low ($65.30) or its 50 DMA line may trigger a more worrisome sell signal.
>>> The latest Featured Stock Update with an annotated graph appeared on 1/14/2011. Click here.
View all notes |
Alert me of new notes |
CANSLIM.net Company Profile |
SEC |
Zacks Reports |
StockTalk |
News |
Chart |
Request a new note
C
A N
S L
I M
|
Symbol/Exchange
Company Name
Industry Group |
PRICE |
CHANGE
(%Change) |
Day High |
Volume
(% DAV)
(% 50 day avg vol) |
52 Wk Hi
% From Hi |
Featured
Date |
Price
Featured |
Pivot Featured |
|
Max Buy |
MWIV
-
NASDAQ
M W I Veterinary Supply
HEALTH SERVICES - Medical Instruments and; Supplies
|
$63.59
|
-0.83
-1.29% |
$64.48
|
84,086
160.16% of 50 DAV
50 DAV is 52,500
|
$67.13
-5.27%
|
11/4/2010
|
$61.79
|
PP = $59.60
|
|
MB = $62.58
|
Most Recent Note - 1/26/2011 5:01:46 PM
G - Considerable gain with above average volume for a second consecutive session. Closed near the session high today, and the prompt repair of its 50 DMA line violation was a very reassuring sign of support.
>>> The latest Featured Stock Update with an annotated graph appeared on 12/21/2010. Click here.
View all notes |
Alert me of new notes |
CANSLIM.net Company Profile |
SEC |
Zacks Reports |
StockTalk |
News |
Chart |
Request a new note
C
A N
S L
I M
|
NFLX
-
NASDAQ
Netflix Inc
SPECIALTY RETAIL - Music and Video Stores
|
$210.87
|
+27.84
15.21% |
$211.79
|
18,412,442
337.35% of 50 DAV
50 DAV is 5,458,000
|
$206.80
1.97%
|
1/10/2011
|
$187.88
|
PP = $209.34
|
|
MB = $219.81
|
Most Recent Note - 1/27/2011 1:24:26 PM
Y - Considerable gap up gain today following a strong quarterly earnings report, hitting a new 52-week high. Color code was changed to yellow based on its powerful sign of fundamental and technical strength, quickly helping its outlook to improve.
>>> The latest Featured Stock Update with an annotated graph appeared on 1/10/2011. Click here.
View all notes |
Alert me of new notes |
CANSLIM.net Company Profile |
SEC |
Zacks Reports |
StockTalk |
News |
Chart |
Request a new note
C
A N
S L
I M
|
NTAP
-
NASDAQ
Netapp Inc
COMPUTER HARDWARE - Data Storage Devices
|
$55.33
|
+0.16
0.29% |
$55.97
|
8,511,654
151.78% of 50 DAV
50 DAV is 5,607,900
|
$59.79
-7.46%
|
1/6/2011
|
$57.49
|
PP = $58.06
|
|
MB = $60.96
|
Most Recent Note - 1/26/2011 4:29:53 PM
G - After 6 consecutive losses, today's gain on light volume helped it rally to a close back above its 50 DMA line, technically helping its outlook improve.
>>> The latest Featured Stock Update with an annotated graph appeared on 12/27/2010. Click here.
View all notes |
Alert me of new notes |
CANSLIM.net Company Profile |
SEC |
Zacks Reports |
StockTalk |
News |
Chart |
Request a new note
C
A N
S L
I M
|
OPEN
-
NASDAQ
Opentable Inc
INTERNET - Internet Software and Services
|
$79.40
|
+2.20
2.85% |
$81.85
|
1,016,069
128.00% of 50 DAV
50 DAV is 793,800
|
$82.70
-3.98%
|
1/5/2011
|
$74.05
|
PP = $76.79
|
|
MB = $80.63
|
Most Recent Note - 1/27/2011 7:07:16 PM
Y - Up today with higher volume as it rallied back above its pivot point and nearly challenged its all-time high. Recent lows and its 50 DMA line define near-term chart support.
>>> The latest Featured Stock Update with an annotated graph appeared on 1/5/2011. Click here.
View all notes |
Alert me of new notes |
CANSLIM.net Company Profile |
SEC |
Zacks Reports |
StockTalk |
News |
Chart |
Request a new note
C
A N
S L
I M
|
ORCL
-
NASDAQ
Oracle Corp
COMPUTER SOFTWARE and SERVICES - Application Software
|
$32.92
|
+0.36
1.11% |
$33.09
|
25,628,035
90.24% of 50 DAV
50 DAV is 28,400,900
|
$32.73
0.58%
|
1/20/2011
|
$32.31
|
PP = $32.37
|
|
MB = $33.99
|
Most Recent Note - 1/27/2011 7:09:23 PM
Y - Posted another small gain today with below average volume for a new high close. Rallied against a negative market backdrop for a new 52-week high on 1/20/11 with +68% above average volume, rising from an orderly flat base. Color code was changed to yellow with new pivot point cited based on its 12/17/11 high plus ten cents.
>>> The latest Featured Stock Update with an annotated graph appeared on 1/7/2011. Click here.
View all notes |
Alert me of new notes |
CANSLIM.net Company Profile |
SEC |
Zacks Reports |
StockTalk |
News |
Chart |
Request a new note
C
A N
S L
I M
|
Symbol/Exchange
Company Name
Industry Group |
PRICE |
CHANGE
(%Change) |
Day High |
Volume
(% DAV)
(% 50 day avg vol) |
52 Wk Hi
% From Hi |
Featured
Date |
Price
Featured |
Pivot Featured |
|
Max Buy |
PAY
-
NYSE
Verifone Systems Inc
COMPUTER HARDWARE - Transaction Automation Systems
|
$41.77
|
+0.35
0.85% |
$41.88
|
1,242,933
76.63% of 50 DAV
50 DAV is 1,621,900
|
$44.87
-6.91%
|
1/27/2011
|
$41.77
|
PP = $44.00
|
|
MB = $46.20
|
Most Recent Note - 1/27/2011 5:30:17 PM
Y - Now consolidating -7% off its 52-week high, it has formed an ascending base pattern since breaking out in July. Its 50 DMA line defines important near-term chart support to watch. Color code is changed to yellow while a new pivot point is cited based on its 52-week high plus ten cents. Subsequent gains with heavy volume may trigger a new (or add-on) technical buy signal. See the latest FSU article for analysis with an annotated graph.
>>> The latest Featured Stock Update with an annotated graph appeared on 1/27/2011. Click here.
View all notes |
Alert me of new notes |
CANSLIM.net Company Profile |
SEC |
Zacks Reports |
StockTalk |
News |
Chart |
Request a new note
C
A N
S L
I M
|
PCLN
-
NASDAQ
Priceline.Com Inc
INTERNET - Internet Software and Services
|
$437.14
|
+14.44
3.42% |
$439.17
|
1,118,528
119.60% of 50 DAV
50 DAV is 935,200
|
$443.19
-1.37%
|
11/1/2002
|
$399.55
|
PP = $428.20
|
|
MB = $449.61
|
Most Recent Note - 1/27/2011 4:42:52 PM
Y - Solid gain today with +19% above average volume helped it close back above its pivot point, finishing in the upper third of its intra-day range and only -1.4% off its 52-week high. Its 50 DMA line defines important support to watch.
>>> The latest Featured Stock Update with an annotated graph appeared on 1/2/2011. Click here.
View all notes |
Alert me of new notes |
CANSLIM.net Company Profile |
SEC |
Zacks Reports |
StockTalk |
News |
Chart |
Request a new note
C
A N
S L
I M
|
RAX
-
NYSE
Rackspace Hosting Inc
INTERNET - Internet Software and; Services
|
$32.21
|
+0.34
1.07% |
$32.69
|
1,113,918
68.72% of 50 DAV
50 DAV is 1,621,000
|
$35.00
-7.97%
|
1/10/2011
|
$22.84
|
PP = $32.76
|
|
MB = $34.40
|
Most Recent Note - 1/26/2011 6:18:57 PM
G - Recently finding prompt support near its 50 DMA line after negating its 1/11/11 technical breakout. Its recent low ($29.52 on 1/20/10) now defines important support to watch where subsequent violations would raise more serious concerns.
>>> The latest Featured Stock Update with an annotated graph appeared on 12/31/2010. Click here.
View all notes |
Alert me of new notes |
CANSLIM.net Company Profile |
SEC |
Zacks Reports |
StockTalk |
News |
Chart |
Request a new note
C
A N
S L
I M
|
ROVI
-
NASDAQ
Rovi Corp
COMPUTER SOFTWARE andamp; SERVICES - Security Software andamp; Services
|
$64.86
|
+2.16
3.44% |
$65.00
|
1,739,262
111.68% of 50 DAV
50 DAV is 1,557,400
|
$69.50
-6.68%
|
10/29/2010
|
$49.99
|
PP = $53.10
|
|
MB = $55.76
|
Most Recent Note - 1/27/2011 7:03:00 PM
G - Closed near the session high with a solid gain on slightly higher volume today. Upward trendline and its 50 DMA line define chart support to watch. See the latest FSU analysis for additional details and an annotated graph.
>>> The latest Featured Stock Update with an annotated graph appeared on 1/25/2011. Click here.
View all notes |
Alert me of new notes |
CANSLIM.net Company Profile |
SEC |
Zacks Reports |
StockTalk |
News |
Chart |
Request a new note
C
A N
S L
I M
|
UA
-
NYSE
Under Armour Inc Cl A
CONSUMER NON-DURABLES - Textile - Apparel Clothing
|
$59.79
|
+5.91
10.97% |
$59.95
|
3,204,081
484.00% of 50 DAV
50 DAV is 662,000
|
$60.14
-0.58%
|
1/27/2011
|
$58.31
|
PP = $56.99
|
|
MB = $59.84
|
Most Recent Note - 1/27/2011 7:05:55 PM
Y - Closed near the session high after a considerable gap up gain above its 50 DMA line helped it break out from a near-minimum-length 8-week "double bottom" type base identified earlier today. The technical strength was noted as an immediate reaction to strong earnings and sales revenues increases reported for the quarter ended Dec 31, 2011 with positive guidance. Color code was changed to yellow with new pivot point cited based on its 1/19/11 high, and its close above it triggered a new technical buy signal. Previously noted that it may encounter resistance at its 52-week high, and it remains well off its 2007 all-time high ($73.40).
>>> The latest Featured Stock Update with an annotated graph appeared on 12/23/2010. Click here.
View all notes |
Alert me of new notes |
CANSLIM.net Company Profile |
SEC |
Zacks Reports |
StockTalk |
News |
Chart |
Request a new note
C
A N
S L
I M
|
Symbol/Exchange
Company Name
Industry Group |
PRICE |
CHANGE
(%Change) |
Day High |
Volume
(% DAV)
(% 50 day avg vol) |
52 Wk Hi
% From Hi |
Featured
Date |
Price
Featured |
Pivot Featured |
|
Max Buy |
ULTA
-
NASDAQ
Ulta Salon Cosm & Frag
SPECIALTY RETAIL - Specialty Retail, Other
|
$37.06
|
+0.41
1.12% |
$37.16
|
367,071
62.40% of 50 DAV
50 DAV is 588,300
|
$38.25
-3.11%
|
1/6/2011
|
$36.12
|
PP = $37.34
|
|
MB = $39.21
|
Most Recent Note - 1/26/2011 6:22:42 PM
Y - Gain today with light volume helped it close back above its 12/01/10 high close, helping its outlook. Technically it had negated its recent breakout with a close back in its prior base. Perched only -4.2% off its 52-week high, subsequent volume-driven gains above its pivot point would be a very reassuring sign.
>>> The latest Featured Stock Update with an annotated graph appeared on 1/6/2011. Click here.
View all notes |
Alert me of new notes |
CANSLIM.net Company Profile |
SEC |
Zacks Reports |
StockTalk |
News |
Chart |
Request a new note
C
A N
S L
I M
|
|
|
|
THESE ARE NOT BUY RECOMMENDATIONS!
Comments contained in the body of this report are technical
opinions only. The material herein has been obtained
from sources believed to be reliable and accurate, however,
its accuracy and completeness cannot be guaranteed.
This site is not an investment advisor, hence it does
not endorse or recommend any securities or other investments.
Any recommendation contained in this report may not
be suitable for all investors and it is not to be deemed
an offer or solicitation on our part with respect to
the purchase or sale of any securities. All trademarks,
service marks and trade names appearing in this report
are the property of their respective owners, and are
likewise used for identification purposes only.
This report is a service available
only to active Paid Premium Members.
You may opt-out of receiving report notifications
at any time. Questions or comments may be submitted
by writing to Premium Membership Services 665 S.E. 10 Street, Suite 201 Deerfield Beach, FL 33441-5634 or by calling 1-800-965-8307
or 954-785-1121.
|
|
|

