You are not logged in.
This means you
CAN ONLY VIEW reports that were published prior to Monday, April 14, 2025.
You
MUST UPGRADE YOUR MEMBERSHIP if you want to see any current reports.
AFTER MARKET UPDATE - WEDNESDAY, JANUARY 27TH, 2010
Previous After Market Report Next After Market Report >>>
|
|
|
|
DOW |
+41.87 |
10,236.16 |
+0.41% |
|
Volume |
1,300,454,370 |
+16% |
|
Volume |
2,529,213,370 |
+5% |
|
NASDAQ |
+17.68 |
2,221.41 |
+0.80% |
|
Advancers |
1,514 |
48% |
|
Advancers |
1,603 |
57% |
|
S&P 500 |
+5.33 |
1,097.50 |
+0.49% |
|
Decliners |
1,517 |
48% |
|
Decliners |
1,073 |
38% |
|
Russell 2000 |
+6.22 |
618.38 |
+1.02% |
|
52 Wk Highs |
49 |
|
|
52 Wk Highs |
34 |
|
|
S&P 600 |
+3.40 |
330.17 |
+1.04% |
|
52 Wk Lows |
14 |
|
|
52 Wk Lows |
22 |
|
|
 |
Major Averages' Gains on Higher Volume Mark Day 1 of New Rally Effort
Adam Sarhan, Contributing Writer,
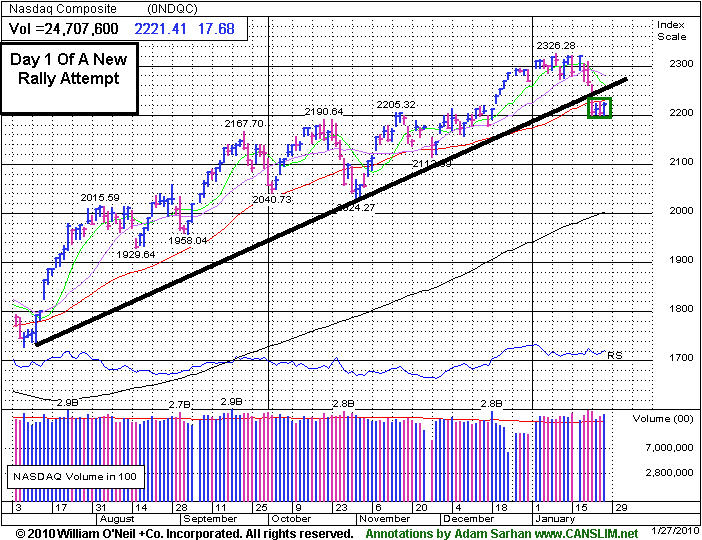
The major averages positively reversed on Wednesday which marked Day 1 of a new rally attempt. It was encouraging to see volume totals on both exchanges expand compared to the prior session, which indicated that large instiutions were accumulating stocks. Decliners and advancers were evenly mixed on the NYSE while advancers led decliners by a 3-to-2 margin on the Nasdaq exchange. There were 10 high-ranked companies from the CANSLIM.net Leaders List that made a new 52-week high and appeared on the CANSLIM.net BreakOuts Page, higher than the 6 issues that appeared on the prior session. New 52-week highs still outnumbered new 52-week lows on the NYSE and on the Nasdaq exchange.
The big news of the day occurred at 2:15pm EST when the Federal Reserve held rates steady and raised their outlook on the economy. In the after meeting commentary, the Fed said it believes "economic activity has continued to strengthen" since its last meeting in December. However, the Fed did not repeat its view that the housing market continues to improve. Investors are concerned that the global economic recovery will be threatened as the Federal Reserve and the European Central Bank begin to curb their massive stimulus measures. They are also concerned that central banks in China, India, Brazil, Israel and Australia might begin aggressively raising rates. In addition to reiterating its stance of leaving rates steady for an "extended period of time" the Fed confirmed its plan to end its program that bought mortgage-backed securities in March.
News on the economic front was less than stellar specifically in the ailing housing market. The Commerce Department said new-home sales plunged by -7.6% to an annual pace of 342,000 which is the lowest reading since March 2009! The report showed that for all of 2009, sales skidded -23% to 374,000 which was the lowest reading since records began in 1963. The negative housing data followed a string of weaker than expected reports released earlier this week.
Looking at the market, Wednesday marked Day 1 of a new rally attempt which means that as long as Wednesday's lows are not breached, the earliest a possible follow-through day could emerge will be this coming Monday. However, if Wednesday's lows are taken out, then the day count will be reset and the chances for a steeper correction increase markedly. It is also important to see how the major averages react to their respective 50-day moving average (DMA) lines. Until they all close above that important level the technical damage remaining on the charts is a concern. So far, the market's reaction has been tepid at best to the latest round of economic and earnings data. Remember that the recent series of distribution days coupled with the deleterious action in the major averages suggests large institutions are aggressively selling stocks. Disciplined investors will now wait for a new follow-through day to be produced before resuming any buying efforts. Until then, patience is key.
Professional Money Management Services - A Winning System - Inquire today!
Our skilled team of portfolio managers knows how to follow the rules of this fact-based investment system. We do not follow opinion or the "conviction list" of some large Wall Street institution which would have us fully invested even during horrific bear markets. Instead, we remain fluid and only buy the best stocks when they are triggering proper technical buy signals. If you are not completely satisfied with the way your portfolio is being managed, Click here to submit your inquiry. *Accounts over $250,000 please. ** Serious inquires only, please.
PICTURED: The Nasdaq Composite posted a gain that marks Day 1 of another new rally attempt.
|
|
|
 |
Financial and Tech Gains Underpin Major Averages' New Rally Effort
Kenneth J. Gruneisen - Passed the CAN SLIM® Master's Exam
Commodity-linked areas ended with modest losses as the Gold & Silver Index ($XAU -0.86%) and Integrated Oil Index ($XOI -0.46%) closed lower and the Oil Services Index ($OSX +0.00%) finished flat. Tech shares posted small gains as the Networking Index ($NWX +0.21%), Internet Index ($IIX +0.67%), Semiconductor Index ($SOX +1.18%), and Biotechnology Index ($BTK +1.25%) collectively rose. Gains from financial group also helped underpin the major averages as the advanced, with respectable gains from the Broker/Dealer Index ($XBD +1.80%) and Bank Index ($BKX +2.91%). The Healthcare Index ($HMO +1.02%) also rose.
Charts courtesy www.stockcharts.com
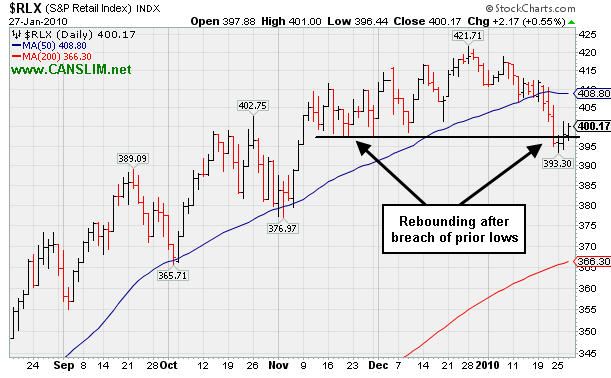
PICTURED: The Retail Index ($RLX +0.55%) remains below its 50-day moving average (DMA) line, but it is making a stand after briefly trading under prior chart lows.
| Oil Services |
$OSX |
200.07 |
+0.01 |
+0.00% |
+2.64% |
| Healthcare |
$HMO |
1,482.64 |
+15.00 |
+1.02% |
+0.66% |
| Integrated Oil |
$XOI |
1,037.79 |
-4.82 |
-0.46% |
-2.85% |
| Semiconductor |
$SOX |
337.45 |
+3.93 |
+1.18% |
-6.24% |
| Networking |
$NWX |
229.69 |
+0.47 |
+0.21% |
-0.59% |
| Internet |
$IIX |
225.55 |
+1.50 |
+0.67% |
-3.55% |
| Broker/Dealer |
$XBD |
115.53 |
+2.04 |
+1.80% |
+0.42% |
| Retail |
$RLX |
400.17 |
+2.17 |
+0.55% |
-2.66% |
| Gold & Silver |
$XAU |
154.73 |
-1.35 |
-0.86% |
-8.04% |
| Bank |
$BKX |
46.70 |
+1.32 |
+2.91% |
+9.34% |
| Biotech |
$BTK |
972.10 |
+12.00 |
+1.25% |
+3.18% |
|
|
|
 |
Recent Damage Leaves High-Ranked Leader Testing Upward Trendline
Kenneth J. Gruneisen - Passed the CAN SLIM® Master's Exam
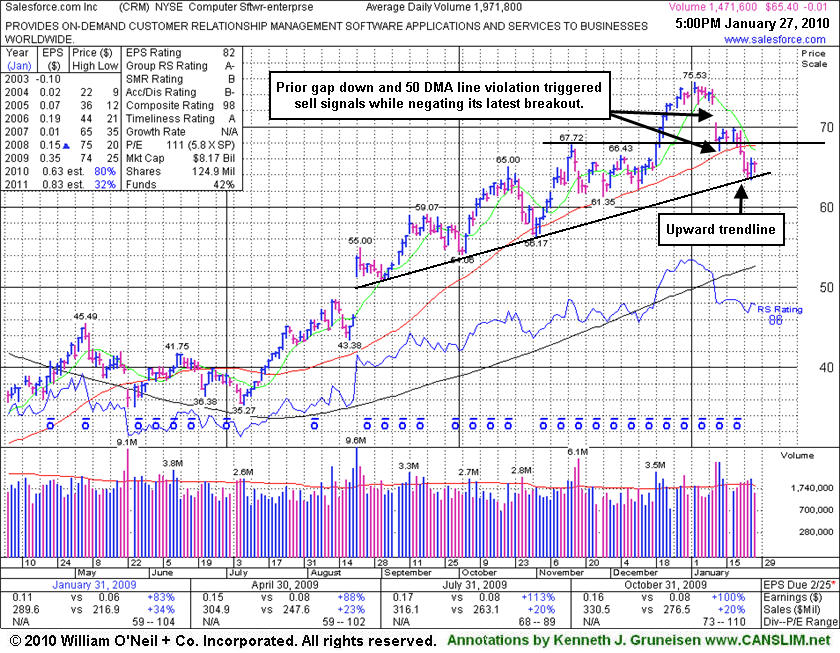
Salesforce.com, Inc. (CRM -$0.01 or -0.02% to $65.40) is struggling since a recent streak of damaging losses led to technical deterioration below its 50-day moving average (DMA) line, and under its November highs, triggering technical sell signals. A damaging gap down on 1/12/10 was noted as "indicative of institutional (I criteria) distribution" shortly after its last appearance in this FSU section on 1/06/10 under the headline "Add To Strong Winners And Always Manage Them Carefully when it was holding its ground, perched very near its $75 all-time high from 2008. An upward trendline connecting its September-January lows now defines an important support level, where any further deterioration to new lows would raise even greater concerns.
With the reassurance of additional heavy institutional buying (the I criteria) demand, add-on buys might have been made by some investors in mid-December within the investment system's guidelines. Investors were reminded previously - "be careful not to average your cost up too much by only buying smaller amounts at higher levels. On pullbacks, shares owned at a lower cost basis may be held, but always limit losses by selling the shares bought later if the stock falls -7% from your higher buy price." As it has weakened, CRM's deterioration has likely prompted disciplined investors to sell any shares bought at the later stage. Market conditions (M criteria) have recently turned for the worse, which adds more emphasis on playing good defense for at least the near-term period until a follow-through day emerges.
|
|
|
Color Codes Explained :
Y - Better candidates highlighted by our
staff of experts.
G - Previously featured
in past reports as yellow but may no longer be buyable under the
guidelines.
***Last / Change / Volume quote data in this table corresponds with the timestamp on the note***
Symbol/Exchange
Company Name
Industry Group |
Last |
Chg. |
Vol
% DAV |
Date Featured |
Price Featured |
Latest Pivot Point
Featured |
Status |
| Latest Max Buy Price |
ARST
-
|
$26.00
|
-0.09
|
329,012
65% DAV
506,000
|
12/22/2009
(Date
Featured) |
$25.94
(Price
Featured) |
PP = $27.20 |
G |
| MB = $28.56 |
Most Recent Note - 1/27/2010 4:16:44 PM
G - Small loss today on light volume, remaining above its 50 DMA line, however distributional pressure completely negated its latest breakout. ARST was first featured in yellow at $19.91 in the 9/01/09 mid-day report with an annotated daily graph (read here).
>>> The latest Featured Stock Update with an annotated graph appeared on 1/21/2010. click here.
|
|
C
A
S
I |
News |
Chart |
SEC
View all notes Alert
me of new notes
Company
Profile
|
ASIA
-
|
$24.85
|
+0.09
|
697,344
55% DAV
1,274,000
|
12/24/2009
(Date
Featured) |
$31.05
(Price
Featured) |
PP = $32.40 |
G |
| MB = $34.02 |
Most Recent Note - 1/27/2010 4:19:52 PM
G - Making a half-hearted stand with another small gain today on lighter volume, its 2nd consecutive gain on light volume after 6 consecutive losses on higher volume. Due to report earnings after the close on Thursday, Jan 28th. Noted on 1/20/10 - "violating its 50-day moving average (DMA) line and breaching recent chart lows, raising concerns and triggering technical sell signals." Traded up as much as +68.13% since first featured in the August 2009 CANSLIM.net News (read here).
>>> The latest Featured Stock Update with an annotated graph appeared on 1/12/2010. click here.
|
|
C
A
S
I |
News |
Chart |
SEC
View all notes Alert
me of new notes
Company
Profile
|
BIDU
- NASDAQ
Baidu Inc Ads
INTERNET - Internet Information Providers
|
$424.36
|
+4.98
|
1,430,602
79% DAV
1,805,900
|
1/13/2010
(Date
Featured) |
$431.25
(Price
Featured) |
PP = $426.75 |
G |
| MB = $448.09 |
Most Recent Note - 1/27/2010 4:21:36 PM
G - Up today on light volume again, closing near its 50 DMA line. Due to report earnings after the close on Friday, January 29th. Gaps down for considerable losses on 1/19 and 1/22 pressured it under its November '09 highs and violated its short-term average line, hurting its outlook after recently spiking to new all-time highs.
>>> The latest Featured Stock Update with an annotated graph appeared on 1/14/2010. click here.
|
|
C
A
S
I |
News |
Chart |
SEC
View all notes Alert
me of new notes
Company
Profile
|
CACC
- NASDAQ
Credit Acceptance Corp
FINANCIAL SERVICES - Credit Services
|
$52.64
|
+3.17
|
84,183
181% DAV
46,500
|
9/29/2009
(Date
Featured) |
$33.48
(Price
Featured) |
PP = $37.10 |
G |
| MB = $38.96 |
Most Recent Note - 1/27/2010 4:22:47 PM
G - Posted a big gain today with above average volume for a new all-time high. Extended from any sound base, it is well above its 50 DMA line, an important support level to watch. On Monday Jan 25th the company announced the pricing of $250 Million Senior Secured Notes.
>>> The latest Featured Stock Update with an annotated graph appeared on 1/8/2010. click here.
|
|
C
A
S
I |
News |
Chart |
SEC
View all notes Alert
me of new notes
Company
Profile
|
CRM
- NYSE
Salesforce.com Inc
INTERNET - Internet Software & Services
|
$65.40
|
-0.01
|
1,482,703
75% DAV
1,971,800
|
12/18/2009
(Date
Featured) |
$67.32
(Price
Featured) |
PP = $67.82 |
G |
| MB = $71.21 |
Most Recent Note - 1/27/2010 4:26:51 PM
G - Holding its ground, but the longer it remains below its 50 DMA line the worse its outlook becomes. Previously noted weakness triggered technical sell signals. A damaging gap down on 1/12/10 was noted as "indicative of institutional (I criteria) distribution."
>>> The latest Featured Stock Update with an annotated graph appeared on 1/27/2010. click here.
|
|
C
A
S
I |
News |
Chart |
SEC
View all notes Alert
me of new notes
Company
Profile
|
CTRP
- NASDAQ
Ctrip.com Intl Ltd Adr
LEISURE - Resorts & Casinos
|
$32.26
|
-0.41
|
3,668,840
175% DAV
2,091,700
|
1/14/2010
(Date
Featured) |
$36.67
(Price
Featured) |
PP = $39.35 |
G |
| MB = $41.32 |
Most Recent Note - 1/27/2010
G - Loss on above average volume today, but it closed in the upper third of its intra-day range, suggesting that support was being found. Damaging losses with above average volume last week violated its 50 DMA line and recent chart lows, triggering technical sell signals. Do not be confused by the 2:1 split effective as of 1/21/10. PP and Featured Price adjusted for split.
>>> The latest Featured Stock Update with an annotated graph appeared on 1/20/2010. click here.
|
|
C
A
S
I |
News |
Chart |
SEC
View all notes Alert
me of new notes
Company
Profile
|
GMCR
- NASDAQ
Green Mtn Coffee Roastrs
FOOD & BEVERAGE - Processed & Packaged Goods
|
$80.02
|
-0.23
|
1,631,489
101% DAV
1,608,200
|
12/28/2009
(Date
Featured) |
$77.49
(Price
Featured) |
PP = $76.50 |
G |
| MB = $80.33 |
Most Recent Note - 1/27/2010 4:45:21 PM
G - Reported very strong earnings and sales increases for the quarter ended Dec 31, 2009 after today's close. It has been consolidating in a tight trading range for the past 4 weeks while perched near all-time highs. Keep in mind that market conditions (M criteria) have recently turned less favorable for stock buyers. Until a new follow-through day emerges investors' bias per the investment system rules should be toward raising cash, rather than accumulating shares. Support to watch is at prior high closes in the $76-77 area.
>>> The latest Featured Stock Update with an annotated graph appeared on 1/13/2010. click here.
|
|
C
A
S
I |
News |
Chart |
SEC
View all notes Alert
me of new notes
Company
Profile
|
HEAT
-
|
$12.34
|
-0.93
|
461,021
N/A
|
1/6/2010
(Date
Featured) |
$17.19
(Price
Featured) |
PP = $17.27 |
|
| MB = $18.13 |
Most Recent Note - 1/27/2010
Loss today on lighter volume has it -33% from its 52-week high and now trading under its September-October highs which are a likely chart support level. Based on recent damaging technical action it will be dropped from the Featured Stocks list tonight. Last week's 50 DMA line violation triggered a technical sell signal.
>>> The latest Featured Stock Update with an annotated graph appeared on 1/19/2010. click here.
|
|
C
A
S
I |
News |
Chart |
SEC
View all notes Alert
me of new notes
Company
Profile
|
ISRG
- NASDAQ
Intuitive Surgical Inc
HEALTH SERVICES - Medical Appliances & Equipment
|
$339.21
|
+3.76
|
548,394
109% DAV
502,600
|
1/22/2010
(Date
Featured) |
$340.40
(Price
Featured) |
PP = $314.00 |
Y |
| MB = $329.70 |
Most Recent Note - 1/27/2010 4:48:52 PM
Y - Holding its ground stubbornly near its 52-week high since featured in yellow in the 1/22/10 mid-day report (read here). Its annual earnings history (the A criteria) has been very impressive. ISRG has rebounded impressively from its March low ($84.86) and may be on course for its all-time high ($359 in 2007). Notes outlined technical deterioration before and when it was last dropped from the Featured Stocks list on 6/10/08. ISRG traded up more than 13-fold since first featured in yellow in CANSLIM.net reports in the summer of 2004.
>>> The latest Featured Stock Update with an annotated graph appeared on 1/22/2010. click here.
|
|
C
A
S
I |
News |
Chart |
SEC
View all notes Alert
me of new notes
Company
Profile
|
LFT
-
|
$35.34
|
+0.21
|
545,936
116% DAV
472,200
|
11/17/2009
(Date
Featured) |
$31.77
(Price
Featured) |
PP = $33.04 |
G |
| MB = $34.69 |
Most Recent Note - 1/27/2010 4:51:41 PM
G - Positively reversed today for a small gain with above average volume. Trading below its 50 DMA line now, its prior chart highs in the $31-33 area define the next technical support level. Due to report earnings on Wednesday, February 10 after the market close. Widespread weakness in China-based issues has clearly been a factor in recent days.
>>> The latest Featured Stock Update with an annotated graph appeared on 1/26/2010. click here.
|
|
C
A
S
I |
News |
Chart |
SEC
View all notes Alert
me of new notes
Company
Profile
|
PEGA
- NASDAQ
Pegasystems Inc
COMPUTER SOFTWARE & SERVICES - Business Software & Services
|
$37.22
|
+2.49
|
496,270
307% DAV
161,600
|
1/4/2010
(Date
Featured) |
$34.00
(Price
Featured) |
PP = $36.19 |
Y |
| MB = $38.00 |
Most Recent Note - 1/27/2010 4:56:12 PM
Y - Posted a big gain today with volume 3 times average as it broke out above resistance in the $36 area. The high-volume gain above its pivot point triggered a new technical buy signal, and no overhead supply remains to hinder its progress. Negative market conditions (M criteria) are currently an overriding concern prompting caution, since a follow-through day is still needed to confirm a new rally. Found support recently right at its 50 DMA line. After a hiatus from the Featured Stocks list, PEGA was featured again in the January 2010 issue of CANSLIM.net News (read here).
>>> The latest Featured Stock Update with an annotated graph appeared on 1/25/2010. click here.
|
|
C
A
S
I |
News |
Chart |
SEC
View all notes Alert
me of new notes
Company
Profile
|
VIT
-
|
$17.05
|
+0.15
|
755,080
131% DAV
578,000
|
12/24/2009
(Date
Featured) |
$20.07
(Price
Featured) |
PP = $21.17 |
G |
| MB = $22.23 |
Most Recent Note - 1/27/2010 4:57:27 PM
G - Sank to $16.00 earlier today, perfectly matching its 11/19/09 low before positively reversing for a small gain. The 1/22/10 violation of its 50 DMA line triggered a technical sell signal. Distributional pressure raised concerns as it abruptly reversed under its pivot point following its big 1/06/10 gain on heavy volume and 1/11/10 gain on +36% above average volume.
>>> The latest Featured Stock Update with an annotated graph appeared on 1/11/2010. click here.
|
|
C
A
S
I |
News |
Chart |
SEC
View all notes Alert
me of new notes
Company
Profile
|
|
|
|
THESE ARE NOT BUY RECOMMENDATIONS!
Comments contained in the body of this report are technical
opinions only. The material herein has been obtained
from sources believed to be reliable and accurate, however,
its accuracy and completeness cannot be guaranteed.
This site is not an investment advisor, hence it does
not endorse or recommend any securities or other investments.
Any recommendation contained in this report may not
be suitable for all investors and it is not to be deemed
an offer or solicitation on our part with respect to
the purchase or sale of any securities. All trademarks,
service marks and trade names appearing in this report
are the property of their respective owners, and are
likewise used for identification purposes only.
This report is a service available
only to active Paid Premium Members.
You may opt-out of receiving report notifications
at any time. Questions or comments may be submitted
by writing to Premium Membership Services 665 S.E. 10 Street, Suite 201 Deerfield Beach, FL 33441-5634 or by calling 1-800-965-8307
or 954-785-1121.
|
|
|


