You are not logged in.
This means you
CAN ONLY VIEW reports that were published prior to Monday, April 14, 2025.
You
MUST UPGRADE YOUR MEMBERSHIP if you want to see any current reports.
AFTER MARKET UPDATE - WEDNESDAY, JANUARY 26TH, 2011
Previous After Market Report Next After Market Report >>>
|
|
|
|
DOW |
+8.25 |
11,985.44 |
+0.07% |
|
Volume |
1,159,974,170 |
+11% |
|
Volume |
1,978,117,090 |
+5% |
|
NASDAQ |
+20.25 |
2,739.50 |
+0.74% |
|
Advancers |
2,084 |
67% |
|
Advancers |
2,013 |
73% |
|
S&P 500 |
+5.45 |
1,296.63 |
+0.42% |
|
Decliners |
947 |
30% |
|
Decliners |
656 |
24% |
|
Russell 2000 |
+13.76 |
793.72 |
+1.76% |
|
52 Wk Highs |
241 |
|
|
52 Wk Highs |
160 |
|
|
S&P 600 |
+7.10 |
422.00 |
+1.71% |
|
52 Wk Lows |
11 |
|
|
52 Wk Lows |
13 |
|
|
 |
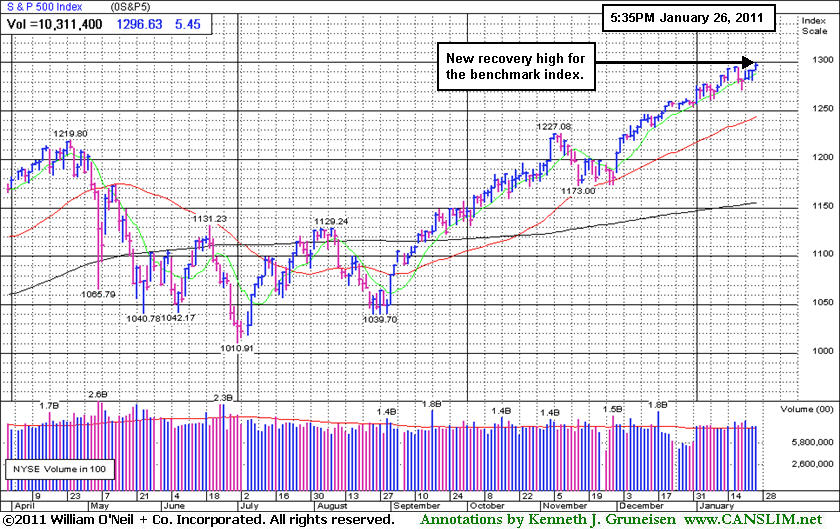
Dow Jones Industrial Average And S&P 500 Index Hit New Recovery Highs
Kenneth J. Gruneisen - Passed the CAN SLIM® Master's Exam
Advancing issues beat decliners by 7-3 on the NYSE and by 3-1 on the Nasdaq. Volume totals were higher on the major exchanges, a reassuring indication of institutional accumulation. The total number of 52-week highs solidly outnumbered new 52-week lows on the NYSE and on the Nasdaq exchange. There was a total of 59 high-ranked companies from the CANSLIM.net Leaders List that made new 52-week highs and appeared on the CANSLIM.net BreakOuts Page, almost tripling the total of 21 on the prior session. On the Featured Stocks Page, 15 out of the 20 high-ranked leaders posted gains.
Wall Street welcomed a better-than-expected report on the housing industry and the Fed’s decision to push forward with $600 billion in securities purchases (its bond-buying program). The central bank gave a lukewarm assessment of the economy and said that, with employment improving only slowly, its benchmark rate will remain at an historic low. Meanwhile, December new home sales jumped 18%, the largest increase since 1992. The number of new houses on the market is at the lowest level since 1968. Shares of homebuilders gained following the report, including Beazer Homes (BZH +2.7%). Mining and energy stocks were also among the session's leaders.
The Dow rose above 12,000 for the first time in two and a half years, but it was unable to hold that level at the close. It was held back by weakness in Boeing Co (BA -3.07%) following a disappointing sales forecast. Xerox Corp (XRX -7.6%) tumbled after the company issued a weak earnings outlook and said its CFO was retiring. Among the standout gainers, Juniper Networks Inc (JNPR +6.40%) said profitability will improve this year. That helped support the Nasdaq, offsetting weakness in Yahoo! (YHOO -2.79%) after a disappointing outlook for revenue.
President Barack Obama delivered his State of the Union address on Tuesday night. Investors should note Wednesday's fresh expansion in leadership (new highs) and new recovery highs for the Dow and S&P 500 Index as a reassuring signs concerning the "state of the rally" after last week's bout of distribution. Remain watchful in the coming days, however, as earnings news is still likely to be a catalyst for additional market volatility.
PICTURED: The S&P 500 Index rallied to another new recovery high.
|
 Kenneth J. Gruneisen started out as a licensed stockbroker in August 1987, a couple of months prior to the historic stock market crash that took the Dow Jones Industrial Average down -22.6% in a single day. He has published daily fact-based fundamental and technical analysis on high-ranked stocks online for two decades. Through FACTBASEDINVESTING.COM, Kenneth provides educational articles, news, market commentary, and other information regarding proven investment systems that work in good times and bad.
Comments contained in the body of this report are technical opinions only and are not necessarily those of Gruneisen Growth Corp. The material herein has been obtained from sources believed to be reliable and accurate, however, its accuracy and completeness cannot be guaranteed. Our firm, employees, and customers may effect transactions, including transactions contrary to any recommendation herein, or have positions in the securities mentioned herein or options with respect thereto. Any recommendation contained in this report may not be suitable for all investors and it is not to be deemed an offer or solicitation on our part with respect to the purchase or sale of any securities. |
|
 |
Commodity-Linked Groups Led Gainers
Kenneth J. Gruneisen - Passed the CAN SLIM® Master's Exam
Commodity-linked groups were among the standout gainers on Wednesday as the Gold & Silver Index ($XAU +3.66%) and Oil Services Index ($OSX +4.60%) charged higher, yet the Integrated Oil Index ($XOI +1.31%) posted a modest gain. The Healthcare Index ($HMO +2.07%) also posted a solid gain, and tech shares had a positive bias as the Internet Index ($IIX +0.39%), Semiconductor Index ($SOX +0.87%), and Biotechnology Index ($BTK +0.89%) were led higher by strength in the Networking Index ($NWX +1.68%). The Broker/Dealer Index ($XBD +0.21%) edged higher, but the Bank Index ($BKX -0.43%) and Retail Index ($RLX -0.15%) created a drag on the major averages and finished with small losses.
Charts courtesy www.stockcharts.com
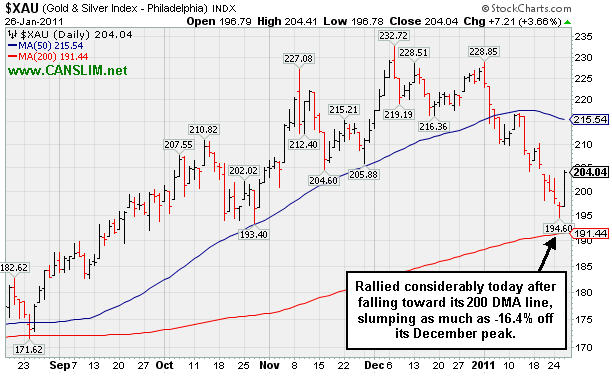
PICTURED: The Gold & Silver Index ($XAU +3.66%) rallied for a considerable gain today after falling toward its 200-day moving average (DMA) line, slumping as much as -16.4% off its early-December 2010 peak.
|
|
|
 |
Short-Term Average Violation Triggered Sell Signal Last Week
Kenneth J. Gruneisen - Passed the CAN SLIM® Master's Exam
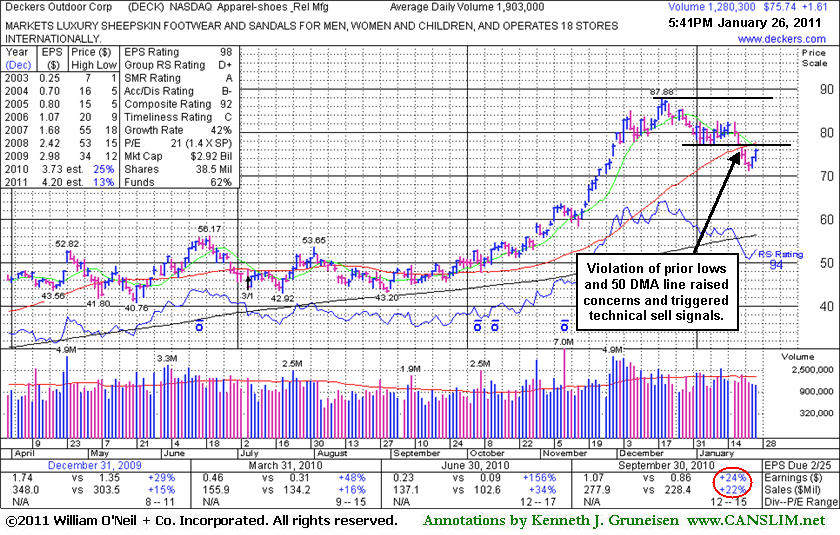
Deckers Outdoor Corp (DECK +$1.61 or +2.17% to $75.74) posted a second consecutive gain on light volume today after a streak of 5 consecutive losses. It violated its 50-day moving average (DMA) line last week amid broad-based weakness in the market (M criteria), raising concerns and triggering a technical sell signal. That important short-term average may now act as resistance. Time is needed for it to possibly form a sound new base, meanwhile it may be prone to a longer an deeper consolidation. For its outlook to improve, gains back above its 50 DMA line with above average volume would be a very reassuring sign.
DECK managed to hit new all-time highs after its last appearance in this FSU section on 12/16/10 under the headline, "Recent Consolidation May Be A New Advanced "3-Weeks Tight", however it subsequently made very little headway then slumped back under its pivot point. Last week's losses led more technical damage. Keep in mind that it traded as much as +67.5% from when it was first featured in yellow in the 6/11/10 mid-day report, having really heated up in the later part of 2010.
The number of top-rated funds owning its shares rose from 474 in Dec '09 to 554 as of Dec '10, a reassuring sign concerning the investment system's I criteria. Earnings were above the +25% minimum guideline in the 5 latest comparisons versus the year ago periods, satisfying the C criteria. This apparel firm has a great annual earnings history (A criteria). Even after a 3:1 split earlier this year, it still has a small supply of only 38.5 million shares outstanding (S criteria), which makes it prone to be a volatile stock in the event of institutional accumulation or distribution. The small supply is favorable, provided proper discipline is used.
|
|
|
Color Codes Explained :
Y - Better candidates highlighted by our
staff of experts.
G - Previously featured
in past reports as yellow but may no longer be buyable under the
guidelines.
***Last / Change / Volume data in this table is the closing quote data***
Symbol/Exchange
Company Name
Industry Group |
PRICE |
CHANGE
(%Change) |
Day High |
Volume
(% DAV)
(% 50 day avg vol) |
52 Wk Hi
% From Hi |
Featured
Date |
Price
Featured |
Pivot Featured |
|
Max Buy |
ARUN
-
NASDAQ
Aruba Networks Inc
COMPUTER HARDWARE - Networking andamp; Communication Dev
|
$21.89
|
+0.82
3.89% |
$22.16
|
3,125,768
114.44% of 50 DAV
50 DAV is 2,731,300
|
$26.00
-15.81%
|
1/3/2011
|
$22.55
|
PP = $24.38
|
|
MB = $25.60
|
 Most Recent Note - 1/26/2011 4:41:14 PM
G - Finished in the upper third of its intra-day range today, posting a gain after 5 consecutive damaging losses. Recent lows in the $20.50 area define chart support to watch. See the latest FSU analysis for more details and an annotated graph.
>>> The latest Featured Stock Update with an annotated graph appeared on 1/24/2011. Click here.
View all notes |
Alert me of new notes |
CANSLIM.net Company Profile |
SEC |
Zacks Reports |
StockTalk |
News |
Chart |
Request a new note
C
A N
S L
I M


|
CIS
-
NYSE
Camelot Info Systems Ads
COMPUTER SOFTWARE andamp; SERVICES - Information Technology Service
|
$25.85
|
-0.03
-0.12% |
$26.55
|
118,154
24.54% of 50 DAV
50 DAV is 481,500
|
$28.18
-8.27%
|
11/26/2010
|
$18.93
|
PP = $19.72
|
|
MB = $20.71
|
Most Recent Note - 1/24/2011 5:46:55 PM
G - Posted another gain, showing some resilience near prior highs in the $25 area.
>>> The latest Featured Stock Update with an annotated graph appeared on 1/11/2011. Click here.
View all notes |
Alert me of new notes |
CANSLIM.net Company Profile |
SEC |
Zacks Reports |
StockTalk |
News |
Chart |
Request a new note
C
A N
S L
I M
|
DECK
-
NASDAQ
Deckers Outdoor Corp
CONSUMER NON-DURABLES - Textile - Apparel Footwear
|
$75.74
|
+1.61
2.17% |
$76.17
|
1,310,199
68.85% of 50 DAV
50 DAV is 1,903,000
|
$87.88
-13.81%
|
10/27/2010
|
$54.16
|
PP = $54.86
|
|
MB = $57.60
|
Most Recent Note - 1/26/2011 4:43:42 PM
G - Posted a second consecutive gain on light volume today after a streak of 5 consecutive losses. It violated its 50 DMA line last week and triggered a technical sell signal. That short term average may now act as resistance.
>>> The latest Featured Stock Update with an annotated graph appeared on 1/26/2011. Click here.
View all notes |
Alert me of new notes |
CANSLIM.net Company Profile |
SEC |
Zacks Reports |
StockTalk |
News |
Chart |
Request a new note
C
A N
S L
I M
|
EZCH
-
NASDAQ
Ezchip Semiconductor Ltd
ELECTRONICS - Semiconductor - Specialized
|
$30.99
|
-0.54
-1.71% |
$31.19
|
394,849
136.39% of 50 DAV
50 DAV is 289,500
|
$33.20
-6.66%
|
12/2/2010
|
$27.53
|
PP = $26.00
|
|
MB = $27.30
|
Most Recent Note - 1/26/2011 4:31:41 PM
G - Closed near the session high, yet it was down today with above average volume, a sign of distributional pressure. Consolidating above prior chart highs in the $29 area which define initial support to watch well above its 50 DMA line. It is not near a sound base.
>>> The latest Featured Stock Update with an annotated graph appeared on 1/21/2011. Click here.
View all notes |
Alert me of new notes |
CANSLIM.net Company Profile |
SEC |
Zacks Reports |
StockTalk |
News |
Chart |
Request a new note
C
A N
S L
I M
|
EZPW
-
NASDAQ
Ezcorp Inc Cl A
SPECIALTY RETAIL - Specialty Retail, Other
|
$28.04
|
+1.48
5.57% |
$28.04
|
657,041
162.39% of 50 DAV
50 DAV is 404,600
|
$29.94
-6.35%
|
11/5/2010
|
$24.02
|
PP = $23.85
|
|
MB = $25.04
|
Most Recent Note - 1/26/2011 4:35:10 PM
G - Closed near the session high with a considerable gain on above average volume. It promptly rebounded above its 50 DMA line, technically improving its outlook, but it is not near any sound base.
>>> The latest Featured Stock Update with an annotated graph appeared on 12/29/2010. Click here.
View all notes |
Alert me of new notes |
CANSLIM.net Company Profile |
SEC |
Zacks Reports |
StockTalk |
News |
Chart |
Request a new note
C
A N
S L
I M
|
Symbol/Exchange
Company Name
Industry Group |
PRICE |
CHANGE
(%Change) |
Day High |
Volume
(% DAV)
(% 50 day avg vol) |
52 Wk Hi
% From Hi |
Featured
Date |
Price
Featured |
Pivot Featured |
|
Max Buy |
FOSL
-
NASDAQ
Fossil Inc
CONSUMER DURABLES - Recreational Goods, Other
|
$69.42
|
+1.56
2.30% |
$69.64
|
516,496
69.58% of 50 DAV
50 DAV is 742,300
|
$74.34
-6.62%
|
11/26/2010
|
$69.10
|
PP = $70.17
|
|
MB = $73.68
|
Most Recent Note - 1/26/2011 4:38:14 PM
G - Gain today on below average volume, rising toward its 50 DMA line which may now act as resistance. Technical sell signals were triggered by recent damaging losses. A subsequent rally above its 50 DMA line would help its outlook.
>>> The latest Featured Stock Update with an annotated graph appeared on 1/12/2011. Click here.
View all notes |
Alert me of new notes |
CANSLIM.net Company Profile |
SEC |
Zacks Reports |
StockTalk |
News |
Chart |
Request a new note
C
A N
S L
I M
|
HMSY
-
NASDAQ
H M S Holdings Corp
COMPUTER SOFTWARE and SERVICES - Healthcare Information Service
|
$66.49
|
+0.33
0.50% |
$67.42
|
170,797
112.66% of 50 DAV
50 DAV is 151,600
|
$67.10
-0.91%
|
11/19/2010
|
$61.89
|
PP = $63.01
|
|
MB = $66.16
|
Most Recent Note - 1/26/2011 6:36:55 PM
G - Touched a new high today but closed in the lower half of its intra-day range. Stubbornly holding its ground after a base-on-base type pattern. It found support at its 50 DMA line, while its waning Relative Strength rank (now 73) has been noted as a concern.
>>> The latest Featured Stock Update with an annotated graph appeared on 1/3/2011. Click here.
View all notes |
Alert me of new notes |
CANSLIM.net Company Profile |
SEC |
Zacks Reports |
StockTalk |
News |
Chart |
Request a new note
C
A N
S L
I M
|
JOBS
-
NASDAQ
Fifty One Job Inc Ads
DIVERSIFIED SERVICES - Staffing and; Outsourcing Service
|
$56.59
|
+1.05
1.89% |
$57.08
|
88,955
57.10% of 50 DAV
50 DAV is 155,800
|
$61.28
-7.65%
|
10/13/2010
|
$42.07
|
PP = $40.60
|
|
MB = $42.63
|
Most Recent Note - 1/24/2011 5:50:13 PM
G - Positive reversal today was somewhat encouraging while consolidating above prior chart highs and its 50 DMA line defining support.
>>> The latest Featured Stock Update with an annotated graph appeared on 12/30/2010. Click here.
View all notes |
Alert me of new notes |
CANSLIM.net Company Profile |
SEC |
Zacks Reports |
StockTalk |
News |
Chart |
Request a new note
C
A N
S L
I M
|
LULU
-
NASDAQ
Lululemon Athletica
MANUFACTURING - Textile Manufacturing
|
$68.11
|
+1.03
1.54% |
$68.39
|
1,445,530
71.77% of 50 DAV
50 DAV is 2,014,200
|
$74.60
-8.70%
|
1/26/2011
|
$68.11
|
PP = $74.70
|
|
MB = $78.44
|
Most Recent Note - 1/26/2011 6:29:19 PM
Y - Overcame early weakness today and closed with a gain for a positive reversal. Color code is changed to yellow with new pivot point cited based on its 52-week high plus 10 cents. Subsequent gains to new highs with at least +50% above average volume may trigger a new (or add-on) technical buy signal, meanwhile any breach of its recent low ($65.30) or its 50 DMA line may trigger a more worrisome sell signal.
>>> The latest Featured Stock Update with an annotated graph appeared on 1/14/2011. Click here.
View all notes |
Alert me of new notes |
CANSLIM.net Company Profile |
SEC |
Zacks Reports |
StockTalk |
News |
Chart |
Request a new note
C
A N
S L
I M
|
MWIV
-
NASDAQ
M W I Veterinary Supply
HEALTH SERVICES - Medical Instruments and; Supplies
|
$64.42
|
+2.26
3.64% |
$64.66
|
76,091
144.94% of 50 DAV
50 DAV is 52,500
|
$67.13
-4.04%
|
11/4/2010
|
$61.79
|
PP = $59.60
|
|
MB = $62.58
|
Most Recent Note - 1/26/2011 5:01:46 PM
G - Considerable gain with above average volume for a second consecutive session. Closed near the session high today, and the prompt repair of its 50 DMA line violation was a very reassuring sign of support.
>>> The latest Featured Stock Update with an annotated graph appeared on 12/21/2010. Click here.
View all notes |
Alert me of new notes |
CANSLIM.net Company Profile |
SEC |
Zacks Reports |
StockTalk |
News |
Chart |
Request a new note
C
A N
S L
I M
|
Symbol/Exchange
Company Name
Industry Group |
PRICE |
CHANGE
(%Change) |
Day High |
Volume
(% DAV)
(% 50 day avg vol) |
52 Wk Hi
% From Hi |
Featured
Date |
Price
Featured |
Pivot Featured |
|
Max Buy |
NFLX
-
NASDAQ
Netflix Inc
SPECIALTY RETAIL - Music and Video Stores
|
$183.03
|
-3.71
-1.99% |
$187.59
|
8,412,858
154.14% of 50 DAV
50 DAV is 5,458,000
|
$206.80
-11.49%
|
1/10/2011
|
$187.88
|
PP = $209.34
|
|
MB = $219.81
|
Most Recent Note - 1/26/2011 4:27:24 PM
G - Down today with above average volume, closing back below its 50 DMA line again. Now -12.5% off its 52-week high, its color code was changed to green based on its technical weakness shortly after a new pivot point was cited. Gains above its recent high ($194.84) are needed for its outlook to improve.
>>> The latest Featured Stock Update with an annotated graph appeared on 1/10/2011. Click here.
View all notes |
Alert me of new notes |
CANSLIM.net Company Profile |
SEC |
Zacks Reports |
StockTalk |
News |
Chart |
Request a new note
C
A N
S L
I M
|
NTAP
-
NASDAQ
Netapp Inc
COMPUTER HARDWARE - Data Storage Devices
|
$55.17
|
+1.47
2.74% |
$55.40
|
4,297,982
76.64% of 50 DAV
50 DAV is 5,607,900
|
$59.79
-7.73%
|
1/6/2011
|
$57.49
|
PP = $58.06
|
|
MB = $60.96
|
Most Recent Note - 1/26/2011 4:29:53 PM
G - After 6 consecutive losses, today's gain on light volume helped it rally to a close back above its 50 DMA line, technically helping its outlook improve.
>>> The latest Featured Stock Update with an annotated graph appeared on 12/27/2010. Click here.
View all notes |
Alert me of new notes |
CANSLIM.net Company Profile |
SEC |
Zacks Reports |
StockTalk |
News |
Chart |
Request a new note
C
A N
S L
I M
|
OPEN
-
NASDAQ
Opentable Inc
INTERNET - Internet Software and Services
|
$77.20
|
+0.40
0.52% |
$78.00
|
314,411
39.61% of 50 DAV
50 DAV is 793,800
|
$82.70
-6.64%
|
1/5/2011
|
$74.05
|
PP = $76.79
|
|
MB = $80.63
|
Most Recent Note - 1/25/2011 5:40:31 PM
Y - Gain today with slightly higher volume followed 4 consecutive losses as it rallied back above its pivot point. Recent lows and its 50 DMA line define near-term chart support.
>>> The latest Featured Stock Update with an annotated graph appeared on 1/5/2011. Click here.
View all notes |
Alert me of new notes |
CANSLIM.net Company Profile |
SEC |
Zacks Reports |
StockTalk |
News |
Chart |
Request a new note
C
A N
S L
I M
|
ORCL
-
NASDAQ
Oracle Corp
COMPUTER SOFTWARE and SERVICES - Application Software
|
$32.56
|
+0.27
0.84% |
$32.73
|
21,485,637
75.65% of 50 DAV
50 DAV is 28,400,900
|
$32.68
-0.35%
|
1/20/2011
|
$32.31
|
PP = $32.37
|
|
MB = $33.99
|
Most Recent Note - 1/26/2011 6:32:43 PM
Y - Small gain today with below average volume for a new high close. Rallied against a negative market backdrop for a new 52-week high on 1/20/11 with +68% above average volume, rising from an orderly flat base. Color code was changed to yellow with new pivot point cited based on its 12/17/11 high plus ten cents.
>>> The latest Featured Stock Update with an annotated graph appeared on 1/7/2011. Click here.
View all notes |
Alert me of new notes |
CANSLIM.net Company Profile |
SEC |
Zacks Reports |
StockTalk |
News |
Chart |
Request a new note
C
A N
S L
I M
|
PAY
-
NYSE
Verifone Systems Inc
COMPUTER HARDWARE - Transaction Automation Systems
|
$41.42
|
+0.27
0.66% |
$41.55
|
1,441,678
88.89% of 50 DAV
50 DAV is 1,621,900
|
$44.87
-7.69%
|
11/29/2010
|
$33.96
|
PP = $36.04
|
|
MB = $37.84
|
Most Recent Note - 1/26/2011 6:35:01 PM
G - Now consolidating -7.7% off its 52-week high. Recent lows in the $38 area along with its 50 DMA line define important near-term chart support to watch.
>>> The latest Featured Stock Update with an annotated graph appeared on 12/15/2010. Click here.
View all notes |
Alert me of new notes |
CANSLIM.net Company Profile |
SEC |
Zacks Reports |
StockTalk |
News |
Chart |
Request a new note
C
A N
S L
I M
|
Symbol/Exchange
Company Name
Industry Group |
PRICE |
CHANGE
(%Change) |
Day High |
Volume
(% DAV)
(% 50 day avg vol) |
52 Wk Hi
% From Hi |
Featured
Date |
Price
Featured |
Pivot Featured |
|
Max Buy |
PCLN
-
NASDAQ
Priceline.Com Inc
INTERNET - Internet Software and Services
|
$422.70
|
-6.16
-1.44% |
$428.97
|
911,313
97.45% of 50 DAV
50 DAV is 935,200
|
$443.19
-4.62%
|
11/1/2002
|
$399.55
|
PP = $428.20
|
|
MB = $449.61
|
Most Recent Note - 1/25/2011 5:53:24 PM
Y - Closed at the session high with a small gain today on light volume. Recently testing prior highs in the $426 area previously cited as initial support to watch. Its 50 DMA line ($415.38 now) has flattened out and still defines a very important support level to watch.
>>> The latest Featured Stock Update with an annotated graph appeared on 1/2/2011. Click here.
View all notes |
Alert me of new notes |
CANSLIM.net Company Profile |
SEC |
Zacks Reports |
StockTalk |
News |
Chart |
Request a new note
C
A N
S L
I M
|
RAX
-
NYSE
Rackspace Hosting Inc
INTERNET - Internet Software and; Services
|
$31.87
|
+0.93
3.01% |
$32.23
|
1,445,005
89.14% of 50 DAV
50 DAV is 1,621,000
|
$35.00
-8.94%
|
1/10/2011
|
$22.84
|
PP = $32.76
|
|
MB = $34.40
|
Most Recent Note - 1/26/2011 6:18:57 PM
G - Recently finding prompt support near its 50 DMA line after negating its 1/11/11 technical breakout. Its recent low ($29.52 on 1/20/10) now defines important support to watch where subsequent violations would raise more serious concerns.
>>> The latest Featured Stock Update with an annotated graph appeared on 12/31/2010. Click here.
View all notes |
Alert me of new notes |
CANSLIM.net Company Profile |
SEC |
Zacks Reports |
StockTalk |
News |
Chart |
Request a new note
C
A N
S L
I M
|
ROVI
-
NASDAQ
Rovi Corp
COMPUTER SOFTWARE andamp; SERVICES - Security Software andamp; Services
|
$62.70
|
-0.06
-0.10% |
$63.36
|
1,588,542
102.00% of 50 DAV
50 DAV is 1,557,400
|
$69.50
-9.78%
|
10/29/2010
|
$49.99
|
PP = $53.10
|
|
MB = $55.76
|
Most Recent Note - 1/25/2011 4:55:25 PM
G - Another small loss on light volume today. Upward trendline and its 50 DMA line define chart support to watch. See the latest FSU analysis for additional details and an annotated graph.
>>> The latest Featured Stock Update with an annotated graph appeared on 1/25/2011. Click here.
View all notes |
Alert me of new notes |
CANSLIM.net Company Profile |
SEC |
Zacks Reports |
StockTalk |
News |
Chart |
Request a new note
C
A N
S L
I M
|
UA
-
NYSE
Under Armour Inc Cl A
CONSUMER NON-DURABLES - Textile - Apparel Clothing
|
$53.88
|
+0.88
1.66% |
$54.13
|
819,403
123.78% of 50 DAV
50 DAV is 662,000
|
$60.14
-10.41%
|
9/9/2010
|
$39.99
|
PP = $40.10
|
|
MB = $42.11
|
Most Recent Note - 1/25/2011 5:47:03 PM
G - Loss on above average volume led to a slump further below its 50 DMA line today. It closed in the upper half of its range after an intra-day dip below previously noted recent low ($52.66 on 1 10/11) defining an important chart support level to watch.
>>> The latest Featured Stock Update with an annotated graph appeared on 12/23/2010. Click here.
View all notes |
Alert me of new notes |
CANSLIM.net Company Profile |
SEC |
Zacks Reports |
StockTalk |
News |
Chart |
Request a new note
C
A N
S L
I M
|
ULTA
-
NASDAQ
Ulta Salon Cosm & Frag
SPECIALTY RETAIL - Specialty Retail, Other
|
$36.65
|
+0.60
1.66% |
$36.78
|
374,785
63.71% of 50 DAV
50 DAV is 588,300
|
$38.25
-4.18%
|
1/6/2011
|
$36.12
|
PP = $37.34
|
|
MB = $39.21
|
Most Recent Note - 1/26/2011 6:22:42 PM
Y - Gain today with light volume helped it close back above its 12/01/10 high close, helping its outlook. Technically it had negated its recent breakout with a close back in its prior base. Perched only -4.2% off its 52-week high, subsequent volume-driven gains above its pivot point would be a very reassuring sign.
>>> The latest Featured Stock Update with an annotated graph appeared on 1/6/2011. Click here.
View all notes |
Alert me of new notes |
CANSLIM.net Company Profile |
SEC |
Zacks Reports |
StockTalk |
News |
Chart |
Request a new note
C
A N
S L
I M
|
Symbol/Exchange
Company Name
Industry Group |
PRICE |
CHANGE
(%Change) |
Day High |
Volume
(% DAV)
(% 50 day avg vol) |
52 Wk Hi
% From Hi |
Featured
Date |
Price
Featured |
Pivot Featured |
|
Max Buy |
|
|
|
THESE ARE NOT BUY RECOMMENDATIONS!
Comments contained in the body of this report are technical
opinions only. The material herein has been obtained
from sources believed to be reliable and accurate, however,
its accuracy and completeness cannot be guaranteed.
This site is not an investment advisor, hence it does
not endorse or recommend any securities or other investments.
Any recommendation contained in this report may not
be suitable for all investors and it is not to be deemed
an offer or solicitation on our part with respect to
the purchase or sale of any securities. All trademarks,
service marks and trade names appearing in this report
are the property of their respective owners, and are
likewise used for identification purposes only.
This report is a service available
only to active Paid Premium Members.
You may opt-out of receiving report notifications
at any time. Questions or comments may be submitted
by writing to Premium Membership Services 665 S.E. 10 Street, Suite 201 Deerfield Beach, FL 33441-5634 or by calling 1-800-965-8307
or 954-785-1121.
|
|
|

