You are not logged in.
This means you
CAN ONLY VIEW reports that were published prior to Tuesday, April 22, 2025.
You
MUST UPGRADE YOUR MEMBERSHIP if you want to see any current reports.
AFTER MARKET UPDATE - TUESDAY, JANUARY 26TH, 2010
Previous After Market Report Next After Market Report >>>
|
|
|
|
DOW |
-2.57 |
10,194.29 |
-0.03% |
|
Volume |
1,123,882,140 |
+7% |
|
Volume |
2,410,012,650 |
+11% |
|
NASDAQ |
-7.07 |
2,203.73 |
-0.32% |
|
Advancers |
1,091 |
35% |
|
Advancers |
893 |
32% |
|
S&P 500 |
-4.61 |
1,092.17 |
-0.42% |
|
Decliners |
1,945 |
62% |
|
Decliners |
1,807 |
64% |
|
Russell 2000 |
-5.95 |
612.16 |
-0.96% |
|
52 Wk Highs |
75 |
|
|
52 Wk Highs |
35 |
|
|
S&P 600 |
-2.75 |
326.77 |
-0.83% |
|
52 Wk Lows |
9 |
|
|
52 Wk Lows |
21 |
|
|
 |
Distributional Pressure Leads To More Damaging Losses
Adam Sarhan, Contributing Writer,
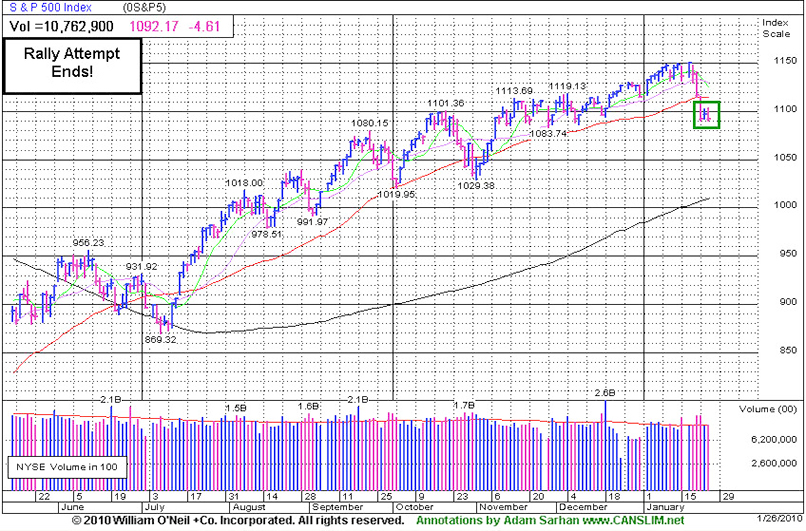
The major averages negatively reversed and violated Monday's lows, closing with losses on heavier volume than the prior session. The ominous action effectively ended the nascent rally attempt and suggested that large institutions are still aggressively selling stocks. Decliners led advancers by almost a 2-to-1 ratio on the NYSE and more than 2-to-1 on the Nasdaq exchange. There were only 6 high-ranked companies from the CANSLIM.net Leaders List that made a new 52-week high and appeared on the CANSLIM.net BreakOuts Page, lower than the 7 issues that appeared on the prior session. New 52-week highs still outnumbered new 52-week lows on the NYSE and on the Nasdaq exchange.
Shares of Apple Inc. (AAPL +1.41%) rose after the company said earnings surged+50%on record sales of Macintosh computers and iPhones. The company's huge numbers were due to an accounting change from the way iPhones are calculated. On Wednesday, the tech giant is slated to release its newest and much anticipated product- a tablet computer. Elsewhere, scores of other companies are slated to release their results this week. So far, approximately three-quarters of the companies that have reported their Q4 results have topped estimates for per-share earnings, but the markets tepid reaction remains a concern.
On the economic front, two important reports were released on Tuesday: the latest read on consumer confidence and the S&P Case/Shiller home price index. The Conference Board’s confidence index beat estimates and rose to 55.9 largely due to a stronger labor market. This helped offset concerns that China's efforts to cool their booming economy will adversely affect the global economy and a disappointing report fromt the ailing housing market. The S&P/Case-Shiller home price index rose for a sixth straight month in 20 major US cities. The index rose +0.2% on a seasonally adjusted basis, but was down -5.3% from November 2008.
Looking at the market, Tuesday's ominous action effectively ended the brief rally attempt and suggests a steeper correction may unfold. It is also important to see how the major averages react to their respective 50-day moving average (DMA) lines. Until they all close above that important level the technical damage remaining on the charts is a concern. So far, the market's reaction has been tepid at best to the latest round of economic and earnings data. Remember that the recent series of distribution days coupled with the deleterious action in the major averages suggests large institutions are aggressively selling stocks. Disciplined investors will now wait for a new follow-through day to be produced before resuming any buying efforts. Until then, patience is paramount.
PICTURED: The benchmark S&P 500 Index negatively reversed and traded below Monday's lows, effectively ending the latest rally attempt.
|
|
|
 |
Financial & Defensive Groups Pulling Back
Kenneth J. Gruneisen - Passed the CAN SLIM® Master's Exam
Typically defensive groups sputtered as there was weakness in the Healthcare Index ($HMO -2.14%), Gold & Silver Index ($XAU -0.74%), and the Integrated Oil Index ($XOI -0.53%) fell. No great conviction was shown by the Semiconductor Index ($SOX -0.20%), Internet Index ($IIX -0.08%), Networking Index ($NWX -0.00%), or the Oil Services Index ($OSX +0.07%). The Biotechnology Index ($BTK +0.25%) and Retail Index ($RLX +0.57%) posted modest gains, however financial shares also created a drag on the major averages as the Broker/Dealer Index ($XBD -1.60%) fell.
Charts courtesy www.stockcharts.com
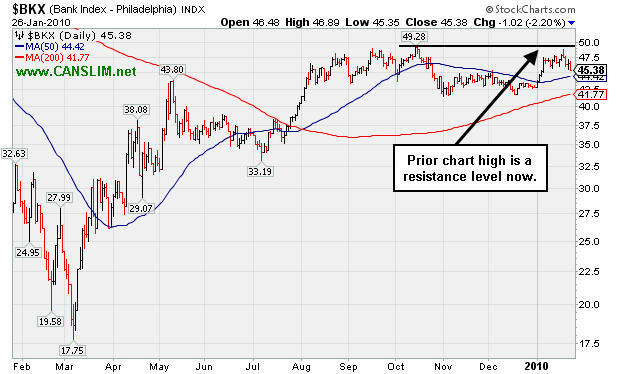
PICTURED: The Bank Index ($BKX -2.20%) is still trading above its 50-day moving average (DMA) line, however its latest rally attempt fizzled just short of prior chart highs. Upward progress above the prior resistance level would be an encouraging sign to watch for in the near-term, meanwhile, any slump back under its 50 DMA line would raise concerns while also hurting the outlook for the broader market.
| Oil Services |
$OSX |
200.06 |
+0.14 |
+0.07% |
+2.64% |
| Healthcare |
$HMO |
1,467.64 |
-32.13 |
-2.14% |
-0.36% |
| Integrated Oil |
$XOI |
1,042.61 |
-5.53 |
-0.53% |
-2.40% |
| Semiconductor |
$SOX |
333.52 |
-0.66 |
-0.20% |
-7.33% |
| Networking |
$NWX |
229.22 |
-0.01 |
-0.00% |
-0.80% |
| Internet |
$IIX |
224.05 |
-0.18 |
-0.08% |
-4.19% |
| Broker/Dealer |
$XBD |
113.49 |
-1.85 |
-1.60% |
-1.36% |
| Retail |
$RLX |
398.00 |
+2.24 |
+0.57% |
-3.19% |
| Gold & Silver |
$XAU |
156.08 |
-1.16 |
-0.74% |
-7.23% |
| Bank |
$BKX |
45.38 |
-1.02 |
-2.20% |
+6.25% |
| Biotech |
$BTK |
960.10 |
+2.41 |
+0.25% |
+1.91% |
|
|
|
 |
China-Based Leader Recently Backpedaling Along With Others
Kenneth J. Gruneisen - Passed the CAN SLIM® Master's Exam
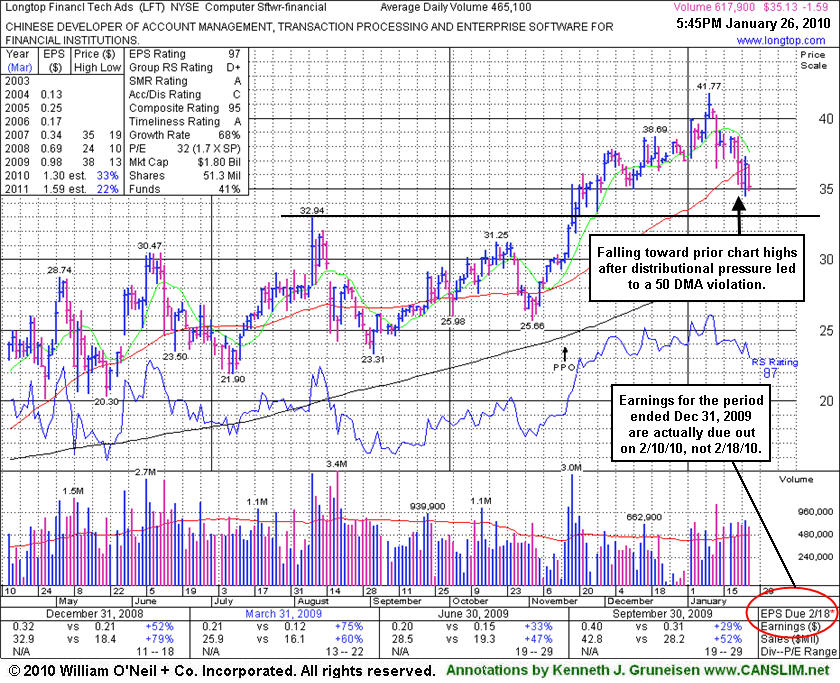
Longtop Financl Tech Ads (LFT -$1.59 or -4.33% to $35.13) suffered another loss on above average volume today, ending at its lowest close since November while promptly slumping back below its 50-day moving average (DMA) line. The company is due to report earnings on Wednesday, February 10 after the market close. Widespread weakness in China-based issues has clearly been a factor in recent days. Its outlook becomes increasingly questionable the longer it remains trading below its 50 DMA line. Meanwhile, prior resistance in the $33 area defines the next an important support level to watch.
News of a proposed offering of additional shares on 11/16/09 seemed well received by the market. Its fundamentals remain strong. The number of top-rated funds owning an interest in its shares rose from 20 funds in Dec '08 to 61 funds in Dec '09, which is reassuring concerning the I criteria. It has reported strong annual and quarterly earnings increases (good concerning the C & A criteria) backed by strong sales revenues increases. Return on Equity of +20% is above the +17% guideline. Upward progress can often be hindered by additional share offerings for the near-term, yet institutional investors typically increase their interest through the process. LFT was first featured at $22.19 on Thursday, April 02, 2009 in the CANSLIM.net Mid Day Breakouts Report (read here).
|
|
|
Color Codes Explained :
Y - Better candidates highlighted by our
staff of experts.
G - Previously featured
in past reports as yellow but may no longer be buyable under the
guidelines.
***Last / Change / Volume quote data in this table corresponds with the timestamp on the note***
Symbol/Exchange
Company Name
Industry Group |
Last |
Chg. |
Vol
% DAV |
Date Featured |
Price Featured |
Latest Pivot Point
Featured |
Status |
| Latest Max Buy Price |
ARST
-
|
$26.09
|
+0.47
|
309,413
61% DAV
510,300
|
12/22/2009
(Date
Featured) |
$25.94
(Price
Featured) |
PP = $27.20 |
G |
| MB = $28.56 |
Most Recent Note - 1/26/2010 4:58:31 PM
G - Posted a 3rd consecutive gain today, rising on ever-decreasing volume since its positive reversal on 1/22/10 for a small gain. It remains above its 50 DMA line, however distributional pressure completely negated its latest breakout. ARST was first featured in yellow at $19.91 in the 9/01/09 mid-day report with an annotated daily graph (read here).
>>> The latest Featured Stock Update with an annotated graph appeared on 1/21/2010. click here.
|
|
C
A
S
I |
News |
Chart |
SEC
View all notes Alert
me of new notes
Company
Profile
|
ASIA
-
|
$24.76
|
+0.36
|
871,622
68% DAV
1,285,000
|
12/24/2009
(Date
Featured) |
$31.05
(Price
Featured) |
PP = $32.40 |
G |
| MB = $34.02 |
Most Recent Note - 1/26/2010 5:01:55 PM
G - Small gain today on light volume after 6 consecutive losses. Due to report earnings after the close on Thursday, Jan 28th. Making its first stand since noted on 1/20/10 - "violating its 50-day moving average (DMA) line and breaching recent chart lows, raising concerns and triggering technical sell signals." Traded up as much as +68.13% since first featured in the August 2009 CANSLIM.net News (read here).
>>> The latest Featured Stock Update with an annotated graph appeared on 1/12/2010. click here.
|
|
C
A
S
I |
News |
Chart |
SEC
View all notes Alert
me of new notes
Company
Profile
|
BIDU
- NASDAQ
Baidu Inc Ads
INTERNET - Internet Information Providers
|
$419.38
|
+4.22
|
1,395,286
77% DAV
1,821,000
|
1/13/2010
(Date
Featured) |
$431.25
(Price
Featured) |
PP = $426.75 |
G |
| MB = $448.09 |
Most Recent Note - 1/26/2010 5:06:30 PM
G - Gain today on below average volume, remaining below its 50 DMA line. Gaps down for considerable losses on 1/19 & 1/22 pressured it under its November '09 highs and violated its short-term average line, hurting its outlook after recently spiking to new all-time highs.
>>> The latest Featured Stock Update with an annotated graph appeared on 1/14/2010. click here.
|
|
C
A
S
I |
News |
Chart |
SEC
View all notes Alert
me of new notes
Company
Profile
|
CAAS
- NASDAQ
China Automotive Systems
AUTOMOTIVE - Auto Parts
|
$17.17
|
-1.34
|
1,442,776
N/A
|
11/30/2009
(Date
Featured) |
$18.84
(Price
Featured) |
PP = $17.62 |
|
| MB = $18.50 |
Most Recent Note - 1/26/2010
Loss today on higher volume drove it near its December low. Based on weak action it will be dropped from the Featured Stocks list tonight. Violated its short-term average line last week while many China-based firms encountered heavy distributional pressure. CAAS was actually rather late-stage at $18.84 when first featured in the 11/30/09 mid-day report (read here).
>>> The latest Featured Stock Update with an annotated graph appeared on 1/15/2010. click here.
|
|
C
A
S
I |
News |
Chart |
SEC
View all notes Alert
me of new notes
Company
Profile
|
CACC
- NASDAQ
Credit Acceptance Corp
FINANCIAL SERVICES - Credit Services
|
$49.47
|
+0.32
|
40,214
87% DAV
46,300
|
9/29/2009
(Date
Featured) |
$33.48
(Price
Featured) |
PP = $37.10 |
G |
| MB = $38.96 |
Most Recent Note - 1/26/2010 5:13:28 PM
G - Small gain today on light volume, still subbornly holding its ground near all-time highs, but extended from any sound base. It is well above its 50 DMA line, an important support level to watch.
>>> The latest Featured Stock Update with an annotated graph appeared on 1/8/2010. click here.
|
|
C
A
S
I |
News |
Chart |
SEC
View all notes Alert
me of new notes
Company
Profile
|
CRM
- NYSE
Salesforce.com Inc
INTERNET - Internet Software & Services
|
$65.41
|
+1.28
|
2,591,716
133% DAV
1,955,800
|
12/18/2009
(Date
Featured) |
$67.32
(Price
Featured) |
PP = $67.82 |
G |
| MB = $71.21 |
Most Recent Note - 1/26/2010 5:17:42 PM
G - Today's gain on slightly higher volume halted a 4 session streak of losses. It remains below its 50 DMA line and under its November highs after violations triggered technical sell signals. A damaging gap down on 1/12/10 was noted as "indicative of institutional (I criteria) distribution."
>>> The latest Featured Stock Update with an annotated graph appeared on 1/6/2010. click here.
|
|
C
A
S
I |
News |
Chart |
SEC
View all notes Alert
me of new notes
Company
Profile
|
CTRP
- NASDAQ
Ctrip.com Intl Ltd Adr
LEISURE - Resorts & Casinos
|
$32.67
|
+0.03
|
1,636,002
77% DAV
2,126,300
|
1/14/2010
(Date
Featured) |
$36.67
(Price
Featured) |
PP = $39.35 |
G |
| MB = $41.32 |
Most Recent Note - 1/26/2010
G - Positively reversed for a small gain today on lighter volume after initially gapping down. Damaging losses with above average volume last week violated its 50 DMA line and recent chart lows, triggering technical sell signals. Do not be confused by the 2:1 split effective as of 1/21/10.
>>> The latest Featured Stock Update with an annotated graph appeared on 1/20/2010. click here.
|
|
C
A
S
I |
News |
Chart |
SEC
View all notes Alert
me of new notes
Company
Profile
|
GMCR
- NASDAQ
Green Mtn Coffee Roastrs
FOOD & BEVERAGE - Processed & Packaged Goods
|
$80.25
|
+0.27
|
970,081
59% DAV
1,657,300
|
12/28/2009
(Date
Featured) |
$77.49
(Price
Featured) |
PP = $76.50 |
G |
| MB = $80.33 |
Most Recent Note - 1/26/2010 5:24:29 PM
G - Consolidating in a tight trading range for the past 4 weeks while perched near all-time highs. Reporting earnings after the close on Wednesday, Jan 27. Keep in mind that market conditions (M criteria) have recently turned less favorable for stock buyers. Until a new follow-through day emerges investors' bias per the investment system rules should be toward raising cash, rather than accumulating shares. Support to watch is at prior high closes in the $76-77 area.
>>> The latest Featured Stock Update with an annotated graph appeared on 1/13/2010. click here.
|
|
C
A
S
I |
News |
Chart |
SEC
View all notes Alert
me of new notes
Company
Profile
|
HEAT
-
|
$13.27
|
-0.44
|
826,806
64% DAV
1,301,200
|
1/6/2010
(Date
Featured) |
$17.19
(Price
Featured) |
PP = $17.27 |
G |
| MB = $18.13 |
Most Recent Note - 1/26/2010 5:27:35 PM
G - Loss today with lighter volume, trading near September-October highs that may now act as support. Last week's 50 DMA line violation and damaging losses on higher volume triggered technical sell signals
>>> The latest Featured Stock Update with an annotated graph appeared on 1/19/2010. click here.
|
|
C
A
S
I |
News |
Chart |
SEC
View all notes Alert
me of new notes
Company
Profile
|
ISRG
- NASDAQ
Intuitive Surgical Inc
HEALTH SERVICES - Medical Appliances & Equipment
|
$335.45
|
-3.06
|
703,068
140% DAV
503,200
|
1/22/2010
(Date
Featured) |
$340.40
(Price
Featured) |
PP = $314.00 |
Y |
| MB = $329.70 |
Most Recent Note - 1/26/2010 5:28:55 PM
Y - Still holding its ground stubbornly since featured in yellow in the 1/22/10 mid-day report (read here) when hitting a new 52-week high. Its annual earnings history (the A criteria) has been very impressive. ISRG has rebounded impressively from its March low ($84.86) and may be on course for its all-time high ($359 in 2007). Notes outlined technical deterioration before and when it was last dropped from the Featured Stocks list on 6/10/08. ISRG traded up more than 13-fold since first featured in yellow in CANSLIM.net reports in the summer of 2004.
>>> The latest Featured Stock Update with an annotated graph appeared on 1/22/2010. click here.
|
|
C
A
S
I |
News |
Chart |
SEC
View all notes Alert
me of new notes
Company
Profile
|
LFT
-
|
$35.13
|
-1.59
|
619,439
133% DAV
465,100
|
11/17/2009
(Date
Featured) |
$31.77
(Price
Featured) |
PP = $33.04 |
G |
| MB = $34.69 |
Most Recent Note - 1/26/2010 5:33:01 PM
G - Loss today with above average volume for its lowest close since November, promptly slumping back below its 50 DMA line. Due to report earnings on Wednesday, February 10 after the market close. Widespread weakness in China-based issues has clearly been a factor in recent days.
>>> The latest Featured Stock Update with an annotated graph appeared on 1/26/2010. click here.
|
|
C
A
S
I |
News |
Chart |
SEC
View all notes Alert
me of new notes
Company
Profile
|
PEGA
- NASDAQ
Pegasystems Inc
COMPUTER SOFTWARE & SERVICES - Business Software & Services
|
$34.73
|
+1.80
|
284,971
177% DAV
161,400
|
1/4/2010
(Date
Featured) |
$34.00
(Price
Featured) |
PP = $36.19 |
Y |
| MB = $38.00 |
Most Recent Note - 1/26/2010 5:36:29 PM
Y - Considerable gain today above average volume, rallying up from its 50 DMA line - a textbook chart support level. Prior highs in the $35-36 area have been a stubborn resistance level since featured in the January 2010 issue of CANSLIM.net News (read here).
>>> The latest Featured Stock Update with an annotated graph appeared on 1/25/2010. click here.
|
|
C
A
S
I |
News |
Chart |
SEC
View all notes Alert
me of new notes
Company
Profile
|
VIT
-
|
$16.90
|
-0.66
|
440,708
77% DAV
574,700
|
12/24/2009
(Date
Featured) |
$20.07
(Price
Featured) |
PP = $21.17 |
G |
| MB = $22.23 |
Most Recent Note - 1/26/2010 5:39:39 PM
G - Falling near its December lows, its loss today on light volume showed a lack of support since violating its 50 DMA line and triggering a technical sell signal. Distributional pressure raised concerns as it abruptly reversed under its pivot point following its big 1/06/10 gain on heavy volume and 1/11/10 gain on +36% above average volume.
>>> The latest Featured Stock Update with an annotated graph appeared on 1/11/2010. click here.
|
|
C
A
S
I |
News |
Chart |
SEC
View all notes Alert
me of new notes
Company
Profile
|
|
|
|
THESE ARE NOT BUY RECOMMENDATIONS!
Comments contained in the body of this report are technical
opinions only. The material herein has been obtained
from sources believed to be reliable and accurate, however,
its accuracy and completeness cannot be guaranteed.
This site is not an investment advisor, hence it does
not endorse or recommend any securities or other investments.
Any recommendation contained in this report may not
be suitable for all investors and it is not to be deemed
an offer or solicitation on our part with respect to
the purchase or sale of any securities. All trademarks,
service marks and trade names appearing in this report
are the property of their respective owners, and are
likewise used for identification purposes only.
This report is a service available
only to active Paid Premium Members.
You may opt-out of receiving report notifications
at any time. Questions or comments may be submitted
by writing to Premium Membership Services 665 S.E. 10 Street, Suite 201 Deerfield Beach, FL 33441-5634 or by calling 1-800-965-8307
or 954-785-1121.
|
|
|


