You are not logged in.
This means you
CAN ONLY VIEW reports that were published prior to Monday, February 26, 2024.
You
MUST UPGRADE YOUR MEMBERSHIP if you want to see any current reports.
AFTER MARKET UPDATE - FRIDAY, JANUARY 25TH, 2019
Previous After Market Report Next After Market Report >>>
|
|
|
|
DOW |
+183.96 |
24,737.20 |
+0.75% |
|
Volume |
863,800,890 |
+9% |
|
Volume |
2,419,501,120 |
+2% |
|
NASDAQ |
+91.40 |
7,164.86 |
+1.29% |
|
Advancers |
2,271 |
77% |
|
Advancers |
2,192 |
72% |
|
S&P 500 |
+21.40 |
2,663.73 |
+0.81% |
|
Decliners |
688 |
23% |
|
Decliners |
854 |
28% |
|
Russell 2000 |
+18.42 |
1,482.83 |
+1.26% |
|
52 Wk Highs |
50 |
|
|
52 Wk Highs |
41 |
|
|
S&P 600 |
+10.30 |
922.98 |
+1.13% |
|
52 Wk Lows |
5 |
|
|
52 Wk Lows |
21 |
|
|
 |
Leadership Improved as Major Indices Rallied
Kenneth J. Gruneisen - Passed the CAN SLIM® Master's Exam
The S&P 500 posted its first weekly decline of 2019, losing 0.2%. Meanwhile, the Dow and Nasdaq both added 0.1% for the week. Stocks finished firmly higher Friday. The Dow added 183 points to 24,737 while the S&P 500 gained 22 points to 2,664. The Nasdaq Composite climbed 91 points to 7,164. The volume totals were higher than the prior session on the NYSE and on the Nasdaq exchange. Breadth was positive as advancers led decliners by more than a 3-1 margin on the NYSE and 11-4 on the Nasdaq exchange. Leadership improved as there were 20 high-ranked companies from the Leaders List that made a new 52-week high and were listed on the BreakOuts Page, doubling the total of 10 on the prior session. New 52-week highs outnumbered new 52-week lows on the NYSE and on the Nasdaq exchange versus the prior session. The major indices are in a confirmed uptrend after recently noted improvements helped to signal a change in market direction (M criteria) back to a bullish stance. The Featured Stocks Page provides the most timely analysis on high-ranked leaders. Charts used courtesy of www.stockcharts.com
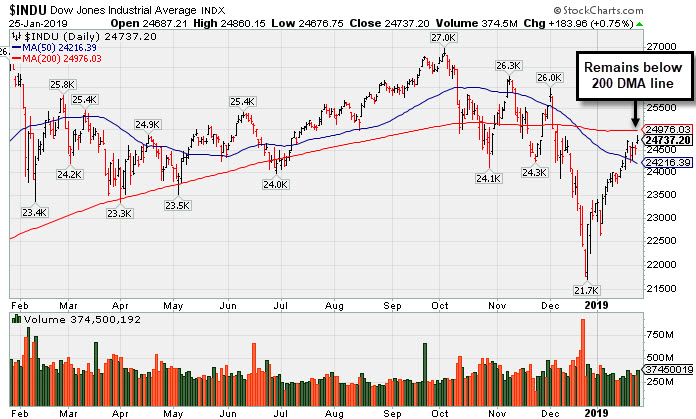
PICTURED: The Dow Jones Industrial Average ended -8.2% off its record high hit on 10/03/18. It recently rebounded above its 50-day moving average (DMA) line. Long-time readers may note from that the major averages cannot be considered to be in "healthy" shape while they are below their respective 200 DMA lines.
The major averages advanced amid a flurry of corporate earnings reports. Stocks were also boosted after U.S. lawmakers agreed to a short-term deal to end the partial government shutdown. A separate report that the Federal Reserve may end its balance sheet reduction program sooner than anticipated further improved sentiment. On the data front, scheduled updates on new home sales and durable goods orders have been postponed due to the government impasse.
Nine of 11 S&P 500 sectors ended in positive territory. The Materials group paced gains with DowDuPont (DWDP +2.54%) rising. In earnings news, Intel (INTC -5.47%) shares sank after falling short of revenue estimates and lowering its current quarter guidance. Western Digital (WDC +7.52%) rose after management announced an $800 million expense reduction plan. Meanwhile, Starbucks (SBUX +3.63%) rose after the coffee maker beat earnings forecasts citing strong domestic drink sales.
Treasuries weakened with the yield on the 10-year note adding four basis points to 2.75%. In commodities, WTI crude advanced 0.8% to $53.56/barrel. COMEX gold climbed 1.5% to $1,298.50/ounce amid a weaker dollar. |
 Kenneth J. Gruneisen started out as a licensed stockbroker in August 1987, a couple of months prior to the historic stock market crash that took the Dow Jones Industrial Average down -22.6% in a single day. He has published daily fact-based fundamental and technical analysis on high-ranked stocks online for two decades. Through FACTBASEDINVESTING.COM, Kenneth provides educational articles, news, market commentary, and other information regarding proven investment systems that work in good times and bad.
Comments contained in the body of this report are technical opinions only and are not necessarily those of Gruneisen Growth Corp. The material herein has been obtained from sources believed to be reliable and accurate, however, its accuracy and completeness cannot be guaranteed. Our firm, employees, and customers may effect transactions, including transactions contrary to any recommendation herein, or have positions in the securities mentioned herein or options with respect thereto. Any recommendation contained in this report may not be suitable for all investors and it is not to be deemed an offer or solicitation on our part with respect to the purchase or sale of any securities. |
|
 |
Commodity, Tech, Retail, and Financial Groups Rose
Kenneth J. Gruneisen - Passed the CAN SLIM® Master's Exam
Commodity-linked groups had very positive tilt as the Gold & Silver Index ($XAU +3.79%) and Oil Services Index ($OSX +3.09%) outpaced the Integrated Oil Index ($XOI +1.53%). The Retail Index ($RLX +1.16%) and Bank Index ($BKX +0.97%) both outpaced the Broker/Dealer Index ($XBD +0.64%). The tech sector was led by the Semiconductor Index ($SOX +2.17%) and the Biotech Index ($BTK +1.83%) while the Networking Index ($NWX +0.97%) posted a smaller gain.
Charts courtesy of www.stockcharts.com
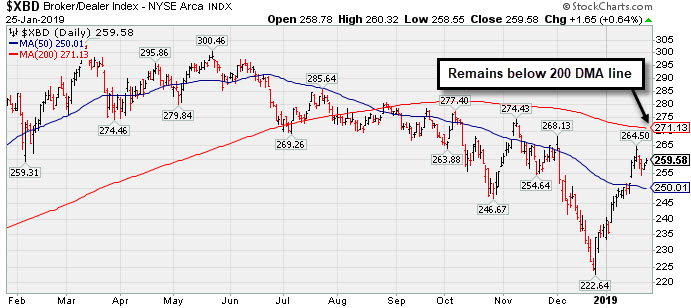 PICTURED: The Broker/Dealer Index ($XBD +0.64%) remains below its 200-day moving average (DMA) line.
| Oil Services |
$OSX |
97.86 |
+2.93 |
+3.09% |
+21.41% |
| Integrated Oil |
$XOI |
1,258.62 |
+19.05 |
+1.54% |
+8.59% |
| Semiconductor |
$SOX |
1,281.16 |
+27.25 |
+2.17% |
+10.91% |
| Networking |
$NWX |
530.34 |
+5.05 |
+0.96% |
+8.53% |
| Broker/Dealer |
$XBD |
259.55 |
+1.61 |
+0.63% |
+9.36% |
| Retail |
$RLX |
2,109.11 |
+24.13 |
+1.16% |
+8.08% |
| Gold & Silver |
$XAU |
71.17 |
+2.60 |
+3.79% |
+0.72% |
| Bank |
$BKX |
98.21 |
+0.95 |
+0.98% |
+14.48% |
| Biotech |
$BTK |
4,870.96 |
+87.30 |
+1.82% |
+15.40% |
|
|
|
 |
Hovering in a Tight Range Near All-Time High
Kenneth J. Gruneisen - Passed the CAN SLIM® Master's Exam
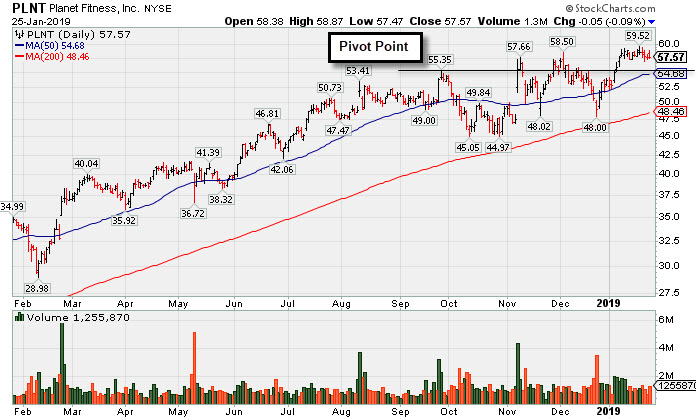
Planet Fitness Inc Cl A (PLNT -$0.05 or -0.09% to $57.57) has been quietly consolidating below its "max buy" level and holding its ground in a tight range near its all-time high. Its 50-day moving average DMA line ($54.69) defines important near-term support to watch above the recent low ($48).
PLNT was highlighted in yellow with pivot point cited based on its 9/26/18 high plus 10 cents in the 11/07/18 mid-day report (read here). It was last shown in this FSU section on 1/04/19 with an annotated graph under the headline, " Found Prompt Support Near 50-Day Moving Average Line".
Bullish action came after it reported earnings +47% on +40% sales revenues for the Sep '18 quarter, marking a 3rd consecutive quarterly earnings comparison above the +25% minimum guideline (C criteria). Recent comparisons showed impressive sales revenues acceleration. Annual earnings (A criteria) history included a small downturn in FY '15 but has been strong since. Completed its Aug 2015 IPO at $14.06 and completed Secondary Offerings on 6/22/16, 9/26/16, 3/10/17 and 5/08/17.
The number of top-rated funds owning its shares rose from 373 in Dec '17 to 524 in Dec '18, a reassuring sign concerning the I criteria. The current Up/Down Volume Ratio of 1.0 is an unbiased indication its shares have been neutral concerning accumulation/distribution over the past 50 days. It has earned a Timeliness Rating of A and Sponsorship Rating of B. Its small supply of 80.2 million shares in the public float can contribute to greater price volatility in the event of institutional buying or selling.
Charts courtesy of www.stockcharts.com
 |
|
|
Color Codes Explained :
Y - Better candidates highlighted by our
staff of experts.
G - Previously featured
in past reports as yellow but may no longer be buyable under the
guidelines.
***Last / Change / Volume data in this table is the closing quote data***
Symbol/Exchange
Company Name
Industry Group |
PRICE |
CHANGE
(%Change) |
Day High |
Volume
(% DAV)
(% 50 day avg vol) |
52 Wk Hi
% From Hi |
Featured
Date |
Price
Featured |
Pivot Featured |
|
Max Buy |
MLR
-
NYSE
Miller Industries Inc
AUTOMOTIVE - Auto Parts
|
$29.80
|
+0.48
1.64% |
$29.92
|
20,865
56.39% of 50 DAV
50 DAV is 37,000
|
$30.00
-0.67%
|
11/30/2018
|
$28.35
|
PP = $29.50
|
|
MB = $30.98
|
Most Recent Note - 1/23/2019 5:18:49 PM
Y - Held its ground today near its high. Posted a gain on 1/18/19 backed by +39% above average volume. Subsequent gains above the pivot point backed by at least +40% above average volume may help clinch a proper technical buy signal. Its 50 DMA line and recent low define near-term support to watch on pullbacks.
>>> FEATURED STOCK ARTICLE : Perched Within Close Striking Distance of Prior High - 1/8/2019 |
View all notes |
Set NEW NOTE alert |
Company Profile |
SEC
News |
Chart |
Request a new note
C
A
S
I |
LHCG
-
NASDAQ
L H C Group Inc
HEALTH SERVICES - Home Health Care
|
$107.62
|
-0.61
-0.56% |
$109.33
|
164,718
62.16% of 50 DAV
50 DAV is 265,000
|
$109.26
-1.50%
|
1/23/2019
|
$107.29
|
PP = $107.61
|
|
MB = $112.99
|
Most Recent Note - 1/23/2019 5:17:12 PM
Y - Posted a gain with near average volume today for a best-ever close. Highlighted in yellow with pivot point cited based on its 11/29/18 high plus 10 cents in the earlier mid-day report. Hit a new high today after an 8-week cup shaped base. Subsequent gains above the pivot point backed by at least +40% above average volume may trigger a technical buy signal. See the latest FSU analysis for more details and a new annotated graph. Found support above its 200 DMA line since noted in the 12/17/18 mid-day report - "The Sep '18 report marked its 3rd strong quarterly earnings increase above the +25% minimum guideline (C criteria), helping it better match with the fact-based investment system's fundamental guidelines."
>>> FEATURED STOCK ARTICLE : Healthcare Services Firm Reached a New High - 1/23/2019 |
View all notes |
Set NEW NOTE alert |
Company Profile |
SEC
News |
Chart |
Request a new note
C
A
S
I |
BSTC
-
NASDAQ
Biospecifics Technologie
Medical-Biomed/Biotech
|
$64.02
|
+0.04
0.06% |
$67.00
|
43,188
105.34% of 50 DAV
50 DAV is 41,000
|
$68.00
-5.85%
|
1/18/2019
|
$67.40
|
PP = $66.31
|
|
MB = $69.63
|
Most Recent Note - 1/24/2019 5:11:48 PM
Y - Posted a gain today with lighter volume, rebounding near its pivot point. Thinly traded Biomed/Biotech firm was covered in greater detail in the 1/18/19 FSU analysis with an annotated graph.
>>> FEATURED STOCK ARTICLE : Thinly Traded Biotech Shows Signs of Accumulation - 1/18/2019 |
View all notes |
Set NEW NOTE alert |
Company Profile |
SEC
News |
Chart |
Request a new note
C
A
S
I |
UBNT
-
NASDAQ
Ubiquiti Networks
TELECOMMUNICATIONS - Diversified Communication Serv
|
$107.30
|
+0.13
0.12% |
$108.72
|
277,983
67.64% of 50 DAV
50 DAV is 411,000
|
$115.44
-7.05%
|
11/9/2018
|
$108.20
|
PP = $101.43
|
|
MB = $106.50
|
Most Recent Note - 1/22/2019 6:09:58 PM
G - Faces some resistance due to overhead supply up to the $115 level. Quietly consolidating near its 50 DMA line ($104.75). Prior low ($92.08 on 12/24/18) defines the next important support. Fundamentals remain strong.
>>> FEATURED STOCK ARTICLE : Sputtering Below 50-Day Moving Average Again - 1/15/2019 |
View all notes |
Set NEW NOTE alert |
Company Profile |
SEC
News |
Chart |
Request a new note
C
A
S
I |
PYPL
-
NASDAQ
Paypal Holdings Inc
Finance-CrdtCard/PmtPr
|
$94.28
|
+2.08
2.26% |
$94.58
|
11,570,319
129.47% of 50 DAV
50 DAV is 8,937,000
|
$93.70
0.62%
|
1/24/2019
|
$92.56
|
PP = $93.80
|
|
MB = $98.49
|
 Most Recent Note - 1/25/2019 5:08:03 PM
Y - Posted a 3rd consecutive gain today and hit a new all-time high, however volume was only +30% above average. Highlighted in yellow with new pivot point cited based on its 9/13/18 high plus 10 cents. Subsequent gains above the pivot point backed by at least +40% above average volume are needed to trigger a proper technical buy signal. Fundamentals remain strong. Due to report earnings news on 1/30/19. See the latest FSU analysis for more details and an annotated graph.
>>> FEATURED STOCK ARTICLE : Perched Within Striking Distance of High Ahead of Earnings News - 1/24/2019 |
View all notes |
Set NEW NOTE alert |
Company Profile |
SEC
News |
Chart |
Request a new note
C
A
S
I |
Symbol/Exchange
Company Name
Industry Group |
PRICE |
CHANGE
(%Change) |
Day High |
Volume
(% DAV)
(% 50 day avg vol) |
52 Wk Hi
% From Hi |
Featured
Date |
Price
Featured |
Pivot Featured |
|
Max Buy |
ALRM
-
NASDAQ
Alarm.com Holdings Inc
Security/Sfty
|
$62.64
|
+1.59
2.60% |
$63.72
|
637,547
128.80% of 50 DAV
50 DAV is 495,000
|
$61.64
1.63%
|
1/22/2019
|
$60.52
|
PP = $60.30
|
|
MB = $63.32
|
Most Recent Note - 1/25/2019 5:06:15 PM
Y - Gapped up and posted a gain today for a new high with +29% above average volume, adding to an impressive spurt of gains. Prior highs define initial support to watch on pullbacks.
>>> FEATURED STOCK ARTICLE : Pullback Broke Steak of Gains and Reversed From New High - 1/22/2019 |
View all notes |
Set NEW NOTE alert |
Company Profile |
SEC
News |
Chart |
Request a new note
C
A
S
I |
PLNT
-
NYSE
Planet Fitness Inc Cl A
Leisure-Services
|
$57.57
|
-0.05
-0.09% |
$58.87
|
1,251,192
100.66% of 50 DAV
50 DAV is 1,243,000
|
$59.52
-3.28%
|
11/7/2018
|
$57.10
|
PP = $55.45
|
|
MB = $58.22
|
Most Recent Note - 1/25/2019 5:09:15 PM
Y - Consolidating below its "max buy" level and holding its ground in a tight range near its all-time high. Its 50 DMA line ($54.69) defines important near-term support to watch above the recent low ($48). See the latest FSU analysis for more details and a new annotated graph.
>>> FEATURED STOCK ARTICLE : Hovering in a Tight Range Near All-Time High - 1/25/2019 |
View all notes |
Set NEW NOTE alert |
Company Profile |
SEC
News |
Chart |
Request a new note
C
A
S
I |
TEAM
-
NASDAQ
Atlassian Corp Plc Cl A
Comp Sftwr-Spec Enterprs
|
$95.86
|
+2.54
2.72% |
$95.99
|
1,152,080
68.05% of 50 DAV
50 DAV is 1,693,000
|
$100.00
-4.14%
|
1/7/2019
|
$94.68
|
PP = $98.31
|
|
MB = $103.23
|
Most Recent Note - 1/25/2019 5:03:34 PM
Y - Posted a gain for a new high close with light volume. Reported earnings +92% on +39% sales revenues for the Dec '18 quarter. Subsequent gains and a strong close above the pivot point backed by at least +40% above average volume may help to clinch a convincing technical buy signal. Its 50 DMA line ($84.41) and prior low define near-term support to watch on pullbacks.
>>> FEATURED STOCK ARTICLE : Rebounding Near Prior High Which May Act as Resistance - 1/7/2019 |
View all notes |
Set NEW NOTE alert |
Company Profile |
SEC
News |
Chart |
Request a new note
C
A
S
I |
INVA
-
NASDAQ
Innoviva Inc
Medical-Biomed/Biotech
|
$19.83
|
+0.18
0.92% |
$19.93
|
608,849
57.33% of 50 DAV
50 DAV is 1,062,000
|
$19.96
-0.65%
|
11/23/2018
|
$17.74
|
PP = $18.09
|
|
MB = $18.99
|
Most Recent Note - 1/22/2019 6:06:05 PM
G - Touched a new high but reversed into the red for a loss with higher volume. The prior high ($18.60 on 12/03/18) defines initial support above its 50 DMA line ($17.50). See the latest FSU analysis for more details and an annotated graph.
>>> FEATURED STOCK ARTICLE : Perched at High Following Volume-Driven Gains - 1/17/2019 |
View all notes |
Set NEW NOTE alert |
Company Profile |
SEC
News |
Chart |
Request a new note
C
A
S
I |
|
|
|
THESE ARE NOT BUY RECOMMENDATIONS!
Comments contained in the body of this report are technical
opinions only. The material herein has been obtained
from sources believed to be reliable and accurate, however,
its accuracy and completeness cannot be guaranteed.
This site is not an investment advisor, hence it does
not endorse or recommend any securities or other investments.
Any recommendation contained in this report may not
be suitable for all investors and it is not to be deemed
an offer or solicitation on our part with respect to
the purchase or sale of any securities. All trademarks,
service marks and trade names appearing in this report
are the property of their respective owners, and are
likewise used for identification purposes only.
This report is a service available
only to active Paid Premium Members.
You may opt-out of receiving report notifications
at any time. Questions or comments may be submitted
by writing to Premium Membership Services 665 S.E. 10 Street, Suite 201 Deerfield Beach, FL 33441-5634 or by calling 1-800-965-8307
or 954-785-1121.
|
|
|

