You are not logged in.
This means you
CAN ONLY VIEW reports that were published prior to Monday, April 14, 2025.
You
MUST UPGRADE YOUR MEMBERSHIP if you want to see any current reports.
AFTER MARKET UPDATE - FRIDAY, JANUARY 25TH, 2013
Previous After Market Report Next After Market Report >>>
|
|
|
|
DOW |
+70.65 |
13,895.98 |
+0.51% |
|
Volume |
692,416,940 |
+2% |
|
Volume |
1,788,556,740 |
-10% |
|
NASDAQ |
+19.33 |
3,149.71 |
+0.62% |
|
Advancers |
1,822 |
58% |
|
Advancers |
1,365 |
53% |
|
S&P 500 |
+8.14 |
1,502.96 |
+0.54% |
|
Decliners |
1,164 |
37% |
|
Decliners |
1,080 |
42% |
|
Russell 2000 |
+5.05 |
905.24 |
+0.56% |
|
52 Wk Highs |
353 |
|
|
52 Wk Highs |
207 |
|
|
S&P 600 |
+2.57 |
508.47 |
+0.51% |
|
52 Wk Lows |
12 |
|
|
52 Wk Lows |
11 |
|
|
 |
Major Averages Post 4th Consecutive Weekly Gains
Kenneth J. Gruneisen - Passed the CAN SLIM® Master's Exam
The major averages posted their 4th consecutive weekly gains as the Dow Jones Industrial Average rose +1.8% and the S&P 500 Index gained +1.1%, and the Nasdaq Composite Index rallied +0.5% on the week. The Dow remains on pace for its best January since 1997. Friday's volume totals were reported mixed, higher on thje NYSE yet lower on the Nasdaq exchange. Breadth was positive as advancers led decliners by a 3-2 margin on the NYSE, and advancing issues maintained a lead by a 7-5 margin on the Nasdaq exchange. The total number of stocks hitting new 52-week highs easily outnumbered new 52-week lows on the NYSE and on the Nasdaq exchange. There were 116 high-ranked companies from the CANSLIM.net Leaders List making new 52-week highs and appearing on the CANSLIM.net BreakOuts Page, down from the prior session total of 136 stocks. There were gains for 8 of the 11 high-ranked companies currently included on the Featured Stocks Page.
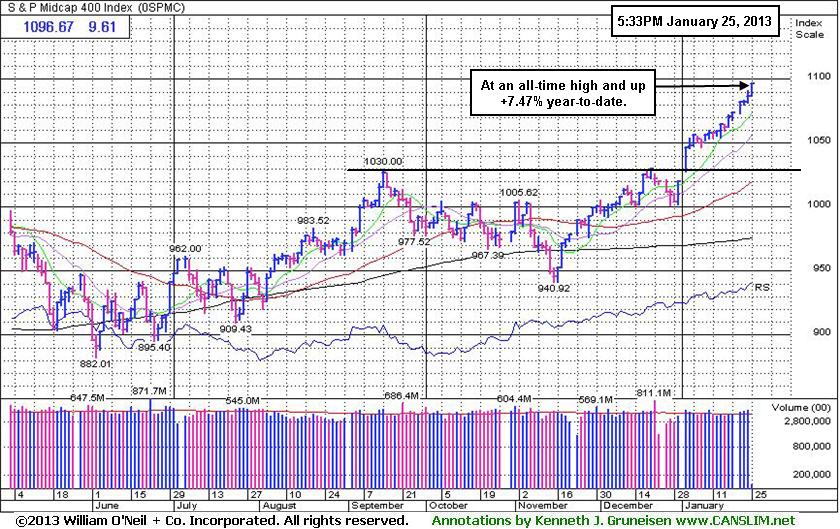
Stocks finished the shortened trading week on a positive note. The benchmark S&P 500 Index and Dow Industrials both extended their gains. The S&P 500 Index capped off its longest winning streak since 2004 with a gain of 8 points to 1,502 leaving it -4.6% off its Oct 2007 all-time high of 1,576. The Nasdaq Composite Index erased Thursday's losses, yet it still remains -1.5% off its 9/25/12 high, meanwhile its larger cap peers have been making steady progress above last year's highs in a race toward their respective 2007 highs.
On the economic front, new home sales fell -7.3% in December, but finished 2012 with the first annual gain in seven years. A solid start to fourth-quarter earnings season continued to lift the market. All sectors finished higher, paced by gains in consumer discretionary. Netflix Inc (NFLX +15.46%) led the group's advance as it rose $22.75 to $169.60, amounting to a two-day gain of over +60%. Consumer staples helped lift the market as Procter & Gamble (PG +4.02%) increased its 2013 earnings outlook and reported a better-than-expected profit tally. Microsoft Corp (MSFT +0.90%) rose after narrowly beating earnings estimates, but fell short on revenue. AT&T Inc (T +0.80%) edged higher on its report. Starbucks Corp (SBUX +4.10%) gapped up after topping earnings estimates thanks to strong same-store-sales growth. Energy paced the advance with Halliburton Co (HAL +5.05%) up after posting higher than anticipated earnings thanks to international growth. Hasbro Inc (HAS -2.97%) fell after it missed on revenue and said it woud cut 10% of its workforce.
Friday marked the S&P 500 Index's highest close since December 10, 2007. The latest rally has produced a few action worthy candidates meeting all of the fact-based investment system's criteria. Selectivity and discipline are required, as always. Investors may consider new buying efforts in stocks meeting all key criteria, as the market's (M criteria) confirmed uptrend has been comprised by great leadership (stocks hitting new 52-week highs) in the broader market. Widespread gains helped all of the major averages blast higher, and the benchmark S&P 500 Index is perched at its best level in more than five years.
Watch for an announcement via email concerning the next WEBCAST. The webcast will also be available via an updated link highlighted at the top of the Premium Member Homepage.
PICTURED: The S&P Mid-Cap 400 Index has been rallying for new all-time highs in recent weeks without looking back, and it is up +7.47% year-to-date.
|
 Kenneth J. Gruneisen started out as a licensed stockbroker in August 1987, a couple of months prior to the historic stock market crash that took the Dow Jones Industrial Average down -22.6% in a single day. He has published daily fact-based fundamental and technical analysis on high-ranked stocks online for two decades. Through FACTBASEDINVESTING.COM, Kenneth provides educational articles, news, market commentary, and other information regarding proven investment systems that work in good times and bad.
Comments contained in the body of this report are technical opinions only and are not necessarily those of Gruneisen Growth Corp. The material herein has been obtained from sources believed to be reliable and accurate, however, its accuracy and completeness cannot be guaranteed. Our firm, employees, and customers may effect transactions, including transactions contrary to any recommendation herein, or have positions in the securities mentioned herein or options with respect thereto. Any recommendation contained in this report may not be suitable for all investors and it is not to be deemed an offer or solicitation on our part with respect to the purchase or sale of any securities. |
|
 |
Retail and Tech Index Led Gains; Gold & Silver Group Dives Near 2012 Lows
Kenneth J. Gruneisen - Passed the CAN SLIM® Master's Exam
The Retail Index ($RLX +1.80%) was a positive influence on the major averages on Friday, and the Bank Index ($BKX +0.32%) and Broker/Dealer Index ($XBD +0.90%) also underpinned the market's broad-based advance. The Internet Index ($IIX +2.05%) led the tech sector while the Biotechnology Index ($BTK +1.22%), Semiconductor Index ($SOX +1.27%), and the Networking Index ($NWX +1.36%) posted unanimous gains. The Healthcare Index ($HMO +0.48%) had a positive bias and gains in the energy-group lifted the Integrated Oil Index ($XOI +0.78%) and the Oil Services Index ($OSX +1.42%).
Charts courtesy www.stockcharts.com
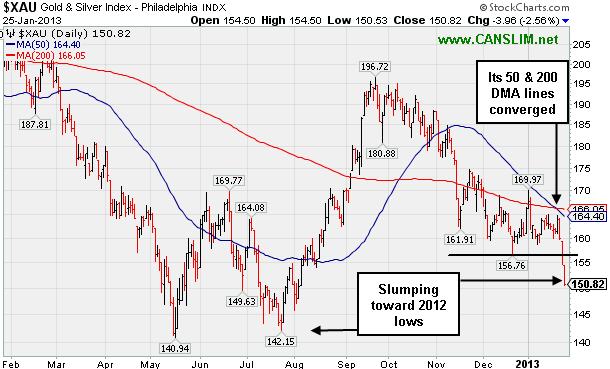
PICTURED: The Gold & Silver Index ($XAU -2.56%) suffered its 3rd consecutive large loss, continuing to lag behind growth-oriented groups and leaving it down -9% year-to-date. Clearly funds have been rotating from the "safe haven" area to pursue growth in industry groups which historically tend to generate greater gains in a growing economy.
| Oil Services |
$OSX |
245.00 |
+3.42 |
+1.42% |
+11.28% |
| Healthcare |
$HMO |
2,698.31 |
+12.90 |
+0.48% |
+7.32% |
| Integrated Oil |
$XOI |
1,330.22 |
+10.34 |
+0.78% |
+7.12% |
| Semiconductor |
$SOX |
415.44 |
+5.20 |
+1.27% |
+8.17% |
| Networking |
$NWX |
247.76 |
+3.31 |
+1.36% |
+9.36% |
| Internet |
$IIX |
360.19 |
+7.25 |
+2.05% |
+10.15% |
| Broker/Dealer |
$XBD |
102.15 |
+0.91 |
+0.90% |
+8.29% |
| Retail |
$RLX |
712.47 |
+12.59 |
+1.80% |
+9.10% |
| Gold & Silver |
$XAU |
150.82 |
-3.96 |
-2.56% |
-8.93% |
| Bank |
$BKX |
54.12 |
+0.17 |
+0.32% |
+5.54% |
| Biotech |
$BTK |
1,680.12 |
+20.22 |
+1.22% |
+8.60% |
|
|
|
 |
Featured in Mid-day Report and Finished With Negative Reversal Below Pivot Point
Kenneth J. Gruneisen - Passed the CAN SLIM® Master's Exam
Often, when a leading stock is setting up to breakout of a solid base it is highlighted in CANSLIM.net's Mid-Day Breakouts Report. The most relevant factors are noted in the report which alerts prudent CANSLIM oriented investors to place the issue in their watch list. After doing any necessary backup research, the investor is prepared to act after the stock triggers a technical buy signal (breaks above its pivot point on more than +50% average turnover) but before it gets too extended from a sound base. In the event the stock fails to trigger a technical buy signal and its price declines then it will simply be removed from the watch list. Disciplined investors know to buy as near as possible to the pivot point and avoid chasing stocks after they have rallied more than +5% above their pivot point. It is crucial to always limit losses whenever any stock heads the wrong direction, and disciplined investors sell if a struggling stock ever falls more than -7% from their purchase price.
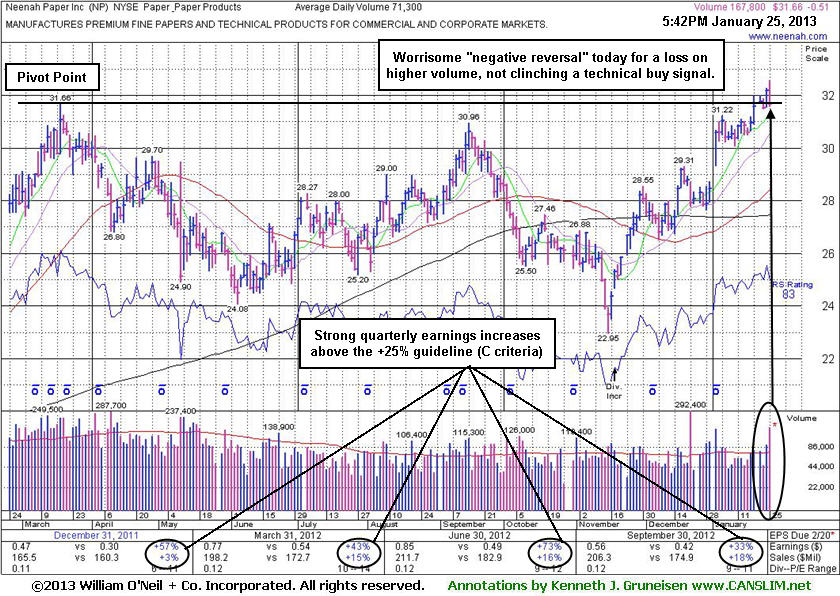
Neenah Paper Inc (NP -$0.51 or -1.59% to $31.66) finished near the session low with a loss on heavy volume after a worrisome "negative reversal" from early gains hitting a new 52-week high. The negative reversal was noted as is a worrisome sign of distributional pressure. It was highlighted in yellow with pivot point cited based on its 3/19/12 high plus 10 cents in the mid-day report (read here) while noted - "A strong close above its pivot point backed by at least +40% above average volume may clinch a technical buy signal. Recent gains lacked great volume conviction while wedging above previously stubborn resistance in the $31 area."
A negative reversal indicates that it encountered a rush of willing sellers when it was a good position to close the session above its pivot point. Disciplined investors might be watching for subsequent gains with great volume conviction while rising above its pivot point and into new high territory as proof of lurking institutional buying demand which might lead to a more meaningful and sustained advance.
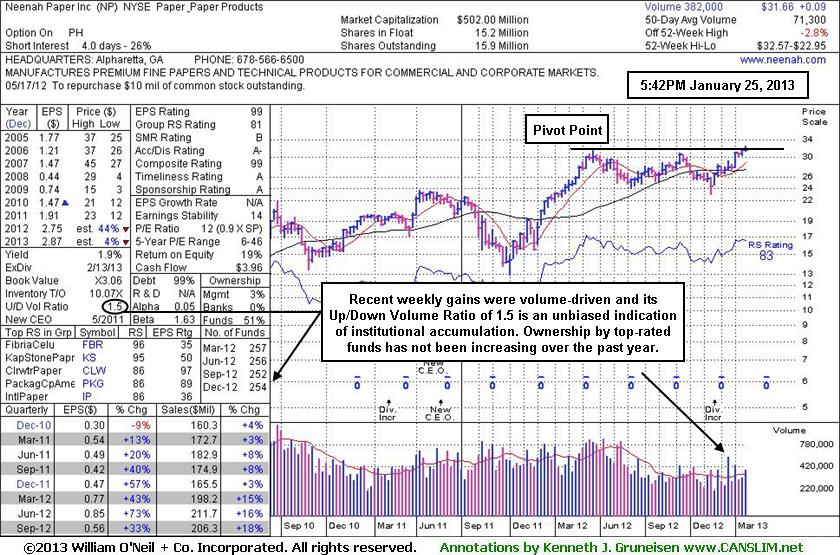
The weekly graph (below) shows bullish price/volume action with recent weekly gains backed by higher volume. Its Up/Down Volume Ratio of 1.5 is an unbiased indication that its shares have been under accumulation over the past 50 days. However, the number of top-rated funds reportedly owning its shares has not shown any improvement in the past year. Quarterly earnings increases above the +25% guideline satisfy the C criteria and the sequential comparisons show encouraging accelerating sales revenues growth. Annual earnings (A criteria) have been improving steadily after a worrisome downturn in FY '08. Its small supply of 15.9 million shares (S criteria) could contribute to greater price volatility in the event of any institutional buying or selling.
|
|
|
Color Codes Explained :
Y - Better candidates highlighted by our
staff of experts.
G - Previously featured
in past reports as yellow but may no longer be buyable under the
guidelines.
***Last / Change / Volume data in this table is the closing quote data***
Symbol/Exchange
Company Name
Industry Group |
PRICE |
CHANGE
(%Change) |
Day High |
Volume
(% DAV)
(% 50 day avg vol) |
52 Wk Hi
% From Hi |
Featured
Date |
Price
Featured |
Pivot Featured |
|
Max Buy |
CELG
-
NASDAQ
Celgene Corp
DRUGS - Drug Manufacturers - Major
|
$99.76
|
+2.27
2.33% |
$99.90
|
5,181,772
139.13% of 50 DAV
50 DAV is 3,724,400
|
$100.12
-0.36%
|
12/11/2012
|
$82.24
|
PP = $81.34
|
|
MB = $85.41
|
Most Recent Note - 1/24/2013 2:59:35 PM
G - Hovering in a tight range near its all-time high, very extended from its prior base. See the recent Featured Stock Update (FSU) analysis for the latest annotated graph and more details under the headline, "Rule Suggests Letting Explosive Winners Have Time For Greater Gains - Thursday, January 17, 2013 ".
>>> The latest Featured Stock Update with an annotated graph appeared on 1/17/2013. Click here.
View all notes |
Alert me of new notes |
CANSLIM.net Company Profile |
SEC |
Zacks Reports |
StockTalk |
News |
Chart |
Request a new note
C
A N
S L
I M


|
CFNL
-
NASDAQ
Cardinal Financial Corp
BANKING - Regional - Southeast Banks
|
$16.01
|
-0.29
-1.78% |
$16.34
|
198,757
88.45% of 50 DAV
50 DAV is 224,700
|
$16.90
-5.27%
|
12/3/2012
|
$15.20
|
PP = $16.31
|
|
MB = $17.13
|
Most Recent Note - 1/24/2013 3:04:06 PM
Y - Found support at its 50 DMA line recently. That important short-term average acted as support throughout its ongoing ascent. Subsequent losses leading to a damaging violation and a slump below the recent low ($15.74 on 1/18/13) would raise concerns and trigger technical sell signals.
>>> The latest Featured Stock Update with an annotated graph appeared on 1/15/2013. Click here.
View all notes |
Alert me of new notes |
CANSLIM.net Company Profile |
SEC |
Zacks Reports |
StockTalk |
News |
Chart |
Request a new note
C
A N
S L
I M
|
CMCSA
-
NASDAQ
Comcast Corp Cl A
MEDIA - CATV Systems
|
$39.76
|
+0.18
0.45% |
$39.92
|
10,395,425
93.35% of 50 DAV
50 DAV is 11,135,900
|
$40.28
-1.29%
|
12/3/2012
|
$37.08
|
PP = $38.06
|
|
MB = $39.96
|
Most Recent Note - 1/24/2013 3:05:36 PM
Y - Color code is changed to yellow while quietly consolidating just under its "max buy" level. Perched near its 52-week high with no resistance remaining due to overhead supply. Prior highs in the $38 area define initial support to watch on pullbacks.
>>> The latest Featured Stock Update with an annotated graph appeared on 1/11/2013. Click here.
View all notes |
Alert me of new notes |
CANSLIM.net Company Profile |
SEC |
Zacks Reports |
StockTalk |
News |
Chart |
Request a new note
C
A N
S L
I M
|
KORS
-
NYSE
Michael Kors Hldgs Ltd
RETAIL - Apparel Stores
|
$58.08
|
+1.35
2.38% |
$58.15
|
6,267,271
171.83% of 50 DAV
50 DAV is 3,647,300
|
$58.62
-0.92%
|
1/23/2013
|
$54.98
|
PP = $58.72
|
|
MB = $61.66
|
 Most Recent Note - 1/25/2013 4:14:27 PM
Y - Today's 5th consecutive gain with ever-increasing volume approached its 52-week high and pivot point. Disciplined investors may watch for volume-driven gains above the pivot point to trigger a proper technical buy signal before taking action. See the latest FSU analysis under the headline, "High-Ranked Luxury Apparel Firm Worthy For Watchlist - Wednesday, January 23, 2013", for more details and an annotated weekly graph.
>>> The latest Featured Stock Update with an annotated graph appeared on 1/23/2013. Click here.
View all notes |
Alert me of new notes |
CANSLIM.net Company Profile |
SEC |
Zacks Reports |
StockTalk |
News |
Chart |
Request a new note
C
A N
S L
I M
|
MIDD
-
NASDAQ
Middleby Corp
MANUFACTURING - Diversified Machinery
|
$142.00
|
+1.58
1.13% |
$143.18
|
92,505
108.57% of 50 DAV
50 DAV is 85,200
|
$141.16
0.60%
|
10/8/2012
|
$118.46
|
PP = $122.67
|
|
MB = $128.80
|
Most Recent Note - 1/25/2013 4:16:32 PM
G - Rallied for a 6th consecutive gain today and further into new all-time high territory. Prior mid-day reports noted - "Disciplined investors may watch closely for sell signals if holding it and giving it a chance to produce more climactic gains. Its 50-day moving average (DMA) line defines near-term chart support to watch where any violation would trigger a technical sell signal." Earnings +23% on +18% sales for the Sep '12 quarter, below the +25% minimum earnings guideline (C criteria), raised concerns.
>>> The latest Featured Stock Update with an annotated graph appeared on 1/14/2013. Click here.
View all notes |
Alert me of new notes |
CANSLIM.net Company Profile |
SEC |
Zacks Reports |
StockTalk |
News |
Chart |
Request a new note
C
A N
S L
I M
|
Symbol/Exchange
Company Name
Industry Group |
PRICE |
CHANGE
(%Change) |
Day High |
Volume
(% DAV)
(% 50 day avg vol) |
52 Wk Hi
% From Hi |
Featured
Date |
Price
Featured |
Pivot Featured |
|
Max Buy |
N
-
NYSE
Netsuite Inc
DIVERSIFIED SERVICES - Business/Management Services
|
$70.56
|
+1.81
2.63% |
$70.70
|
431,310
123.94% of 50 DAV
50 DAV is 348,000
|
$70.80
-0.34%
|
12/12/2012
|
$64.75
|
PP = $67.12
|
|
MB = $70.48
|
Most Recent Note - 1/25/2013 4:18:10 PM
G - Gain today lifted it above its "max buy" level and its color code is changed to green. Recent gains above its pivot point were marked by sub par volume, still leaving questions concerning the level of institutional buying demand lurking.
>>> The latest Featured Stock Update with an annotated graph appeared on 1/18/2013. Click here.
View all notes |
Alert me of new notes |
CANSLIM.net Company Profile |
SEC |
Zacks Reports |
StockTalk |
News |
Chart |
Request a new note
C
A N
S L
I M
|
NP
-
NYSE
Neenah Paper Inc
CONSUMER NON-DURABLES - Paper and Paper Products
|
$31.66
|
-0.51
-1.59% |
$32.57
|
167,883
235.46% of 50 DAV
50 DAV is 71,300
|
$32.27
-1.89%
|
1/25/2013
|
$31.80
|
PP = $31.76
|
|
MB = $33.35
|
Most Recent Note - 1/25/2013 6:49:34 PM
Y - Its "negative reversal" for a loss on heavy volume after hitting a new 52-week high today was noted as is a worrisome sign of distributional pressure. It was highlighted in yellow with pivot point cited based on its 3/19/12 high plus 10 cents in the mid-day report while noted - "A strong close above its pivot point backed by at least +40% above average volume may clinch a technical buy signal. Recent gains lacked great volume conviction while wedging above previously stubborn resistance in the $31 area. Quarterly earnings increases above the +25% guideline satisfy the C criteria. Annual earnings (A criteria) have been improving steadily after a worrisome downturn in FY '08. Its small supply of 15.9 million shares could contribute to greater price volatility." See the latest FSU analysis for more details and annotated daily and weekly graphs.
>>> The latest Featured Stock Update with an annotated graph appeared on 1/25/2013. Click here.
View all notes |
Alert me of new notes |
CANSLIM.net Company Profile |
SEC |
Zacks Reports |
StockTalk |
News |
Chart |
Request a new note
C
A N
S L
I M
|
NSR
-
NYSE
Neustar Inc
TELECOMMUNICATIONS - Diversified Communication Serv
|
$44.26
|
+0.27
0.61% |
$44.53
|
350,182
85.89% of 50 DAV
50 DAV is 407,700
|
$45.49
-2.70%
|
12/11/2012
|
$41.85
|
PP = $41.41
|
|
MB = $43.48
|
Most Recent Note - 1/24/2013 2:55:30 PM
G - Volume totals have been cooling while consolidating well above its 50 DMA line defining chart support to watch. After hitting a new 52-week high on 1/17/13 there was a worrisome "negative reversal".
>>> The latest Featured Stock Update with an annotated graph appeared on 1/16/2013. Click here.
View all notes |
Alert me of new notes |
CANSLIM.net Company Profile |
SEC |
Zacks Reports |
StockTalk |
News |
Chart |
Request a new note
C
A N
S L
I M
|
RAX
-
NYSE
Rackspace Hosting Inc
INTERNET - Internet Software and; Services
|
$78.93
|
-0.31
-0.39% |
$79.66
|
1,004,959
87.24% of 50 DAV
50 DAV is 1,151,900
|
$81.36
-2.99%
|
12/18/2012
|
$71.88
|
PP = $70.10
|
|
MB = $73.61
|
Most Recent Note - 1/24/2013 1:57:26 PM
G - Powering to a new all-time high today with above average volume behind a considerable gain. It is extended from the previously noted base. Company will announce its fourth quarter 2012 financial results on Tuesday, February 12, 2013 after the close. See the latest FSU analysis for more details and a new annotated graph.
>>> The latest Featured Stock Update with an annotated graph appeared on 1/22/2013. Click here.
View all notes |
Alert me of new notes |
CANSLIM.net Company Profile |
SEC |
Zacks Reports |
StockTalk |
News |
Chart |
Request a new note
C
A N
S L
I M
|
RNF
-
NYSE
Rentech Nitrogen Ptnr Lp
CHEMICALS - Agricultural Chemicals
|
$45.37
|
+0.38
0.84% |
$46.25
|
274,937
85.84% of 50 DAV
50 DAV is 320,300
|
$48.19
-5.85%
|
11/1/2012
|
$39.11
|
PP = $40.15
|
|
MB = $42.16
|
Most Recent Note - 1/24/2013 6:43:36 PM
G - Encountering more distributional pressure today with higher volume behind its loss. Prior highs in the $40 area define near-term support to watch. See the latest FSU analysis for more details and a new annotated graph.
>>> The latest Featured Stock Update with an annotated graph appeared on 1/24/2013. Click here.
View all notes |
Alert me of new notes |
CANSLIM.net Company Profile |
SEC |
Zacks Reports |
StockTalk |
News |
Chart |
Request a new note
C
A N
S L
I M
|
Symbol/Exchange
Company Name
Industry Group |
PRICE |
CHANGE
(%Change) |
Day High |
Volume
(% DAV)
(% 50 day avg vol) |
52 Wk Hi
% From Hi |
Featured
Date |
Price
Featured |
Pivot Featured |
|
Max Buy |
VRX
-
NYSE
Valeant Pharmaceuticals
DRUGS - Drug Manufacturers - Other
|
$65.64
|
+1.09
1.69% |
$65.69
|
1,290,069
85.06% of 50 DAV
50 DAV is 1,516,700
|
$64.90
1.14%
|
12/20/2012
|
$60.24
|
PP = $61.21
|
|
MB = $64.27
|
Most Recent Note - 1/24/2013 5:58:48 PM
G - It is extended from a sound base and posted another small gain today, rallying further above its "max buy" level without great volume conviction.
>>> The latest Featured Stock Update with an annotated graph appeared on 1/10/2013. Click here.
View all notes |
Alert me of new notes |
CANSLIM.net Company Profile |
SEC |
Zacks Reports |
StockTalk |
News |
Chart |
Request a new note
C
A N
S L
I M
|
|
|
|
THESE ARE NOT BUY RECOMMENDATIONS!
Comments contained in the body of this report are technical
opinions only. The material herein has been obtained
from sources believed to be reliable and accurate, however,
its accuracy and completeness cannot be guaranteed.
This site is not an investment advisor, hence it does
not endorse or recommend any securities or other investments.
Any recommendation contained in this report may not
be suitable for all investors and it is not to be deemed
an offer or solicitation on our part with respect to
the purchase or sale of any securities. All trademarks,
service marks and trade names appearing in this report
are the property of their respective owners, and are
likewise used for identification purposes only.
This report is a service available
only to active Paid Premium Members.
You may opt-out of receiving report notifications
at any time. Questions or comments may be submitted
by writing to Premium Membership Services 665 S.E. 10 Street, Suite 201 Deerfield Beach, FL 33441-5634 or by calling 1-800-965-8307
or 954-785-1121.
|
|
|

