You are not logged in.
This means you
CAN ONLY VIEW reports that were published prior to Monday, February 26, 2024.
You
MUST UPGRADE YOUR MEMBERSHIP if you want to see any current reports.
AFTER MARKET UPDATE - FRIDAY, JANUARY 24TH, 2020
Previous After Market Report Next After Market Report >>>
|
|
|
|
DOW |
-170.36 |
28,989.73 |
-0.58% |
|
Volume |
870,970,230 |
-8% |
|
Volume |
2,613,961,890 |
+7% |
|
NASDAQ |
-87.57 |
9,314.91 |
-0.93% |
|
Advancers |
861 |
30% |
|
Advancers |
838 |
26% |
|
S&P 500 |
-30.07 |
3,295.47 |
-0.90% |
|
Decliners |
2,003 |
70% |
|
Decliners |
2,330 |
74% |
|
Russell 2000 |
-22.78 |
1,662.23 |
-1.35% |
|
52 Wk Highs |
238 |
|
|
52 Wk Highs |
196 |
|
|
S&P 600 |
-15.49 |
1,015.98 |
-1.50% |
|
52 Wk Lows |
63 |
|
|
52 Wk Lows |
60 |
|
|
 |
Major Indices Reversed Gains to Close Session Lower
Kenneth J. Gruneisen - Passed the CAN SLIM® Master's Exam
The Dow slumped 170 points, erasing an early session gain of more than 100 points. The blue chip index posted its worst week since mid-August, losing 1.2%. The S&P 500 and Nasdaq Composite each fell 0.9% on Friday, with both benchmarks capping their biggest weekly declines since the fall. For the week, the S&P 500 dropped 1%, while the Nasdaq Composite slipped 0.8%. Breadth was negative as decliners led advancers by more than a 2-1 margin on the NYSE and nearly a 3-1 margin on the Nasdaq exchange. The reported volume totals were mixed, lighter than the prior session total on the NYSE and higher on the Nasdaq exchange. There were 89 high-ranked companies from the Leaders List that hit a new 52-week high and were listed on the BreakOuts Page, versus the total of 59 on the prior session. New 52-week highs totals expanded and easily outnumbered new 52-week lows totals on the NYSE and on the Nasdaq exchange. The major indices (M criteria) are in a "confirmed uptrend" after enduring distributional pressure in recent weeks. The Featured Stocks Page provides the most timely analysis on high-ranked leaders. Charts used courtesy of www.stockcharts.com
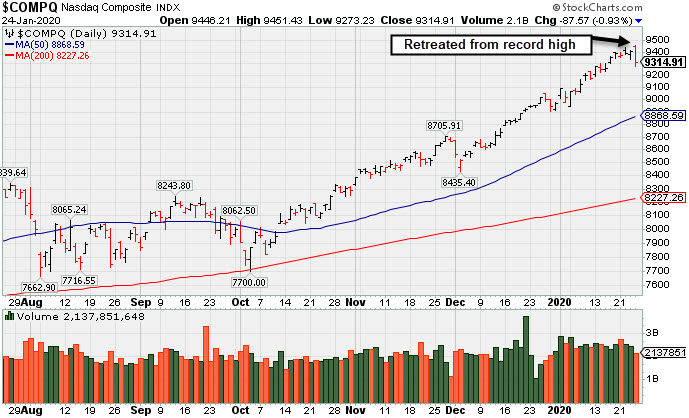
PICTURED: The Nasdaq Composite Index reversed an early gain on Friday as it retreated from its record high
Stocks finished lower on Friday. Risk sentiment was pressured on reports that the Wuhan coronavirus spread from China to the U.S. and Europe.
Elsewhere, investors digested a slew of corporate earnings results. Intel (INTC +8.13%) gapped up after exceeding Wall Street profit and revenue estimates and offering positive current-quarter guidance. Broadcom (AVGO +1.36%) rose after signing a supply deal with Apple (AAPl -0.29%) worth roughly $15 billion. Rival Skyworks Solutions (SWKS -4.59%) was hurt by the news, despite topping analyst earnings and sales forecasts. Meanwhile, American Express (AXP +2.85%) following its top and bottom line beat.
In other corporate news, Disney (DIS -1.49%) fell following an announcement that its Shanghai resort would close indefinitely as Chinese authorities attempt to contain the virus outbreak. Elsewhere, Boeing (BA +1.66%) rose on reports that its beleaguered 737-MAX aircraft could gain FAA approval to return to service before mid-year.
Treasuries strengthened, with the yield on the 10-year note down five basis points to 1.68%. On the data front, most key global manufacturing readings showed improvement this month. A domestic release from research firm IHS Markit revealed manufacturing PMI remained in expansionary territory in January. In commodities, WTI crude slid 1.2% to $54.90/barrel, while COMEX gold added 0.3% to $1,570.80/ounce. |
 Kenneth J. Gruneisen started out as a licensed stockbroker in August 1987, a couple of months prior to the historic stock market crash that took the Dow Jones Industrial Average down -22.6% in a single day. He has published daily fact-based fundamental and technical analysis on high-ranked stocks online for two decades. Through FACTBASEDINVESTING.COM, Kenneth provides educational articles, news, market commentary, and other information regarding proven investment systems that work in good times and bad.
Comments contained in the body of this report are technical opinions only and are not necessarily those of Gruneisen Growth Corp. The material herein has been obtained from sources believed to be reliable and accurate, however, its accuracy and completeness cannot be guaranteed. Our firm, employees, and customers may effect transactions, including transactions contrary to any recommendation herein, or have positions in the securities mentioned herein or options with respect thereto. Any recommendation contained in this report may not be suitable for all investors and it is not to be deemed an offer or solicitation on our part with respect to the purchase or sale of any securities. |
|
 |
Gold & Silver Index Posted a Standout Gain
Kenneth J. Gruneisen - Passed the CAN SLIM® Master's Exam
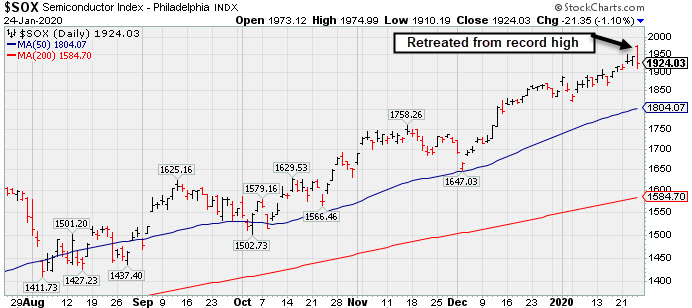
The Broker/Dealer Index ($XBD -1.62%) and the Bank Index ($BKX -1.91%) both outpaced the Retail Index ($RLX -1.24%) to the downside. The Semiconductor Index ($SOX -1.10%) and the Biotech Index ($BTK -2.11%) fell, meanwhile, the Networking Index ($NWX +0.48%) notched a small gain.. Energy-linked groups had a negative bias as the Oil Services Index ($OSX -2.97%) and the Integrated Oil Index ($XOI -1.34%) both finished to the downside, meanwhile, the Gold & Silver Index ($XAU +1.84%) was a standout gainer.
PICTURED: The Semiconductor Index ($SOX -1.10%) reversed from a record high and finished the session lower.
| Oil Services |
$OSX |
68.40 |
-2.09 |
-2.96% |
-12.63% |
| Integrated Oil |
$XOI |
1,197.18 |
-16.30 |
-1.34% |
-5.77% |
| Semiconductor |
$SOX |
1,924.03 |
-21.34 |
-1.10% |
+4.02% |
| Networking |
$NWX |
596.36 |
+2.85 |
+0.48% |
+2.22% |
| Broker/Dealer |
$XBD |
294.34 |
-4.85 |
-1.62% |
+1.37% |
| Retail |
$RLX |
2,457.69 |
-30.74 |
-1.24% |
+0.34% |
| Gold & Silver |
$XAU |
104.82 |
+1.89 |
+1.84% |
-1.96% |
| Bank |
$BKX |
107.70 |
-2.10 |
-1.91% |
-4.99% |
| Biotech |
$BTK |
4,953.78 |
-106.72 |
-2.11% |
-2.24% |
|
|
|
 |
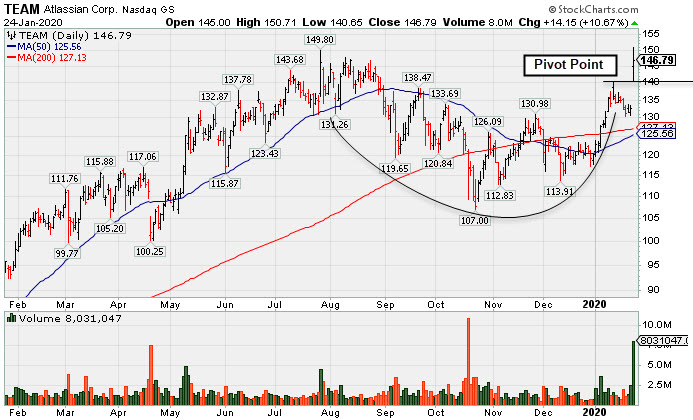
Gapped Up Today Following Another Strong Earnings Report
Kenneth J. Gruneisen - Passed the CAN SLIM® Master's Exam
Atlassian Corp (TEAM +$14.15 or +10.67% to $146.79) was highlighted in yellow with pivot point cited based on its 1/13/20 high in the earlier mid-day report (read here). It gapped up today and touched a new all-time high, rising from a cup-with-handle base pattern with a big volume-driven gain triggering a technical buy signal. Volume was +514% above average behind the big gain, action indicative of fresh institutional buying demand.
Bullish action came after it reported earnings +48% on +37% sales revenues for the Dec '19 quarter. Fundamentals remained strong while it went through a deep consolidation below its 200 DMA line since dropped from the Featured Stocks list on 9/09/19. This Australia - based software developer has shown 9 consecutive quarterly comparisons above the +25% minimum guideline (C criteria). Its annual earnings (A criteria) history has been strong since its $21 IPO on 12/10/15.
TEAM was last shown in the FSU section on 8/21/19 with an annotated graph under the headline, "Consolidating Near High After Recently Finding Support". The number of top-rated funds owning its shares rose from 266 in Sep '17 to 648 in Dec '19, a reassuring sign concerning the I criteria. It has a Timeliness Rating of A and Sponsorship Rating of A. Its current Up/Down Volume Ratio of 1.6 is an unbiased indication its shares have been under accumulation over the past 50 days. |
|
|
Color Codes Explained :
Y - Better candidates highlighted by our
staff of experts.
G - Previously featured
in past reports as yellow but may no longer be buyable under the
guidelines.
***Last / Change / Volume data in this table is the closing quote data***
Symbol/Exchange
Company Name
Industry Group |
PRICE |
CHANGE
(%Change) |
Day High |
Volume
(% DAV)
(% 50 day avg vol) |
52 Wk Hi
% From Hi |
Featured
Date |
Price
Featured |
Pivot Featured |
|
Max Buy |
 FTNT
-
NASDAQ
FTNT
-
NASDAQ
Fortinet Inc
Computer Sftwr-Security
|
$117.99
|
-1.08
-0.91% |
$120.28
|
1,090,031
93.48% of 50 DAV
50 DAV is 1,166,000
|
$120.44
-2.03%
|
12/9/2019
|
$103.85
|
PP = $106.10
|
|
MB = $111.41
|
Most Recent Note - 1/21/2020 4:21:43 PM
G - Holding its ground stubbornly after wedging higher with gains lacking great volume conviction. Very extended from any sound base. Its 50 DMA line ($106.84) defines important near-term support to watch on pullbacks.
>>> FEATURED STOCK ARTICLE : Extended From Base After Wedging Higher - 1/14/2020 |
View all notes |
Set NEW NOTE alert |
Company Profile |
SEC
News |
Chart |
Request a new note
C
A
S
I |
SPSC
-
NASDAQ
S P S Commerce Inc
COMPUTER SOFTWARE and SERVICES - Application Software
|
$58.42
|
-0.43
-0.72% |
$59.98
|
143,516
81.54% of 50 DAV
50 DAV is 176,000
|
$59.14
-1.22%
|
11/29/2019
|
$56.59
|
PP = $59.24
|
|
MB = $62.20
|
Most Recent Note - 1/22/2020 5:38:58 PM
Y - Posted a solid volume-driven gain today for its second-best ever close. Perched near its all-time high with no resistance remaining. Subsequent gains above its pivot point backed by at least +40% above average volume are needed to trigger a new technical buy signal. Fundamentals remain strong. Its Relative Strength Rating of 85 is above the 80+ minimum guideline for buy candidates.
>>> FEATURED STOCK ARTICLE : Still Lingering Below Prior Resistance - 1/13/2020 |
View all notes |
Set NEW NOTE alert |
Company Profile |
SEC
News |
Chart |
Request a new note
C
A
S
I |
AUDC
-
NASDAQ
Audiocodes Ltd
ELECTRONICS - Scientific and Technical Instrum
|
$28.02
|
-0.10
-0.36% |
$28.48
|
189,740
73.26% of 50 DAV
50 DAV is 259,000
|
$28.73
-2.47%
|
9/13/2019
|
$19.68
|
PP = $19.84
|
|
MB = $20.83
|
Most Recent Note - 1/22/2020 5:35:12 PM
G - Hit yet another new all-time high with below average volume behind today's gain. Very extended from the previously noted base. Its 50 DMA line ($24.69) defines support above with prior highs in the $22 area. Fundamentals remain strong.
>>> FEATURED STOCK ARTICLE : Large Loss With Higher Volume Indicates Distributional Pressure - 1/6/2020 |
View all notes |
Set NEW NOTE alert |
Company Profile |
SEC
News |
Chart |
Request a new note
C
A
S
I |
CHDN
-
NASDAQ
Churchill Downs Inc
LEISURE - Gaming Activities
|
$142.97
|
-0.07
-0.05% |
$143.70
|
165,051
74.35% of 50 DAV
50 DAV is 222,000
|
$145.73
-1.89%
|
10/8/2019
|
$129.77
|
PP = $132.83
|
|
MB = $139.47
|
Most Recent Note - 1/21/2020 5:09:25 PM
G - Reversed into the red after hitting another new 52-week high today following 5 consecutive gains with light volume. Its 50 DMA line ($133) defines near-term support above the prior low ($132.55 on 1/03/19) The Jun and Sep '19 quarterly earnings versus the year ago periods were both below the +25% minimum guideline (C criteria) and raised fundamental concerns. See the latest FSU analysis for more details and a new annotated graph.
>>> FEATURED STOCK ARTICLE : Reversal From High Following 5 Gains With Light Volume - 1/21/2020 |
View all notes |
Set NEW NOTE alert |
Company Profile |
SEC
News |
Chart |
Request a new note
C
A
S
I |
LULU
-
NASDAQ
Lululemon Athletica
MANUFACTURING - Textile Manufacturing
|
$240.35
|
-2.71
-1.11% |
$245.06
|
937,827
47.34% of 50 DAV
50 DAV is 1,981,000
|
$247.51
-2.89%
|
9/6/2019
|
$201.25
|
PP = $194.35
|
|
MB = $204.07
|
Most Recent Note - 1/23/2020 4:59:16 PM
G - Still stubbornly holding its ground perched near its all-time high with volume totals cooling. Extended from any sound base. Its 50 DMA line ($228) and prior low ($218.18 on 12/12/19) define important near-term support to watch. Fundamentals remain strong.
>>> FEATURED STOCK ARTICLE : Perched at All-Time High After Gains Lacking Great Volume - 1/9/2020 |
View all notes |
Set NEW NOTE alert |
Company Profile |
SEC
News |
Chart |
Request a new note
C
A
S
I |
Symbol/Exchange
Company Name
Industry Group |
PRICE |
CHANGE
(%Change) |
Day High |
Volume
(% DAV)
(% 50 day avg vol) |
52 Wk Hi
% From Hi |
Featured
Date |
Price
Featured |
Pivot Featured |
|
Max Buy |
CPRT
-
NASDAQ
Copart Inc
SPECIALTY RETAIL - Auto Dealerships
|
$100.29
|
+0.39
0.39% |
$101.11
|
797,953
42.97% of 50 DAV
50 DAV is 1,857,000
|
$100.35
-0.06%
|
1/2/2020
|
$92.80
|
PP = $92.51
|
|
MB = $97.14
|
Most Recent Note - 1/23/2020 4:58:23 PM
G - Perched at its all-time high and its color code is changed to green after wedging above its "max buy" level with gains marked by below average volume. Its 50 DMA line ($90.61) defines near-term support. Fundamentals remain strong.
>>> FEATURED STOCK ARTICLE : Perched at All-Time HIgh Following Recent Volume-Driven Gain - 1/7/2020 |
View all notes |
Set NEW NOTE alert |
Company Profile |
SEC
News |
Chart |
Request a new note
C
A
S
I |
NMIH
-
NASDAQ
N M I Holdings Inc Cl A
Finance-MrtgandRel Svc
|
$32.66
|
-0.10
-0.31% |
$33.18
|
411,271
79.55% of 50 DAV
50 DAV is 517,000
|
$35.79
-8.75%
|
11/8/2019
|
$32.89
|
PP = $31.44
|
|
MB = $33.01
|
Most Recent Note - 1/21/2020 4:24:09 PM
G - Endured distributional pressure today with a loss on higher volume after a quiet rebound above the 50 DMA line ($33.19). Prior highs in the $30-31 area define the next important near-term support. Fundamentals remain strong.
>>> FEATURED STOCK ARTICLE : Outlook Hurt by Slump Below 50-Day Moving Average - 1/10/2020 |
View all notes |
Set NEW NOTE alert |
Company Profile |
SEC
News |
Chart |
Request a new note
C
A
S
I |
SPLK
-
NASDAQ
Splunk Inc
Computer Sftwr-Database
|
$157.00
|
-0.84
-0.53% |
$160.98
|
907,861
44.55% of 50 DAV
50 DAV is 2,038,000
|
$161.49
-2.78%
|
11/25/2019
|
$147.79
|
PP = $142.16
|
|
MB = $149.27
|
Most Recent Note - 1/22/2020 5:37:21 PM
G - Holding its ground stubbornly near its all-time high following recent gains backed by below average volume, extended from the previously noted base. Its 50 DMA line ($145) and prior highs in the $142-143 area define important support to watch on pullbacks.
>>> FEATURED STOCK ARTICLE : New High Hit With Another Gain on Near Average Volume - 1/8/2020 |
View all notes |
Set NEW NOTE alert |
Company Profile |
SEC
News |
Chart |
Request a new note
C
A
S
I |
PAYC
-
NYSE
Paycom Software Inc
COMPUTER SOFTWARE and SERVICES - Application Software
|
$314.81
|
-0.04
-0.01% |
$317.87
|
2,162,940
386.93% of 50 DAV
50 DAV is 559,000
|
$306.37
2.75%
|
11/20/2019
|
$252.97
|
PP = $259.81
|
|
MB = $272.80
|
 Most Recent Note - 1/24/2020 12:33:54 PM
G - Gapped up on the prior session hitting a new all-time high, getting more extended from any sound base. Its prior high ($279.95 on 11/27/19) and its 50 DMA line ($269) define important near-term support levels to watch. Fundamentals remain strong.
>>> FEATURED STOCK ARTICLE : Gapped Up for New High But Ended Near Session Low - 1/23/2020 |
View all notes |
Set NEW NOTE alert |
Company Profile |
SEC
News |
Chart |
Request a new note
C
A
S
I |
BLD
-
NYSE
Topbuild Corp
Bldg-Constr Prds/Misc
|
$113.70
|
-3.77
-3.21% |
$119.99
|
291,230
106.29% of 50 DAV
50 DAV is 274,000
|
$115.23
-1.33%
|
12/9/2019
|
$109.71
|
PP = $113.84
|
|
MB = $119.53
|
Most Recent Note - 1/23/2020 4:56:41 PM
Y - Hit another new 52-week high and finished strong with today's 8th consecutive gain backed by volume slightly above average. Recent rebound above its 50 DMA line ($107.42) helped its outlook to improve.
>>> FEATURED STOCK ARTICLE : Fifth Consecutive Gain Leaves TopBuild Near 52-Week High - 1/17/2020 |
View all notes |
Set NEW NOTE alert |
Company Profile |
SEC
News |
Chart |
Request a new note
C
A
S
I |
Symbol/Exchange
Company Name
Industry Group |
PRICE |
CHANGE
(%Change) |
Day High |
Volume
(% DAV)
(% 50 day avg vol) |
52 Wk Hi
% From Hi |
Featured
Date |
Price
Featured |
Pivot Featured |
|
Max Buy |
TEAM
-
NASDAQ
Atlassian Corp Plc Cl A
Comp Sftwr-Spec Enterprs
|
$146.79
|
+14.15
10.67% |
$150.71
|
8,029,848
614.84% of 50 DAV
50 DAV is 1,306,000
|
$149.80
-2.01%
|
1/24/2020
|
$144.66
|
PP = $140.49
|
|
MB = $147.51
|
Most Recent Note - 1/24/2020 5:59:29 PM
Y - Finished strong today after highlighted in yellow with pivot point cited based on its 1/13/20 high in the earlier mid-day report. Gapped up and touched a new all-time high, rising from a cup-with-handle base pattern with volume +514% above average behind the considerable gain triggering a technical buy signal. Bullish action came after it reported earnings +48% on +37% sales revenues for the Dec '19 quarter. Fundamentals remained strong while it went through a deep consolidation below its 200 DMA line since dropped from the Featured Stocks list on 9/09/19. See the latest FSU analysis for more details and a new annotated graph.
>>> FEATURED STOCK ARTICLE : Gapped Up Today Following Another Strong Earnings Report - 1/24/2020 |
View all notes |
Set NEW NOTE alert |
Company Profile |
SEC
News |
Chart |
Request a new note
C
A
S
I |
GLOB
-
NYSE
Globant SA
Computer-Tech Services
|
$124.18
|
+0.68
0.55% |
$126.79
|
191,874
69.02% of 50 DAV
50 DAV is 278,000
|
$120.93
2.69%
|
11/14/2019
|
$106.87
|
PP = $112.43
|
|
MB = $118.05
|
Most Recent Note - 1/21/2020 4:26:58 PM
Y - Ended near the session low after a "negative reversal" following a streak of 5 quiet gains for new highs. Gains above the pivot point backed by at least +40% above average volume are needed to trigger a proper technical buy signal. Its 50 DMA line ($105.63) defines important near-term support to watch on pullbacks. Fundamentals remain strong.
>>> FEATURED STOCK ARTICLE : Gain for New High Today Backed by Only +12% Above Average Volume - 1/15/2020 |
View all notes |
Set NEW NOTE alert |
Company Profile |
SEC
News |
Chart |
Request a new note
C
A
S
I |
STNE
-
NASDAQ
Stoneco Ltd Cl A
Finance-CrdtCard/PmtPr
|
$43.15
|
-1.88
-4.17% |
$45.48
|
1,616,894
81.87% of 50 DAV
50 DAV is 1,975,000
|
$45.62
-5.41%
|
1/22/2020
|
$43.94
|
PP = $45.72
|
|
MB = $48.01
|
Most Recent Note - 1/24/2020 6:01:44 PM
Y - Abruptly retreated from near its 52-week high with light volume behind today's big loss. Subsequent gains above the pivot point backed by at least +40% above average volume may trigger a technical buy signal. This Brazilian company reported earnings +70% on +55% sales revenues for the Sep '19 quarter, and prior quarterly comparisons were strong. Completed a Secondary Offering on 4/03/18 and went through a deep consolidation Completed its $24 IPO on 10/25/18. See the latest FSU analysis for more details and an annotated graph.
>>> FEATURED STOCK ARTICLE : Perched Near High With Best-Ever Close After Volume-Driven Gain - 1/22/2020 |
View all notes |
Set NEW NOTE alert |
Company Profile |
SEC
News |
Chart |
Request a new note
C
A
S
I |
|
|
|
THESE ARE NOT BUY RECOMMENDATIONS!
Comments contained in the body of this report are technical
opinions only. The material herein has been obtained
from sources believed to be reliable and accurate, however,
its accuracy and completeness cannot be guaranteed.
This site is not an investment advisor, hence it does
not endorse or recommend any securities or other investments.
Any recommendation contained in this report may not
be suitable for all investors and it is not to be deemed
an offer or solicitation on our part with respect to
the purchase or sale of any securities. All trademarks,
service marks and trade names appearing in this report
are the property of their respective owners, and are
likewise used for identification purposes only.
This report is a service available
only to active Paid Premium Members.
You may opt-out of receiving report notifications
at any time. Questions or comments may be submitted
by writing to Premium Membership Services 665 S.E. 10 Street, Suite 201 Deerfield Beach, FL 33441-5634 or by calling 1-800-965-8307
or 954-785-1121.
|
|
|