You are not logged in.
This means you
CAN ONLY VIEW reports that were published prior to Monday, April 14, 2025.
You
MUST UPGRADE YOUR MEMBERSHIP if you want to see any current reports.
AFTER MARKET UPDATE - THURSDAY, JANUARY 24TH, 2013
Previous After Market Report Next After Market Report >>>
|
|
|
|
DOW |
+46.00 |
13,825.33 |
+0.33% |
|
Volume |
678,536,550 |
+6% |
|
Volume |
1,996,961,080 |
+20% |
|
NASDAQ |
-23.29 |
3,130.38 |
-0.74% |
|
Advancers |
1,680 |
54% |
|
Advancers |
1,374 |
53% |
|
S&P 500 |
+0.01 |
1,494.82 |
+0.00% |
|
Decliners |
1,316 |
42% |
|
Decliners |
1,100 |
42% |
|
Russell 2000 |
+3.49 |
900.19 |
+0.39% |
|
52 Wk Highs |
464 |
|
|
52 Wk Highs |
217 |
|
|
S&P 600 |
+3.70 |
505.90 |
+0.74% |
|
52 Wk Lows |
11 |
|
|
52 Wk Lows |
8 |
|
|
 |
Tech-Heavy Nasdaq Lagged While Broader Market Enjoyed Gains
Kenneth J. Gruneisen - Passed the CAN SLIM® Master's Exam
The Dow remains on pace for its best January since 1997 as the blue-chip index gained 46 points to 13,825. The S&P 500 Index touched 1,500 for the first time since 2007 before closing virtually unchanged at 1,494. The Nasdaq Composite Index lagged while weakness in technology prevented a broad market advance. Thursday's session's volume totals were reported higher on the NYSE and on the Nasdaq exchange, indicating an encouraging increase in institutional buying demand overall. Breadth was positive as advancers led decliners by nearly a 3-2 margin on the NYSE, and advancing issues maintained a lead by a narrower 7-6 margin on the Nasdaq exchange. The total number of stocks hitting new 52-week highs swelled and easily outnumbered new 52-week lows on the NYSE and on the Nasdaq exchange. There were 136 high-ranked companies from the CANSLIM.net Leaders List making new 52-week highs and appearing on the CANSLIM.net BreakOuts Page, up solidly from the prior session total of 98 stocks. There were gains for 7 of the 10 high-ranked companies currently included on the Featured Stocks Page. Patience and selectivity are required, however, as the latest rally has produced very few action worthy candidates meeting all of the fact-based investment system's criteria.
Economic data helped the market advance. U.S. jobless claims unexpectedly fell to the lowest level since January 2008 and the index of leading economic indicators advanced in December by the most in three months. In addition, Chinese manufacturing expanded at the fastest pace in two years.
Apple Inc (AAPL -12.35%) led the tech sector lower with a loss of $63.94 to $449.96 after posting its slowest profit growth since 2003 and missing revenue estimates for the third straight quarter. Nearly all other sectors gained ground thanks to better-than-expected profit tallies and encouraging economic data. Netflix Inc (NFLX +42.22%) reported an unexpected profit and rallied $43.57 to $146.90, marking its best closing level since September 2010. 3M Corp (MMM +0.18%) held its ground as it also topped earnings expectations thanks to sales growth in Asia. Fellow Dow components, Microsoft Corp (MSFT +0.07%) and AT&T Inc (T -0.09%) both hugged the flatline, and they reported earnings after the close along with Starbucks Corp (SBUX +0.20%).
In fixed-income, Treasuries were lower with 10-year note down 7/32 to yield 1.85% and the 30-year bond lost 17/32 to yield 3.04%.
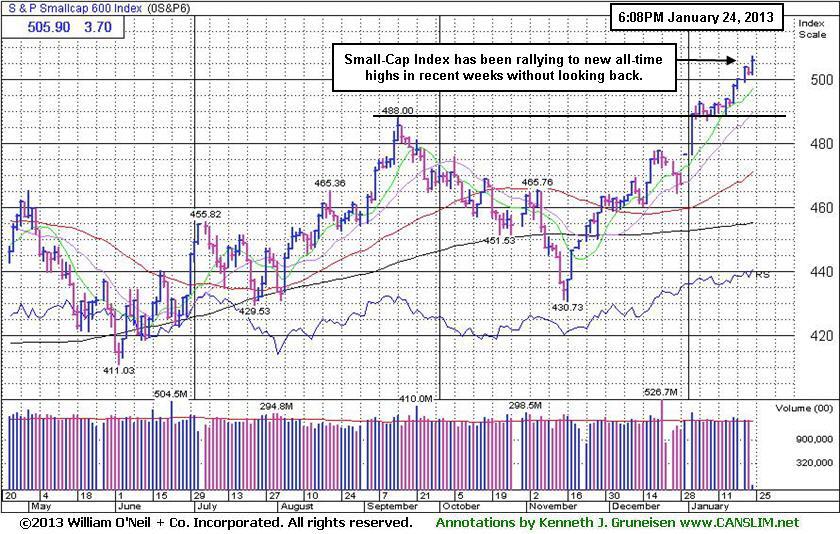
Investors may consider new buying efforts in stocks meeting all key criteria, as the market's (M criteria) confirmed uptrend showed a great expansion in leadership (stocks hitting new 52-week highs). Widespread gains helped all of the major averages blast higher, and the benchmark S&P 500 Index is perched at its best level in more than five years.
Watch for an announcement via email concerning the next WEBCAST. The webcast will also be available via an updated link highlighted at the top of the Premium Member Homepage.
PICTURED: The S&P Small Cap 600 Index has been rallying for new all-time highs in recent weeks without looking back.
|
 Kenneth J. Gruneisen started out as a licensed stockbroker in August 1987, a couple of months prior to the historic stock market crash that took the Dow Jones Industrial Average down -22.6% in a single day. He has published daily fact-based fundamental and technical analysis on high-ranked stocks online for two decades. Through FACTBASEDINVESTING.COM, Kenneth provides educational articles, news, market commentary, and other information regarding proven investment systems that work in good times and bad.
Comments contained in the body of this report are technical opinions only and are not necessarily those of Gruneisen Growth Corp. The material herein has been obtained from sources believed to be reliable and accurate, however, its accuracy and completeness cannot be guaranteed. Our firm, employees, and customers may effect transactions, including transactions contrary to any recommendation herein, or have positions in the securities mentioned herein or options with respect thereto. Any recommendation contained in this report may not be suitable for all investors and it is not to be deemed an offer or solicitation on our part with respect to the purchase or sale of any securities. |
|
 |
Retail & Financial Indexes Underpin Rally While Defensive Gold & Silver Group Suffers
Kenneth J. Gruneisen - Passed the CAN SLIM® Master's Exam
The financial groups were a positive influence on the major averages as the Broker/Dealer Index ($XBD +1.03%) and the Bank Index ($BKX +0.41%) tallied gains. The Retail Index ($RLX +1.97%) also was a positive influence on the major averages as it posted a standout gain. The Internet Index ($IIX +2.19%) helped the tech sector while the Semiconductor Index ($SOX -0.88%) lost ground and lagged, and the Networking Index ($NWX +0.23%) and Biotechnology Index ($BTK +0.55%) each posted small gains. Energy-related shares were mixed as the Integrated Oil Index ($XOI +0.68%) posted a modest gain while the Services Index ($OSX -0.47%) edged lower. The Healthcare Index ($HMO +1.12%) posted a gain. Meanwhile, the Gold & Silver Index ($XAU -3.15%) suffered its second consecutive large loss, continuing to lag behind growth-oriented groups.
Charts courtesy www.stockcharts.com
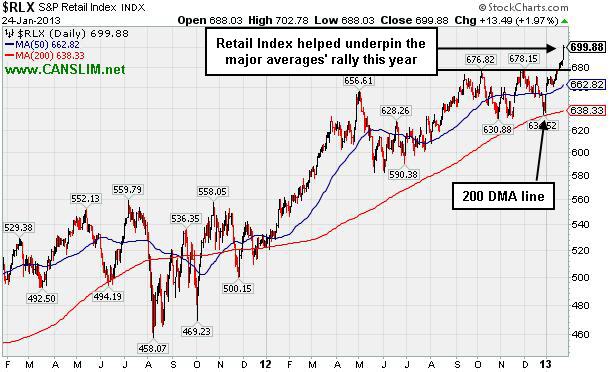
PICTURED: The Retail Index ($RLX +1.97%) has roared higher this year despite the stress which was added for consumers by expiring payroll tax cuts.
| Oil Services |
$OSX |
241.58 |
-1.14 |
-0.47% |
+9.73% |
| Healthcare |
$HMO |
2,685.41 |
+29.69 |
+1.12% |
+6.81% |
| Integrated Oil |
$XOI |
1,319.88 |
+8.88 |
+0.68% |
+6.28% |
| Semiconductor |
$SOX |
410.24 |
-3.64 |
-0.88% |
+6.82% |
| Networking |
$NWX |
244.45 |
+0.56 |
+0.23% |
+7.90% |
| Internet |
$IIX |
352.94 |
+7.56 |
+2.19% |
+7.93% |
| Broker/Dealer |
$XBD |
101.23 |
+1.03 |
+1.03% |
+7.32% |
| Retail |
$RLX |
699.88 |
+13.49 |
+1.97% |
+7.17% |
| Gold & Silver |
$XAU |
154.78 |
-5.04 |
-3.15% |
-6.53% |
| Bank |
$BKX |
53.95 |
+0.22 |
+0.41% |
+5.21% |
| Biotech |
$BTK |
1,659.90 |
+9.15 |
+0.55% |
+7.30% |
|
|
|
 |
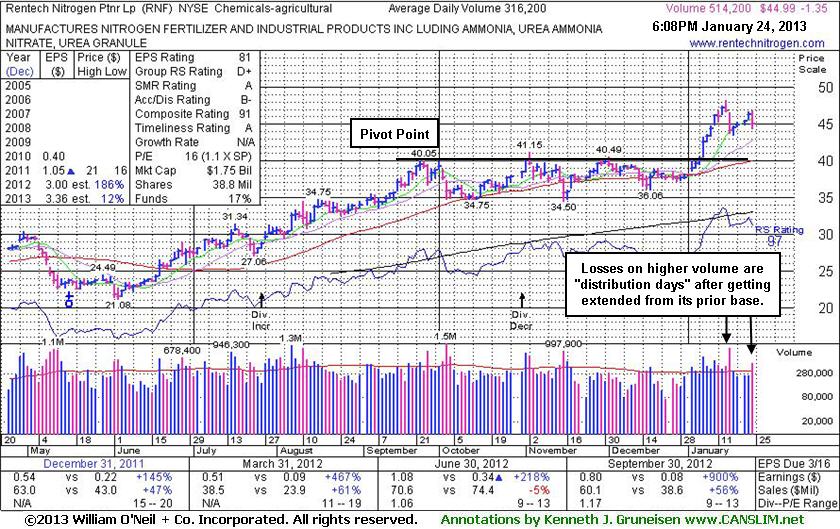
Distributional Pressure After Getting Extended From Ideal Buy Range
Kenneth J. Gruneisen - Passed the CAN SLIM® Master's Exam
Rentech Nitrogen Ptnr LP (RNF -$1.35 or -2.91% to $44.99) encountered more distributional pressure today with higher volume behind its loss. Prior highs in the $40 area define near-term support to watch. It was last shown in this FSU section on 1/09/13 with an annotated graph under the headline, "Extended From Base After 8 Session Winning Streak". Since then it tallied additional gains, and it has now retreated -6.6% from its 52-week high. It was previously noted - "The number of top-rated funds owning its shares had fallen from 52 in Jun '12 to 36 as of Dec '12, a disconcerting sign concerning the I criteria. However, its current Up/Down Volume Ratio of 1.4 indicates a reassuring sign of institutional accumulation over the past 50 days." Today its Up/Down Volume Ration sits at 1.2.
Repeating a point emphasized in this FSU section - "Disciplined investors avoid chasing extended stocks more than +5% above their pivot point. Making sloppy buy decisions by chasing extended stocks invites a much greater chance that an ordinary consolidation might prompt investors to invoke the investment system's strict loss-limiting sell rule after a pullback of -7% or more from their purchase price."
|
|
|
Color Codes Explained :
Y - Better candidates highlighted by our
staff of experts.
G - Previously featured
in past reports as yellow but may no longer be buyable under the
guidelines.
***Last / Change / Volume data in this table is the closing quote data***
Symbol/Exchange
Company Name
Industry Group |
PRICE |
CHANGE
(%Change) |
Day High |
Volume
(% DAV)
(% 50 day avg vol) |
52 Wk Hi
% From Hi |
Featured
Date |
Price
Featured |
Pivot Featured |
|
Max Buy |
CELG
-
NASDAQ
Celgene Corp
DRUGS - Drug Manufacturers - Major
|
$97.49
|
-0.73
-0.74% |
$98.77
|
3,418,410
92.16% of 50 DAV
50 DAV is 3,709,400
|
$100.12
-2.63%
|
12/11/2012
|
$82.24
|
PP = $81.34
|
|
MB = $85.41
|
 Most Recent Note - 1/24/2013 2:59:35 PM
G - Hovering in a tight range near its all-time high, very extended from its prior base. See the recent Featured Stock Update (FSU) analysis for the latest annotated graph and more details under the headline, "Rule Suggests Letting Explosive Winners Have Time For Greater Gains - Thursday, January 17, 2013 ".
>>> The latest Featured Stock Update with an annotated graph appeared on 1/17/2013. Click here.
View all notes |
Alert me of new notes |
CANSLIM.net Company Profile |
SEC |
Zacks Reports |
StockTalk |
News |
Chart |
Request a new note
C
A N
S L
I M


|
CFNL
-
NASDAQ
Cardinal Financial Corp
BANKING - Regional - Southeast Banks
|
$16.30
|
+0.19
1.18% |
$16.34
|
267,689
119.24% of 50 DAV
50 DAV is 224,500
|
$16.90
-3.55%
|
12/3/2012
|
$15.20
|
PP = $16.31
|
|
MB = $17.13
|
Most Recent Note - 1/24/2013 3:04:06 PM
Y - Found support at its 50 DMA line recently. That important short-term average acted as support throughout its ongoing ascent. Subsequent losses leading to a damaging violation and a slump below the recent low ($15.74 on 1/18/13) would raise concerns and trigger technical sell signals.
>>> The latest Featured Stock Update with an annotated graph appeared on 1/15/2013. Click here.
View all notes |
Alert me of new notes |
CANSLIM.net Company Profile |
SEC |
Zacks Reports |
StockTalk |
News |
Chart |
Request a new note
C
A N
S L
I M
|
CMCSA
-
NASDAQ
Comcast Corp Cl A
MEDIA - CATV Systems
|
$39.58
|
-0.42
-1.05% |
$40.25
|
12,619,249
113.42% of 50 DAV
50 DAV is 11,125,900
|
$40.28
-1.74%
|
12/3/2012
|
$37.08
|
PP = $38.06
|
|
MB = $39.96
|
Most Recent Note - 1/24/2013 3:05:36 PM
Y - Color code is changed to yellow while quietly consolidating just under its "max buy" level. Perched near its 52-week high with no resistance remaining due to overhead supply. Prior highs in the $38 area define initial support to watch on pullbacks.
>>> The latest Featured Stock Update with an annotated graph appeared on 1/11/2013. Click here.
View all notes |
Alert me of new notes |
CANSLIM.net Company Profile |
SEC |
Zacks Reports |
StockTalk |
News |
Chart |
Request a new note
C
A N
S L
I M
|
KORS
-
NYSE
Michael Kors Hldgs Ltd
RETAIL - Apparel Stores
|
$56.73
|
+1.10
1.98% |
$57.40
|
4,001,140
108.64% of 50 DAV
50 DAV is 3,683,000
|
$58.62
-3.22%
|
1/23/2013
|
$54.98
|
PP = $58.72
|
|
MB = $61.66
|
Most Recent Note - 1/24/2013 3:10:12 PM
Y - Today's 4th consecutive gain has it within close striking distance of its 52-week high. Color code was changed to yellow with pivot point cited based on its 11/02/12 high plus 10 cents in the 1/23/13 mid-day report (read here). Disciplined investors may watch for volume-driven gains above the pivot point to trigger a proper technical buy signal before taking action. See the latest FSU analysis under the headline, "High-Ranked Luxury Apparel Firm Worthy For Watchlist - Wednesday, January 23, 2013", for more details and an annotated weekly graph.
>>> The latest Featured Stock Update with an annotated graph appeared on 1/23/2013. Click here.
View all notes |
Alert me of new notes |
CANSLIM.net Company Profile |
SEC |
Zacks Reports |
StockTalk |
News |
Chart |
Request a new note
C
A N
S L
I M
|
MIDD
-
NASDAQ
Middleby Corp
MANUFACTURING - Diversified Machinery
|
$140.42
|
+2.21
1.60% |
$141.16
|
54,771
63.39% of 50 DAV
50 DAV is 86,400
|
$141.00
-0.41%
|
10/8/2012
|
$118.46
|
PP = $122.67
|
|
MB = $128.80
|
Most Recent Note - 1/23/2013 12:19:37 PM
G - Rallying today for a considerable volume-driven gain and new 52-week and all-time highs after an analyst upgrade. Prior reports noted - "Disciplined investors may watch closely for sell signals if holding it and giving it a chance to produce more climactic gains. Its 50-day moving average (DMA) line defines near-term chart support to watch where any violation would trigger a technical sell signal." Earnings +23% on +18% sales for the Sep '12 quarter, below the +25% minimum earnings guideline (C criteria), raised concerns.
>>> The latest Featured Stock Update with an annotated graph appeared on 1/14/2013. Click here.
View all notes |
Alert me of new notes |
CANSLIM.net Company Profile |
SEC |
Zacks Reports |
StockTalk |
News |
Chart |
Request a new note
C
A N
S L
I M
|
Symbol/Exchange
Company Name
Industry Group |
PRICE |
CHANGE
(%Change) |
Day High |
Volume
(% DAV)
(% 50 day avg vol) |
52 Wk Hi
% From Hi |
Featured
Date |
Price
Featured |
Pivot Featured |
|
Max Buy |
N
-
NYSE
Netsuite Inc
DIVERSIFIED SERVICES - Business/Management Services
|
$68.75
|
+0.75
1.10% |
$69.39
|
212,854
60.68% of 50 DAV
50 DAV is 350,800
|
$70.80
-2.90%
|
12/12/2012
|
$64.75
|
PP = $67.12
|
|
MB = $70.48
|
Most Recent Note - 1/23/2013 6:41:50 PM
Y - Gapped up today for a gain with higher (near average) volume. Recent gains above its pivot point were marked by below average volume, still leaving questions concerning the level of institutional buying demand lurking.
>>> The latest Featured Stock Update with an annotated graph appeared on 1/18/2013. Click here.
View all notes |
Alert me of new notes |
CANSLIM.net Company Profile |
SEC |
Zacks Reports |
StockTalk |
News |
Chart |
Request a new note
C
A N
S L
I M
|
NSR
-
NYSE
Neustar Inc
TELECOMMUNICATIONS - Diversified Communication Serv
|
$43.99
|
+0.11
0.25% |
$44.20
|
226,650
54.93% of 50 DAV
50 DAV is 412,600
|
$45.49
-3.30%
|
12/11/2012
|
$41.85
|
PP = $41.41
|
|
MB = $43.48
|
Most Recent Note - 1/24/2013 2:55:30 PM
G - Volume totals have been cooling while consolidating well above its 50 DMA line defining chart support to watch. After hitting a new 52-week high on 1/17/13 there was a worrisome "negative reversal".
>>> The latest Featured Stock Update with an annotated graph appeared on 1/16/2013. Click here.
View all notes |
Alert me of new notes |
CANSLIM.net Company Profile |
SEC |
Zacks Reports |
StockTalk |
News |
Chart |
Request a new note
C
A N
S L
I M
|
RAX
-
NYSE
Rackspace Hosting Inc
INTERNET - Internet Software and; Services
|
$79.24
|
+2.11
2.74% |
$81.36
|
1,982,620
170.28% of 50 DAV
50 DAV is 1,164,300
|
$78.62
0.79%
|
12/18/2012
|
$71.88
|
PP = $70.10
|
|
MB = $73.61
|
Most Recent Note - 1/24/2013 1:57:26 PM
G - Powering to a new all-time high today with above average volume behind a considerable gain. It is extended from the previously noted base. Company will announce its fourth quarter 2012 financial results on Tuesday, February 12, 2013 after the close. See the latest FSU analysis for more details and a new annotated graph.
>>> The latest Featured Stock Update with an annotated graph appeared on 1/22/2013. Click here.
View all notes |
Alert me of new notes |
CANSLIM.net Company Profile |
SEC |
Zacks Reports |
StockTalk |
News |
Chart |
Request a new note
C
A N
S L
I M
|
RNF
-
NYSE
Rentech Nitrogen Ptnr Lp
CHEMICALS - Agricultural Chemicals
|
$44.99
|
-1.35
-2.91% |
$46.77
|
514,229
162.63% of 50 DAV
50 DAV is 316,200
|
$48.19
-6.64%
|
11/1/2012
|
$39.11
|
PP = $40.15
|
|
MB = $42.16
|
Most Recent Note - 1/24/2013 6:43:36 PM
G - Encountering more distributional pressure today with higher volume behind its loss. Prior highs in the $40 area define near-term support to watch. See the latest FSU analysis for more details and a new annotated graph.
>>> The latest Featured Stock Update with an annotated graph appeared on 1/24/2013. Click here.
View all notes |
Alert me of new notes |
CANSLIM.net Company Profile |
SEC |
Zacks Reports |
StockTalk |
News |
Chart |
Request a new note
C
A N
S L
I M
|
VRX
-
NYSE
Valeant Pharmaceuticals
DRUGS - Drug Manufacturers - Other
|
$64.55
|
+0.71
1.11% |
$64.90
|
1,002,885
65.19% of 50 DAV
50 DAV is 1,538,500
|
$64.69
-0.22%
|
12/20/2012
|
$60.24
|
PP = $61.21
|
|
MB = $64.27
|
Most Recent Note - 1/24/2013 5:58:48 PM
G - It is extended from a sound base and posted another small gain today, rallying further above its "max buy" level without great volume conviction.
>>> The latest Featured Stock Update with an annotated graph appeared on 1/10/2013. Click here.
View all notes |
Alert me of new notes |
CANSLIM.net Company Profile |
SEC |
Zacks Reports |
StockTalk |
News |
Chart |
Request a new note
C
A N
S L
I M
|
Symbol/Exchange
Company Name
Industry Group |
PRICE |
CHANGE
(%Change) |
Day High |
Volume
(% DAV)
(% 50 day avg vol) |
52 Wk Hi
% From Hi |
Featured
Date |
Price
Featured |
Pivot Featured |
|
Max Buy |
|
|
|
THESE ARE NOT BUY RECOMMENDATIONS!
Comments contained in the body of this report are technical
opinions only. The material herein has been obtained
from sources believed to be reliable and accurate, however,
its accuracy and completeness cannot be guaranteed.
This site is not an investment advisor, hence it does
not endorse or recommend any securities or other investments.
Any recommendation contained in this report may not
be suitable for all investors and it is not to be deemed
an offer or solicitation on our part with respect to
the purchase or sale of any securities. All trademarks,
service marks and trade names appearing in this report
are the property of their respective owners, and are
likewise used for identification purposes only.
This report is a service available
only to active Paid Premium Members.
You may opt-out of receiving report notifications
at any time. Questions or comments may be submitted
by writing to Premium Membership Services 665 S.E. 10 Street, Suite 201 Deerfield Beach, FL 33441-5634 or by calling 1-800-965-8307
or 954-785-1121.
|
|
|

