***Last / Change / Volume data in this table is the closing quote data***
Symbol/Exchange
Company Name
Industry Group |
PRICE |
CHANGE
(%Change) |
Day High |
Volume
(% DAV)
(% 50 day avg vol) |
52 Wk Hi
% From Hi |
Featured
Date |
Price
Featured |
Pivot Featured |
|
Max Buy |
ARUN
-
NASDAQ
Aruba Networks Inc
COMPUTER HARDWARE - Networking andamp; Communication Dev
|
$21.28
|
-0.56
-2.56% |
$21.81
|
5,149,907
193.23% of 50 DAV
50 DAV is 2,665,200
|
$26.00
-18.15%
|
1/3/2011
|
$22.55
|
PP = $24.38
|
|
MB = $25.60
|
Most Recent Note - 1/24/2011
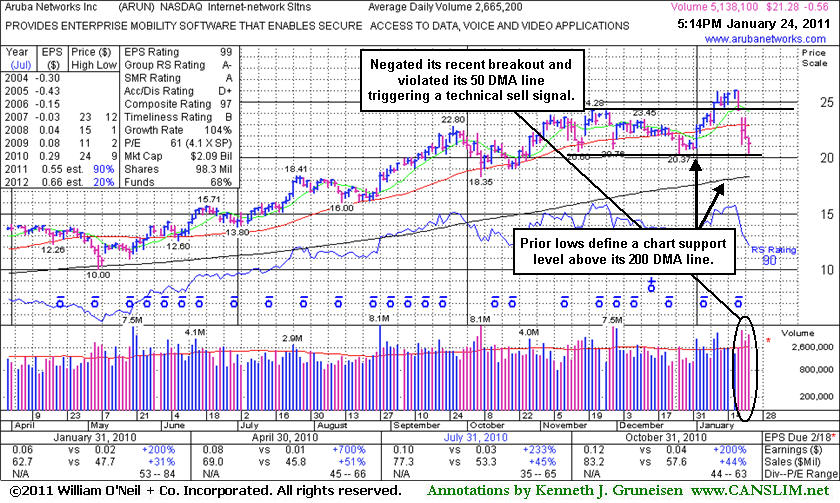
G - Finished in the upper third of its intra-day range today after trading near previously noted lows defining chart support. After negating its latest breakout, and violating its 50-day moving average (DMA) line last week triggering a technical sell signal, more damaging losses may raise serious concerns. See the latest FSU analysis for more details and an annotated graph.
>>> The latest Featured Stock Update with an annotated graph appeared on 1/24/2011. Click here.
View all notes |
Alert me of new notes |
CANSLIM.net Company Profile |
SEC |
Zacks Reports |
StockTalk |
News |
Chart |
Request a new note
C
A N
S L
I M


|
CIS
-
NYSE
Camelot Info Systems Ads
COMPUTER SOFTWARE andamp; SERVICES - Information Technology Service
|
$25.80
|
+0.79
3.16% |
$26.79
|
313,555
66.05% of 50 DAV
50 DAV is 474,700
|
$28.18
-8.45%
|
11/26/2010
|
$18.93
|
PP = $19.72
|
|
MB = $20.71
|
 Most Recent Note - 1/24/2011 5:46:55 PM
G - Posted another gain, showing some resilience near prior highs in the $25 area.
>>> The latest Featured Stock Update with an annotated graph appeared on 1/11/2011. Click here.
View all notes |
Alert me of new notes |
CANSLIM.net Company Profile |
SEC |
Zacks Reports |
StockTalk |
News |
Chart |
Request a new note
C
A N
S L
I M
|
DECK
-
NASDAQ
Deckers Outdoor Corp
CONSUMER NON-DURABLES - Textile - Apparel Footwear
|
$72.38
|
-0.52
-0.71% |
$73.17
|
1,448,459
72.21% of 50 DAV
50 DAV is 2,005,800
|
$87.88
-17.64%
|
10/27/2010
|
$54.16
|
PP = $54.86
|
|
MB = $57.60
|
Most Recent Note - 1/24/2011 5:47:34 PM
G - Down for 5 consecutive losses with near average or lighter volume. It violated its 50 DMA line last week amid broad-based weakness in the market (M criteria), raising concerns and triggering a technical sell signal.
>>> The latest Featured Stock Update with an annotated graph appeared on 12/16/2010. Click here.
View all notes |
Alert me of new notes |
CANSLIM.net Company Profile |
SEC |
Zacks Reports |
StockTalk |
News |
Chart |
Request a new note
C
A N
S L
I M
|
EZCH
-
NASDAQ
Ezchip Semiconductor Ltd
ELECTRONICS - Semiconductor - Specialized
|
$31.74
|
+0.73
2.35% |
$31.86
|
373,522
127.87% of 50 DAV
50 DAV is 292,100
|
$33.20
-4.40%
|
12/2/2010
|
$27.53
|
PP = $26.00
|
|
MB = $27.30
|
Most Recent Note - 1/24/2011 5:48:08 PM
G - Posted a gain today while consolidating above prior chart highs in the $29 area which define initial support to watch well above its 50 DMA line. It is not near a sound base.
>>> The latest Featured Stock Update with an annotated graph appeared on 1/21/2011. Click here.
View all notes |
Alert me of new notes |
CANSLIM.net Company Profile |
SEC |
Zacks Reports |
StockTalk |
News |
Chart |
Request a new note
C
A N
S L
I M
|
EZPW
-
NASDAQ
Ezcorp Inc Cl A
SPECIALTY RETAIL - Specialty Retail, Other
|
$26.84
|
-1.17
-4.18% |
$28.28
|
916,063
241.71% of 50 DAV
50 DAV is 379,000
|
$29.94
-10.35%
|
11/5/2010
|
$24.02
|
PP = $23.85
|
|
MB = $25.04
|
Most Recent Note - 1/24/2011 5:43:59 PM
G - Closed near the session low today and violated its 50 DMA line and prior lows, triggering a technical sell signal with a 4th damaging loss on heavy volume in the span of 5 trading sessions. Last week a negative reversal and wider than normal intra-day price swings were noted as signs of uncertainty and cause for concern. Only a prompt rebound above its 50 DMA line would help its outlook.
>>> The latest Featured Stock Update with an annotated graph appeared on 12/29/2010. Click here.
View all notes |
Alert me of new notes |
CANSLIM.net Company Profile |
SEC |
Zacks Reports |
StockTalk |
News |
Chart |
Request a new note
C
A N
S L
I M
|
Symbol/Exchange
Company Name
Industry Group |
PRICE |
CHANGE
(%Change) |
Day High |
Volume
(% DAV)
(% 50 day avg vol) |
52 Wk Hi
% From Hi |
Featured
Date |
Price
Featured |
Pivot Featured |
|
Max Buy |
FOSL
-
NASDAQ
Fossil Inc
CONSUMER DURABLES - Recreational Goods, Other
|
$69.66
|
+0.42
0.61% |
$69.85
|
521,205
69.05% of 50 DAV
50 DAV is 754,800
|
$74.34
-6.30%
|
11/26/2010
|
$69.10
|
PP = $70.17
|
|
MB = $73.68
|
Most Recent Note - 1/21/2011 4:42:16 PM
G - Consolidating just under its 50 DMA line just -6.9% off its 52-week high. Color code was changed to green due to its recent deterioration and general lack of progress since its 12/02/10 breakout from a "3-weeks tight" pattern. Now perched near an upward trendline connecting its July - October lows, and any further deterioration may trigger a more worrisome technical sell signal.
>>> The latest Featured Stock Update with an annotated graph appeared on 1/12/2011. Click here.
View all notes |
Alert me of new notes |
CANSLIM.net Company Profile |
SEC |
Zacks Reports |
StockTalk |
News |
Chart |
Request a new note
C
A N
S L
I M
|
HMSY
-
NASDAQ
H M S Holdings Corp
COMPUTER SOFTWARE and SERVICES - Healthcare Information Service
|
$66.86
|
+0.46
0.69% |
$66.96
|
135,183
88.41% of 50 DAV
50 DAV is 152,900
|
$67.10
-0.36%
|
11/19/2010
|
$61.89
|
PP = $63.01
|
|
MB = $66.16
|
Most Recent Note - 1/21/2011 4:44:26 PM
G - Stubbornly holding its ground after a base-on-base type pattern. It found support at its 50 DMA line, while its waning Relative Strength rank (now 75) has been noted as a concern.
>>> The latest Featured Stock Update with an annotated graph appeared on 1/3/2011. Click here.
View all notes |
Alert me of new notes |
CANSLIM.net Company Profile |
SEC |
Zacks Reports |
StockTalk |
News |
Chart |
Request a new note
C
A N
S L
I M
|
JOBS
-
NASDAQ
Fifty One Job Inc Ads
DIVERSIFIED SERVICES - Staffing and; Outsourcing Service
|
$56.41
|
+1.13
2.04% |
$57.15
|
162,053
95.72% of 50 DAV
50 DAV is 169,300
|
$61.28
-7.95%
|
10/13/2010
|
$42.07
|
PP = $40.60
|
|
MB = $42.63
|
Most Recent Note - 1/24/2011 5:50:13 PM
G - Positive reversal today was somewhat encouraging while consolidating above prior chart highs and its 50 DMA line defining support.
>>> The latest Featured Stock Update with an annotated graph appeared on 12/30/2010. Click here.
View all notes |
Alert me of new notes |
CANSLIM.net Company Profile |
SEC |
Zacks Reports |
StockTalk |
News |
Chart |
Request a new note
C
A N
S L
I M
|
LULU
-
NASDAQ
Lululemon Athletica
MANUFACTURING - Textile Manufacturing
|
$67.97
|
+1.02
1.52% |
$68.65
|
1,336,136
66.84% of 50 DAV
50 DAV is 1,999,000
|
$74.60
-8.89%
|
10/8/2010
|
$47.66
|
PP = $46.67
|
|
MB = $49.00
|
Most Recent Note - 1/21/2011 4:47:58 PM
G - Down today on below average volume for a 4th consecutive loss. It did not form a sound new base, and it is extended from its 50 DMA line.
>>> The latest Featured Stock Update with an annotated graph appeared on 1/14/2011. Click here.
View all notes |
Alert me of new notes |
CANSLIM.net Company Profile |
SEC |
Zacks Reports |
StockTalk |
News |
Chart |
Request a new note
C
A N
S L
I M
|
MWIV
-
NASDAQ
M W I Veterinary Supply
HEALTH SERVICES - Medical Instruments and; Supplies
|
$61.43
|
-1.34
-2.13% |
$62.92
|
81,614
160.66% of 50 DAV
50 DAV is 50,800
|
$67.13
-8.49%
|
11/4/2010
|
$61.79
|
PP = $59.60
|
|
MB = $62.58
|
Most Recent Note - 1/24/2011 5:46:05 PM
G - Enduring more distributional pressure, today's 4th consecutive loss with above average volume led to violation of its 50 DMA line, raising concerns. That short-term average repeatedly has defined support to watch.
>>> The latest Featured Stock Update with an annotated graph appeared on 12/21/2010. Click here.
View all notes |
Alert me of new notes |
CANSLIM.net Company Profile |
SEC |
Zacks Reports |
StockTalk |
News |
Chart |
Request a new note
C
A N
S L
I M
|
Symbol/Exchange
Company Name
Industry Group |
PRICE |
CHANGE
(%Change) |
Day High |
Volume
(% DAV)
(% 50 day avg vol) |
52 Wk Hi
% From Hi |
Featured
Date |
Price
Featured |
Pivot Featured |
|
Max Buy |
NFLX
-
NASDAQ
Netflix Inc
SPECIALTY RETAIL - Music and Video Stores
|
$183.96
|
+1.87
1.03% |
$184.42
|
3,853,188
69.88% of 50 DAV
50 DAV is 5,513,800
|
$206.80
-11.04%
|
1/10/2011
|
$187.88
|
PP = $209.34
|
|
MB = $219.81
|
Most Recent Note - 1/21/2011 5:08:19 PM
G - Quietly slumped to a close just below its 50 DMA line, now -13% off its 52-week high. Color code was changed to green based on its technical weakness shortly after a new pivot point was cited. Gains above its recent high ($194.84) are needed for its outlook to improve.
>>> The latest Featured Stock Update with an annotated graph appeared on 1/10/2011. Click here.
View all notes |
Alert me of new notes |
CANSLIM.net Company Profile |
SEC |
Zacks Reports |
StockTalk |
News |
Chart |
Request a new note
C
A N
S L
I M
|
NTAP
-
NASDAQ
Netapp Inc
COMPUTER HARDWARE - Data Storage Devices
|
$55.55
|
-0.22
-0.39% |
$56.05
|
4,287,719
75.71% of 50 DAV
50 DAV is 5,663,600
|
$59.79
-7.09%
|
1/6/2011
|
$57.49
|
PP = $58.06
|
|
MB = $60.96
|
Most Recent Note - 1/21/2011 5:20:25 PM
G - Down today for a 4th consecutive decline without great volume conviction, finishing -6.7% off its 52-week high. Color code was changed to green while technical deterioration has followed since a new pivot point was cited.
>>> The latest Featured Stock Update with an annotated graph appeared on 12/27/2010. Click here.
View all notes |
Alert me of new notes |
CANSLIM.net Company Profile |
SEC |
Zacks Reports |
StockTalk |
News |
Chart |
Request a new note
C
A N
S L
I M
|
OPEN
-
NASDAQ
Opentable Inc
INTERNET - Internet Software and Services
|
$74.65
|
-0.22
-0.29% |
$74.98
|
851,591
107.46% of 50 DAV
50 DAV is 792,500
|
$82.70
-9.73%
|
1/5/2011
|
$74.05
|
PP = $76.79
|
|
MB = $80.63
|
Most Recent Note - 1/21/2011 5:22:51 PM
Y - Down today for a 4th consecutive loss with slightly above average volume, slumping further below its pivot point, raising concerns. Waning leadership (fewer new highs) and distributional pressure has weighed on the broader market (M criteria). Disciplined investors limit losses by always selling any stock that falls -7% from their purchase price. Prior highs in the $76 area define initial support to watch above its 50 DMA line.
>>> The latest Featured Stock Update with an annotated graph appeared on 1/5/2011. Click here.
View all notes |
Alert me of new notes |
CANSLIM.net Company Profile |
SEC |
Zacks Reports |
StockTalk |
News |
Chart |
Request a new note
C
A N
S L
I M
|
ORCL
-
NASDAQ
Oracle Corp
COMPUTER SOFTWARE and SERVICES - Application Software
|
$32.40
|
-0.11
-0.34% |
$32.65
|
20,169,833
70.08% of 50 DAV
50 DAV is 28,780,000
|
$32.68
-0.84%
|
1/20/2011
|
$32.31
|
PP = $32.37
|
|
MB = $33.99
|
Most Recent Note - 1/21/2011 5:26:21 PM
Y - Posted a 6th consecutive gain today and closed above its pivot point, but volume was +21% above average, below the minimum guideline for a proper technical buy signal. Rallied against a negative market backdrop for a new 52-week high on the prior session with +68% above average volume, rising from an orderly flat base. Color code was changed to yellow with new pivot point cited base on its 12/17/11 high plus ten cents.
>>> The latest Featured Stock Update with an annotated graph appeared on 1/7/2011. Click here.
View all notes |
Alert me of new notes |
CANSLIM.net Company Profile |
SEC |
Zacks Reports |
StockTalk |
News |
Chart |
Request a new note
C
A N
S L
I M
|
PAY
-
NYSE
Verifone Systems Inc
COMPUTER HARDWARE - Transaction Automation Systems
|
$41.74
|
+0.57
1.38% |
$41.87
|
1,227,708
76.03% of 50 DAV
50 DAV is 1,614,700
|
$44.87
-6.98%
|
11/29/2010
|
$33.96
|
PP = $36.04
|
|
MB = $37.84
|
Most Recent Note - 1/21/2011 5:27:39 PM
G - Today marked a 4th consecutive loss with near average volume. Now -8.2% off its 52-week high, it is extended from any sound base. Recent lows in the $38 area along with its 50 DMA line define important near-term chart support to watch.
>>> The latest Featured Stock Update with an annotated graph appeared on 12/15/2010. Click here.
View all notes |
Alert me of new notes |
CANSLIM.net Company Profile |
SEC |
Zacks Reports |
StockTalk |
News |
Chart |
Request a new note
C
A N
S L
I M
|
Symbol/Exchange
Company Name
Industry Group |
PRICE |
CHANGE
(%Change) |
Day High |
Volume
(% DAV)
(% 50 day avg vol) |
52 Wk Hi
% From Hi |
Featured
Date |
Price
Featured |
Pivot Featured |
|
Max Buy |
PCLN
-
NASDAQ
Priceline.Com Inc
INTERNET - Internet Software and Services
|
$423.80
|
-1.80
-0.42% |
$426.86
|
707,315
74.16% of 50 DAV
50 DAV is 953,800
|
$443.19
-4.38%
|
11/1/2002
|
$399.55
|
PP = $428.20
|
|
MB = $449.61
|
Most Recent Note - 1/21/2011 5:30:41 PM
Y - Small gain today after enduring mild distributional pressure this week. Testing prior highs in the $426 area previously cited as initial support to watch. Its 50 DMA line ($415.10 now) defines a very important support level to watch.
>>> The latest Featured Stock Update with an annotated graph appeared on 1/2/2011. Click here.
View all notes |
Alert me of new notes |
CANSLIM.net Company Profile |
SEC |
Zacks Reports |
StockTalk |
News |
Chart |
Request a new note
C
A N
S L
I M
|
RAX
-
NYSE
Rackspace Hosting Inc
INTERNET - Internet Software and; Services
|
$31.32
|
+0.11
0.35% |
$31.74
|
1,446,790
84.36% of 50 DAV
50 DAV is 1,715,000
|
$35.00
-10.51%
|
1/10/2011
|
$22.84
|
PP = $32.76
|
|
MB = $34.40
|
Most Recent Note - 1/21/2011 5:32:00 PM
G - Gain today was a sign of prompt support near its 50 DMA line after negating its recent breakout. Its prior session low ($29.52) defines support to watch where subsequent violations would raise more serious concerns.
>>> The latest Featured Stock Update with an annotated graph appeared on 12/31/2010. Click here.
View all notes |
Alert me of new notes |
CANSLIM.net Company Profile |
SEC |
Zacks Reports |
StockTalk |
News |
Chart |
Request a new note
C
A N
S L
I M
|
ROVI
-
NASDAQ
Rovi Corp
COMPUTER SOFTWARE andamp; SERVICES - Security Software andamp; Services
|
$63.78
|
+0.25
0.39% |
$64.36
|
941,973
61.02% of 50 DAV
50 DAV is 1,543,800
|
$69.50
-8.23%
|
10/29/2010
|
$49.99
|
PP = $53.10
|
|
MB = $55.76
|
Most Recent Note - 1/21/2011 5:33:33 PM
G - Small loss on light volume today after a damaging distributional session with above average volume. The recent low near $58.50 and its 50 DMA line define chart support levels to watch.
>>> The latest Featured Stock Update with an annotated graph appeared on 12/13/2010. Click here.
View all notes |
Alert me of new notes |
CANSLIM.net Company Profile |
SEC |
Zacks Reports |
StockTalk |
News |
Chart |
Request a new note
C
A N
S L
I M
|
UA
-
NYSE
Under Armour Inc Cl A
CONSUMER NON-DURABLES - Textile - Apparel Clothing
|
$53.52
|
+0.27
0.51% |
$55.35
|
1,302,826
205.59% of 50 DAV
50 DAV is 633,700
|
$60.14
-11.01%
|
9/9/2010
|
$39.99
|
PP = $40.10
|
|
MB = $42.11
|
Most Recent Note - 1/24/2011 5:52:17 PM
G - Traded up near its 50 DMA line today but encountered resistance and closed near the session low. It violated its 50 DMA line last week, raising concerns. The previously noted recent low ($52.66 on 1 10/11) defines an important chart support level to watch.
>>> The latest Featured Stock Update with an annotated graph appeared on 12/23/2010. Click here.
View all notes |
Alert me of new notes |
CANSLIM.net Company Profile |
SEC |
Zacks Reports |
StockTalk |
News |
Chart |
Request a new note
C
A N
S L
I M
|
ULTA
-
NASDAQ
Ulta Salon Cosm & Frag
SPECIALTY RETAIL - Specialty Retail, Other
|
$36.09
|
+0.22
0.61% |
$36.24
|
260,687
44.59% of 50 DAV
50 DAV is 584,600
|
$38.25
-5.65%
|
1/6/2011
|
$36.12
|
PP = $37.34
|
|
MB = $39.21
|
Most Recent Note - 1/21/2011 5:50:10 PM
Y - Losses with near average or light volume this week led to a close just pennies below its 12/01/10 high close, raising some concerns. Technically it negated its recent breakout gain with a close back in its prior base. Perched only -6.2% off its 52-week high, subsequent volume-driven gains above its pivot point would be a very reassuring sign.
>>> The latest Featured Stock Update with an annotated graph appeared on 1/6/2011. Click here.
View all notes |
Alert me of new notes |
CANSLIM.net Company Profile |
SEC |
Zacks Reports |
StockTalk |
News |
Chart |
Request a new note
C
A N
S L
I M
|
Symbol/Exchange
Company Name
Industry Group |
PRICE |
CHANGE
(%Change) |
Day High |
Volume
(% DAV)
(% 50 day avg vol) |
52 Wk Hi
% From Hi |
Featured
Date |
Price
Featured |
Pivot Featured |
|
Max Buy |