You are not logged in.
This means you
CAN ONLY VIEW reports that were published prior to Sunday, October 20, 2024.
You
MUST UPGRADE YOUR MEMBERSHIP if you want to see any current reports.
AFTER MARKET UPDATE - MONDAY, JANUARY 23RD, 2012
Previous After Market Report Next After Market Report >>>
|
|
|
|
DOW |
-11.66 |
12,708.82 |
-0.09% |
|
Volume |
723,088,410 |
-22% |
|
Volume |
1,639,740,870 |
-13% |
|
NASDAQ |
-2.53 |
2,784.17 |
-0.09% |
|
Advancers |
1,751 |
56% |
|
Advancers |
1,108 |
42% |
|
S&P 500 |
+0.62 |
1,316.00 |
+0.05% |
|
Decliners |
1,265 |
41% |
|
Decliners |
1,352 |
52% |
|
Russell 2000 |
-1.57 |
783.05 |
-0.20% |
|
52 Wk Highs |
146 |
|
|
52 Wk Highs |
57 |
|
|
S&P 600 |
-1.07 |
437.61 |
-0.24% |
|
52 Wk Lows |
2 |
|
|
52 Wk Lows |
9 |
|
|
 |
Volume Totals Calm as Investors Assess State of the Market
Kenneth J. Gruneisen - Passed the CAN SLIM® Master's Exam
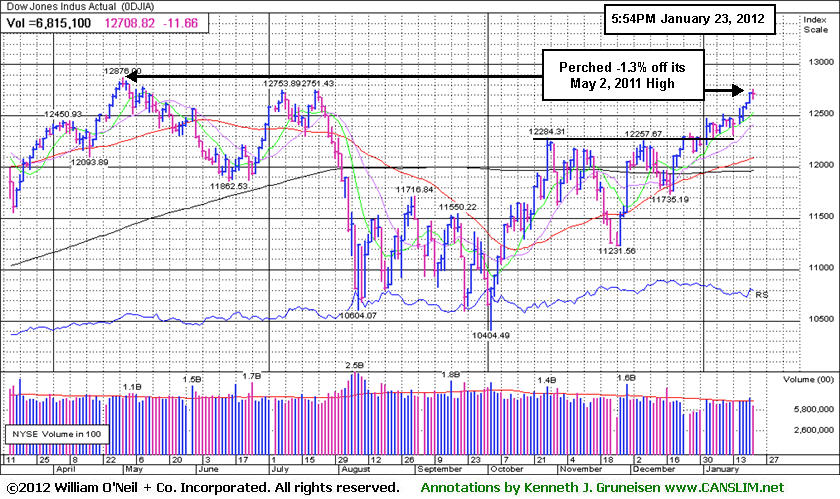
The S&P 500 Index finished with a marginal gain while the Nasdaq Composite Index and the Dow Industrials ended narrowly in the red. Monday's volume totals were reported lighter than the prior session on the NYSE and lower on the Nasdaq exchange. Advancers led decliners about 3-2 on the NYSE while decliners led by a 7-6 margin on the Nasdaq exchange. The total number of new 52-week highs expanded and new 52-week lows fell to the single digits on both exchanges. There were 46 high-ranked companies from the CANSLIM.net Leaders List that made new 52-week highs and appeared on the CANSLIM.net BreakOuts Page, down from the prior session total of 49 stocks. There were gains for 9 of the 19 high-ranked companies currently included on the Featured Stocks Page.
Markets had a cautious tone as investors looked ahead to Tuesday's State of the Union address and the Fed’s two-day FOMC meeting. Investors also are awaiting the results of a meeting between European officials. Finance ministers gathered in Brussels to discuss new budget rules and a Greek debt swap and French Finance Minister Francois Baroin said that negotiations between Greece and its private creditors were making "tangible progress." Due to some investor optimism, European markets closed near session highs. The FTSE was up +0.60% in London, the DAX was higher by +0.50% in Germany, and the ATHEX Index in Greece added on +0.85%. The latest news on the Greek debt swap negotiations suggested an agreement is approaching with private investors agreeing to a 65-70% loss on their Greek bonds. Meanwhile, Germany floated the idea of combining Europe's two rescue funds, in an effort to strengthen the fight against the region's fiscal crisis.
Turning to the home front, markets searched for direction due to a mixed bag of company news. Financials were among the leading gainers. Sears Holdings Corp (SHLD -3.03%) reversed into the red after at one point gaining over +60% in the span of five days following analyst comments and a recent report that CIT Group Inc (CIT -0.48%) will approve financing for the company's vendors. On the downside, Research In Motion Ltd (RIMM -8.47%) reversed earlier gains and fell after the company shuffled up their management team.
Commodities were also in focus. Energy saw upside as oil benefited from a European Union agreement to stop importing oil from Iran and as Iran threatened to close the Strait of Hormuz. Concerns of supply disruptions pushed oil higher for the first time in four days. Meanwhile, gold climbed to a five-week high as the U.S. dollar lost ground.
The recent expansion in leadership (stocks making new 52-week highs) has been noted as a reassuring sign concerning the current confirmed market uptrend and the M criteria, as a healthy crop of strong leaders is necessary for any sustained market advance. Technical improvement from financial shares and key growth areas including the tech sector has been another encouraging sign helping the market outlook.
The Q4 2011 CANSLIM.net Webcast is still available "ON DEMAND" to all upgraded members at no additional cost. Via the Premium Member Homepage links to all prior reports and webcasts are always available.
PICTURED: The Dow Jones Industrial Average is now perched -1.3% off its May 2, 2011 high.
|
 Kenneth J. Gruneisen started out as a licensed stockbroker in August 1987, a couple of months prior to the historic stock market crash that took the Dow Jones Industrial Average down -22.6% in a single day. He has published daily fact-based fundamental and technical analysis on high-ranked stocks online for two decades. Through FACTBASEDINVESTING.COM, Kenneth provides educational articles, news, market commentary, and other information regarding proven investment systems that work in good times and bad.
Comments contained in the body of this report are technical opinions only and are not necessarily those of Gruneisen Growth Corp. The material herein has been obtained from sources believed to be reliable and accurate, however, its accuracy and completeness cannot be guaranteed. Our firm, employees, and customers may effect transactions, including transactions contrary to any recommendation herein, or have positions in the securities mentioned herein or options with respect thereto. Any recommendation contained in this report may not be suitable for all investors and it is not to be deemed an offer or solicitation on our part with respect to the purchase or sale of any securities. |
|
 |
Financial and Commodity-Linked Groups Rose
Kenneth J. Gruneisen - Passed the CAN SLIM® Master's Exam
Commodity linked groups and financial shares posted gains on Monday. The Bank Index ($BKX +0.23%) and Broker/Dealer Index ($XBD +0.46%) posted modest gains. The Gold & Silver Index ($XAU +1.59%) rallied, and the Integrated Oil Index ($XOI +0.76%) and Oil Services Index ($OSX +0.06%) edged higher. Meanwhile, the tech sector had a slightly negative bias as the Biotechnology Index ($BTK -0.84%), Internet Index ($IIX -0.83%), Semiconductor Index ($SOX -0.30%), and Networking Index ($NWX -0.18%) unanimously lost ground. The Retail Index ($RLX -0.31%) and Healthcare Index ($HMO -0.17%) also created a drag on the market.
Charts courtesy www.stockcharts.com
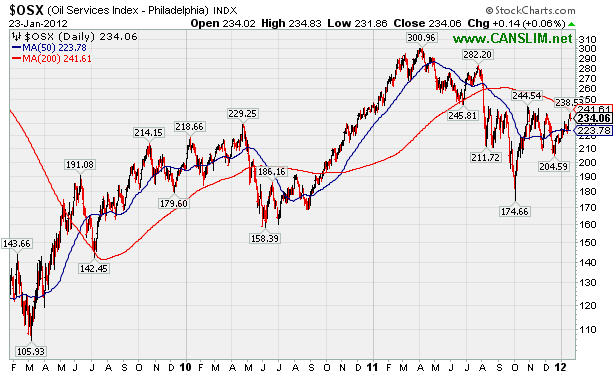
PICTURED: The 3-year chart of the Oil Services Index ($OSX +0.06%) illustrates the choppy action the group has seen. It is now -22% off its April 2011 high and consolidating between its 50-day and 200-day moving average lines
| Oil Services |
$OSX |
234.06 |
+0.14 |
+0.06% |
+8.22% |
| Healthcare |
$HMO |
2,508.09 |
-4.23 |
-0.17% |
+9.93% |
| Integrated Oil |
$XOI |
1,283.50 |
+9.71 |
+0.76% |
+4.43% |
| Semiconductor |
$SOX |
413.09 |
-1.25 |
-0.30% |
+13.35% |
| Networking |
$NWX |
244.16 |
-0.45 |
-0.18% |
+13.48% |
| Internet |
$IIX |
297.28 |
-2.49 |
-0.83% |
+5.51% |
| Broker/Dealer |
$XBD |
95.64 |
+0.43 |
+0.46% |
+14.85% |
| Retail |
$RLX |
549.72 |
-1.72 |
-0.31% |
+5.07% |
| Gold & Silver |
$XAU |
189.99 |
+2.97 |
+1.59% |
+5.18% |
| Bank |
$BKX |
43.60 |
+0.10 |
+0.23% |
+10.72% |
| Biotech |
$BTK |
1,231.98 |
-10.43 |
-0.84% |
+12.88% |
|
|
|
 |
Leader's Relative Strength Line Not Confirming Latest High
Kenneth J. Gruneisen - Passed the CAN SLIM® Master's Exam
Visa Inc (V -$0.98 or -0.97% to $99.60) has encountered mild distributional pressure since its negative reversal on 1/19/12 after touching another new all-time high. Meanwhile, its Relative Strength line has been waning even though the Relative Strength rank still remains well above the 80+ guideline for the best buy candidates. Its recent gains lacked great volume conviction as it struggled to make progress even though no overhead supply remains to act as resistance. Its recent low ($98.33 on 1/11/12) and its 50-day moving average (DMA) line define initial chart support to watch on pullbacks. There is also a multi-month upward trendline that helps define additional chart support.
Its last appearance in this FSU section was on 12/15/11 with an annotated graph under the headline, "Distributional Action After Making Limited Progress." Its quarterly and annual earnings history has been strong enough to satisfy the C and A criteria. The number of top-rated funds owning its shares rose from 1,635 in Dec '10 to 1,919 in Dec '11, a reassuring sign concerning the I criteria, however it is already well known by the institutional crowd. Leadership shown by at least one other well-known firm in the Finance - Credit Card Payment Processing firm (L criteria) has been a reassuring sign.
Disciplined investors always limit losses by selling if ever any stock falls -7% from their purchase price. Otherwise, if leaving the risk un-contained, the damage can become more severe and undisciplined investors must be prepared to suffer the painful consequences.

|
|
|
Color Codes Explained :
Y - Better candidates highlighted by our
staff of experts.
G - Previously featured
in past reports as yellow but may no longer be buyable under the
guidelines.
***Last / Change / Volume data in this table is the closing quote data***
Symbol/Exchange
Company Name
Industry Group |
PRICE |
CHANGE
(%Change) |
Day High |
Volume
(% DAV)
(% 50 day avg vol) |
52 Wk Hi
% From Hi |
Featured
Date |
Price
Featured |
Pivot Featured |
|
Max Buy |
ADS
-
NYSE
Alliance Data Sys Corp
COMPUTER SOFTWARE and SERVICES - Information and Delivery Service
|
$108.79
|
+0.30
0.28% |
$109.28
|
295,125
43.02% of 50 DAV
50 DAV is 686,000
|
$110.16
-1.24%
|
1/17/2012
|
$108.24
|
PP = $107.43
|
|
MB = $112.80
|
Most Recent Note - 1/20/2012 3:57:58 PM
Y - Perched at its all-time high with volume totals cooling since its 1/17/12 gain backed by +40% above average volume, near the bare minimum volume required to trigger a proper technical buy signal. Its 50 DMA line and the 1/04/12 session low ($100.42) define near-term support where violations would raise greater concerns and trigger technical sell signals.
>>> The latest Featured Stock Update with an annotated graph appeared on 1/17/2012. Click here.
View all notes |
Alert me of new notes |
CANSLIM.net Company Profile |
SEC |
Zacks Reports |
StockTalk |
News |
Chart |
Request a new note
C
A N
S L
I M


|
ALXN
-
NASDAQ
Alexion Pharmaceuticals
DRUGS - Drug Manufacturers - Other
|
$74.33
|
+0.75
1.02% |
$75.67
|
1,448,268
120.72% of 50 DAV
50 DAV is 1,199,700
|
$77.58
-4.19%
|
11/30/2011
|
$68.66
|
PP = $70.52
|
|
MB = $74.05
|
Most Recent Note - 1/20/2012 2:40:04 PM
Y - Pulling back below its "max buy" level with today's 3rd consecutive loss and its color code is changed to yellow. Prior resistance in the $70 area defines initial chart support above its 50 DMA line.
>>> The latest Featured Stock Update with an annotated graph appeared on 1/13/2012. Click here.
View all notes |
Alert me of new notes |
CANSLIM.net Company Profile |
SEC |
Zacks Reports |
StockTalk |
News |
Chart |
Request a new note
C
A N
S L
I M
|
CATM
-
NASDAQ
Cardtronics Inc
DIVERSIFIED SERVICES - Business/Management Services
|
$27.28
|
+0.26
0.96% |
$27.39
|
190,743
53.10% of 50 DAV
50 DAV is 359,200
|
$28.74
-5.08%
|
12/23/2011
|
$28.64
|
PP = $28.56
|
|
MB = $29.99
|
Most Recent Note - 1/19/2012 11:46:41 AM
Y - Considerable gain today with above average volume following a new analyst buy rating. Rallying above its 50 DMA line, helping its technical stance improve with a 3rd consecutive gain. Color code was changed to yellow while approaching its previously cited pivot point and trading within close striking distance of its 52-week high.
>>> The latest Featured Stock Update with an annotated graph appeared on 12/23/2011. Click here.
View all notes |
Alert me of new notes |
CANSLIM.net Company Profile |
SEC |
Zacks Reports |
StockTalk |
News |
Chart |
Request a new note
C
A N
S L
I M
|
CELG
-
NASDAQ
Celgene Corp
DRUGS - Drug Manufacturers - Major
|
$73.43
|
-0.41
-0.56% |
$74.13
|
2,605,689
74.74% of 50 DAV
50 DAV is 3,486,200
|
$75.11
-2.24%
|
12/20/2011
|
$66.68
|
PP = $68.35
|
|
MB = $71.77
|
Most Recent Note - 1/20/2012 12:04:47 PM
G - Today's gain has it challenging its 52-week high hit on Tuesday and trading within close striking distance of its all-time high ($77.39 in Aug '08). Prior highs in the $68 area define support to watch on pullbacks.
>>> The latest Featured Stock Update with an annotated graph appeared on 12/29/2011. Click here.
View all notes |
Alert me of new notes |
CANSLIM.net Company Profile |
SEC |
Zacks Reports |
StockTalk |
News |
Chart |
Request a new note
C
A N
S L
I M
|
FEIC
-
NASDAQ
F E I Co
ELECTRONICS - Diversified Electronics
|
$44.21
|
-0.35
-0.79% |
$44.56
|
270,401
97.34% of 50 DAV
50 DAV is 277,800
|
$44.99
-1.73%
|
12/7/2011
|
$41.41
|
PP = $42.35
|
|
MB = $44.47
|
 Most Recent Note - 1/23/2012 12:47:34 PM
G - Quietly consolidating near its all-time high and "max buy" level, slightly extended from its prior base. No overhead supply remains to hinder its upward progress. The 50 DMA line defines chart support above prior lows.
>>> The latest Featured Stock Update with an annotated graph appeared on 12/21/2011. Click here.
View all notes |
Alert me of new notes |
CANSLIM.net Company Profile |
SEC |
Zacks Reports |
StockTalk |
News |
Chart |
Request a new note
C
A N
S L
I M
|
Symbol/Exchange
Company Name
Industry Group |
PRICE |
CHANGE
(%Change) |
Day High |
Volume
(% DAV)
(% 50 day avg vol) |
52 Wk Hi
% From Hi |
Featured
Date |
Price
Featured |
Pivot Featured |
|
Max Buy |
GNC
-
NYSE
G N C Holdings Inc
RETAIL - Drug Stores
|
$29.40
|
+0.61
2.12% |
$29.67
|
925,979
90.03% of 50 DAV
50 DAV is 1,028,500
|
$29.50
-0.34%
|
1/19/2012
|
$28.99
|
PP = $29.60
|
|
MB = $31.08
|
Most Recent Note - 1/23/2012 12:49:23 PM
Y - Touched a new 52-week high today. Color code was changed to yellow with new pivot point cited after forming a new flat base pattern. See the latest FSU analysis for more details and a new annotated graph.
>>> The latest Featured Stock Update with an annotated graph appeared on 1/19/2012. Click here.
View all notes |
Alert me of new notes |
CANSLIM.net Company Profile |
SEC |
Zacks Reports |
StockTalk |
News |
Chart |
Request a new note
C
A N
S L
I M
|
HMSY
-
NASDAQ
H M S Holdings Corp
COMPUTER SOFTWARE and SERVICES - Healthcare Information Service
|
$33.19
|
-0.56
-1.66% |
$34.00
|
425,789
45.61% of 50 DAV
50 DAV is 933,500
|
$34.73
-4.43%
|
10/27/2011
|
$26.44
|
PP = $28.37
|
|
MB = $29.79
|
Most Recent Note - 1/23/2012 12:38:00 PM
G - Pulling back on light volume while perched near its all-time high after recent gains with below average volume. No resistance remains to hinder its progress, but it is extended from its prior base.
>>> The latest Featured Stock Update with an annotated graph appeared on 12/28/2011. Click here.
View all notes |
Alert me of new notes |
CANSLIM.net Company Profile |
SEC |
Zacks Reports |
StockTalk |
News |
Chart |
Request a new note
C
A N
S L
I M
|
ISRG
-
NASDAQ
Intuitive Surgical Inc
HEALTH SERVICES - Medical Appliances and Equipment
|
$444.39
|
-1.29
-0.29% |
$457.86
|
766,171
228.44% of 50 DAV
50 DAV is 335,400
|
$476.49
-6.74%
|
12/20/2011
|
$442.43
|
PP = $449.16
|
|
MB = $471.62
|
Most Recent Note - 1/23/2012 12:03:08 PM
Y - Holding its ground today. Showed resilience and closed in the upper part of its intra-day range after gapping down on the prior session and briefly undercutting below prior lows and its 50 DMA line. Reported earnings +24% on +28% sales revenues for the quarter ended December 31, 2011 versus the year ago period.
>>> The latest Featured Stock Update with an annotated graph appeared on 1/18/2012. Click here.
View all notes |
Alert me of new notes |
CANSLIM.net Company Profile |
SEC |
Zacks Reports |
StockTalk |
News |
Chart |
Request a new note
C
A N
S L
I M
|
LULU
-
NASDAQ
Lululemon Athletica
MANUFACTURING - Textile Manufacturing
|
$62.44
|
+2.32
3.86% |
$62.58
|
3,077,148
77.96% of 50 DAV
50 DAV is 3,946,900
|
$64.49
-3.18%
|
1/10/2012
|
$60.97
|
PP = $59.46
|
|
MB = $62.43
|
Most Recent Note - 1/23/2012 12:41:00 PM
Y - Holding its ground in a tight range since the considerable gap up gain on 1/10/12 helped it break out from a "double bottom" base. The company recently raised its outlook, which is a reassuring sign. Prior chart highs in the low $60s have been acting as a recent resistance level.
>>> The latest Featured Stock Update with an annotated graph appeared on 1/10/2012. Click here.
View all notes |
Alert me of new notes |
CANSLIM.net Company Profile |
SEC |
Zacks Reports |
StockTalk |
News |
Chart |
Request a new note
C
A N
S L
I M
|
MA
-
NYSE
Mastercard Inc Cl A
DIVERSIFIED SERVICES - Business/Management Services
|
$339.06
|
-1.60
-0.47% |
$343.90
|
1,034,239
101.61% of 50 DAV
50 DAV is 1,017,900
|
$384.99
-11.93%
|
1/3/2012
|
$367.87
|
PP = $385.09
|
|
MB = $404.34
|
Most Recent Note - 1/20/2012 2:31:02 PM
G - Gapped down today for a damaging loss with above average volume, slumping near its recent low. Its 200 DMA line is the nearest support level to watch. A rebound above its 50 DMA line is needed, otherwise its technical stance is not that of a sound looking buy candidate.
>>> The latest Featured Stock Update with an annotated graph appeared on 1/3/2012. Click here.
View all notes |
Alert me of new notes |
CANSLIM.net Company Profile |
SEC |
Zacks Reports |
StockTalk |
News |
Chart |
Request a new note
C
A N
S L
I M
|
Symbol/Exchange
Company Name
Industry Group |
PRICE |
CHANGE
(%Change) |
Day High |
Volume
(% DAV)
(% 50 day avg vol) |
52 Wk Hi
% From Hi |
Featured
Date |
Price
Featured |
Pivot Featured |
|
Max Buy |
MKTX
-
NASDAQ
Marketaxess Holdings Inc
FINANCIAL SERVICES - Investment Brokerage - Nationa
|
$31.15
|
-0.58
-1.83% |
$31.77
|
57,652
32.74% of 50 DAV
50 DAV is 176,100
|
$32.23
-3.35%
|
10/28/2011
|
$29.79
|
PP = $31.05
|
|
MB = $32.60
|
Most Recent Note - 1/23/2012 12:44:40 PM
Y - Volume totals have been cooling in recent weeks while hovering near its all-time high and no resistance remains due to overhead supply. The 50 DMA line defines initial chart support to watch.
>>> The latest Featured Stock Update with an annotated graph appeared on 12/20/2011. Click here.
View all notes |
Alert me of new notes |
CANSLIM.net Company Profile |
SEC |
Zacks Reports |
StockTalk |
News |
Chart |
Request a new note
C
A N
S L
I M
|
OSIS
-
NASDAQ
O S I Systems Inc
ELECTRONICS - Semiconductor Equipment and Mate
|
$53.11
|
-2.80
-5.01% |
$56.15
|
174,317
184.66% of 50 DAV
50 DAV is 94,400
|
$56.50
-6.00%
|
11/1/2011
|
$42.07
|
PP = $45.57
|
|
MB = $47.85
|
Most Recent Note - 1/23/2012 12:34:25 PM
G - Pulling back today after rallying to new all-time highs with 12 gains in the prior 13 sessions and getting extended from its prior base. Due to report earnings before the open on Tuesday, January 24th, and volume and volatility often increase near earnings news. Its 50 DMA line defines important support to watch.
>>> The latest Featured Stock Update with an annotated graph appeared on 12/27/2011. Click here.
View all notes |
Alert me of new notes |
CANSLIM.net Company Profile |
SEC |
Zacks Reports |
StockTalk |
News |
Chart |
Request a new note
C
A N
S L
I M
|
PRGO
-
NASDAQ
Perrigo Co
DRUGS - Drug Related Products
|
$99.66
|
+1.18
1.20% |
$100.76
|
634,463
49.57% of 50 DAV
50 DAV is 1,280,000
|
$104.70
-4.81%
|
12/9/2011
|
$99.54
|
PP = $101.56
|
|
MB = $106.64
|
Most Recent Note - 1/19/2012 5:26:54 PM
G - Quietly perched within striking distance of its 52-week high with little resistance remaining due to overhead supply. Found support at its 50 DMA line
>>> The latest Featured Stock Update with an annotated graph appeared on 1/9/2012. Click here.
View all notes |
Alert me of new notes |
CANSLIM.net Company Profile |
SEC |
Zacks Reports |
StockTalk |
News |
Chart |
Request a new note
C
A N
S L
I M
|
RAX
-
NYSE
Rackspace Hosting Inc
INTERNET - Internet Software and; Services
|
$42.28
|
-0.20
-0.47% |
$42.76
|
1,269,785
79.13% of 50 DAV
50 DAV is 1,604,700
|
$46.50
-9.07%
|
11/8/2011
|
$44.28
|
PP = $46.27
|
|
MB = $48.58
|
Most Recent Note - 1/20/2012 7:22:50 PM
G - Color code is changed to green after today's loss on slightly higher volume led to a close below its 50 DMA line. Its recent low ($41.37 on 1/09/12) defines important near-term support to watch above its 200 DMA line.
>>> The latest Featured Stock Update with an annotated graph appeared on 1/5/2012. Click here.
View all notes |
Alert me of new notes |
CANSLIM.net Company Profile |
SEC |
Zacks Reports |
StockTalk |
News |
Chart |
Request a new note
C
A N
S L
I M
|
SXCI
-
NASDAQ
S X C Health Solutions
COMPUTER SOFTWARE and SERVICES - Healthcare Information Service
|
$62.38
|
-0.51
-0.81% |
$64.08
|
346,974
88.67% of 50 DAV
50 DAV is 391,300
|
$66.40
-6.05%
|
1/10/2012
|
$62.05
|
PP = $60.10
|
|
MB = $63.11
|
Most Recent Note - 1/20/2012 7:17:23 PM
Y - Color code is changed to yellow while consolidating just below the "max buy" level. See the latest FSU analysis for more details and a new annotated weekly graph.
>>> The latest Featured Stock Update with an annotated graph appeared on 1/20/2012. Click here.
View all notes |
Alert me of new notes |
CANSLIM.net Company Profile |
SEC |
Zacks Reports |
StockTalk |
News |
Chart |
Request a new note
C
A N
S L
I M
|
Symbol/Exchange
Company Name
Industry Group |
PRICE |
CHANGE
(%Change) |
Day High |
Volume
(% DAV)
(% 50 day avg vol) |
52 Wk Hi
% From Hi |
Featured
Date |
Price
Featured |
Pivot Featured |
|
Max Buy |
TDG
-
NYSE
Transdigm Group Inc
AEROSPACE/DEFENSE - Aerospace/Defense Products and; Services
|
$101.11
|
+4.05
4.17% |
$102.66
|
853,472
251.61% of 50 DAV
50 DAV is 339,200
|
$102.73
-1.58%
|
1/10/2012
|
$98.83
|
PP = $102.83
|
|
MB = $107.97
|
Most Recent Note - 1/23/2012 12:25:20 PM
Y - Announced plans to acquire AmSafe Global Holdings Inc for a total purchase price of approximately $750 million in cash. Spiked higher today with above average volume behind its gain while challenging its 52-week high and approaching its pivot point. No overhead supply remains to act as resistance Recent lows in the $92 area define the next important support level to watch if it slumps below its 50 DMA line.
>>> The latest Featured Stock Update with an annotated graph appeared on 1/4/2012. Click here.
View all notes |
Alert me of new notes |
CANSLIM.net Company Profile |
SEC |
Zacks Reports |
StockTalk |
News |
Chart |
Request a new note
C
A N
S L
I M
|
TSCO
-
NASDAQ
Tractor Supply Co
SPECIALTY RETAIL - Specialty Retail, Other
|
$80.49
|
+0.50
0.63% |
$81.30
|
534,040
75.98% of 50 DAV
50 DAV is 702,900
|
$81.98
-1.82%
|
1/12/2012
|
$79.12
|
PP = $75.58
|
|
MB = $79.36
|
Most Recent Note - 1/19/2012 5:42:51 PM
G - After hitting a new all-time high today it reversed into the red for a loss on above average volume, raising concerns. Prior highs in the mid-$70s which were a resistance area now define initial support to watch on pullbacks.
>>> The latest Featured Stock Update with an annotated graph appeared on 1/12/2012. Click here.
View all notes |
Alert me of new notes |
CANSLIM.net Company Profile |
SEC |
Zacks Reports |
StockTalk |
News |
Chart |
Request a new note
C
A N
S L
I M
|
ULTA
-
NASDAQ
Ulta Salon Cosm & Frag
SPECIALTY RETAIL - Specialty Retail, Other
|
$76.90
|
+0.64
0.84% |
$77.75
|
694,051
73.73% of 50 DAV
50 DAV is 941,300
|
$77.83
-1.19%
|
1/11/2012
|
$71.97
|
PP = $75.80
|
|
MB = $79.59
|
Most Recent Note - 1/19/2012 5:43:44 PM
Y - Posted an 8th consecutive gain on near or below average volume and hit another new all-time high today, wedging up from a riskier late-stage base without sufficient volume to trigger a proper technical buy signal. Prior lows near $64 define important chart support above its 200 DMA line.
>>> The latest Featured Stock Update with an annotated graph appeared on 1/11/2012. Click here.
View all notes |
Alert me of new notes |
CANSLIM.net Company Profile |
SEC |
Zacks Reports |
StockTalk |
News |
Chart |
Request a new note
C
A N
S L
I M
|
V
-
NYSE
Visa Inc Cl A
DIVERSIFIED SERVICES - Business/Management Services
|
$99.60
|
-0.98
-0.97% |
$100.89
|
4,041,156
105.73% of 50 DAV
50 DAV is 3,822,000
|
$104.20
-4.41%
|
10/24/2011
|
$94.21
|
PP = $94.85
|
|
MB = $99.59
|
Most Recent Note - 1/19/2012 5:46:35 PM
G - Reversed into the red for a loss today with slightly higher (near average) volume than the prior session after touching another new all-time high. No overhead supply remains to act as resistance. Its recent low ($98.33 on 1/11/12) and its 50 DMA line define chart support to watch on pullbacks.
>>> The latest Featured Stock Update with an annotated graph appeared on 1/23/2012. Click here.
View all notes |
Alert me of new notes |
CANSLIM.net Company Profile |
SEC |
Zacks Reports |
StockTalk |
News |
Chart |
Request a new note
C
A N
S L
I M
|
|
|
|
THESE ARE NOT BUY RECOMMENDATIONS!
Comments contained in the body of this report are technical
opinions only. The material herein has been obtained
from sources believed to be reliable and accurate, however,
its accuracy and completeness cannot be guaranteed.
This site is not an investment advisor, hence it does
not endorse or recommend any securities or other investments.
Any recommendation contained in this report may not
be suitable for all investors and it is not to be deemed
an offer or solicitation on our part with respect to
the purchase or sale of any securities. All trademarks,
service marks and trade names appearing in this report
are the property of their respective owners, and are
likewise used for identification purposes only.
This report is a service available
only to active Paid Premium Members.
You may opt-out of receiving report notifications
at any time. Questions or comments may be submitted
by writing to Premium Membership Services 665 S.E. 10 Street, Suite 201 Deerfield Beach, FL 33441-5634 or by calling 1-800-965-8307
or 954-785-1121.
|
|
|

