You are not logged in.
This means you
CAN ONLY VIEW reports that were published prior to Monday, April 14, 2025.
You
MUST UPGRADE YOUR MEMBERSHIP if you want to see any current reports.
AFTER MARKET UPDATE - TUESDAY, JANUARY 19TH, 2010
Previous After Market Report Next After Market Report >>>
|
|
|
|
DOW |
+115.78 |
10,725.43 |
+1.09% |
|
Volume |
1,035,796,270 |
-26% |
|
Volume |
2,102,885,710 |
-22% |
|
NASDAQ |
+32.41 |
2,320.40 |
+1.42% |
|
Advancers |
2,392 |
76% |
|
Advancers |
1,911 |
67% |
|
S&P 500 |
+14.20 |
1,150.23 |
+1.25% |
|
Decliners |
685 |
22% |
|
Decliners |
838 |
29% |
|
Russell 2000 |
+11.19 |
649.15 |
+1.75% |
|
52 Wk Highs |
316 |
|
|
52 Wk Highs |
149 |
|
|
S&P 600 |
+5.45 |
343.99 |
+1.61% |
|
52 Wk Lows |
6 |
|
|
52 Wk Lows |
4 |
|
|
 |
Major Averages Resume Rally Following Holiday Weekend
Adam Sarhan, Contributing Writer,
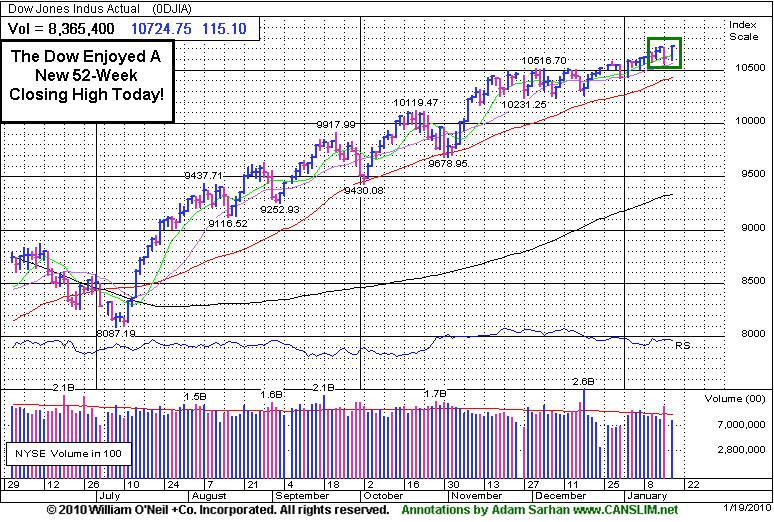
The major averages jumped on Tuesday as traders returned from a long holiday weekend. As expected, volume was reported lower than Friday's heavy options expiration levels on the NYSE and on the Nasdaq exchange. The lower volume rally suggested that large institutions were not aggressively buying stocks. Advancers trumped decliners by over a 3-to-1 ratio on the NYSE and by over a 2-to-1 ratio on the Nasdaq exchange. There were 26 high-ranked companies from the CANSLIM.net Leaders List that made a new 52-week high and appeared on the CANSLIM.net BreakOuts Page, higher than the total of 15 issues that appeared on the prior session. New 52-week highs still solidly outnumbered new 52-week lows on the NYSE and on the Nasdaq exchange.
In recent months we have seen stocks jump on the first trading day of the week before the bulls get tired and stocks fade in the latter half. On Tuesday, healthcare companies were among the biggest gainers as US Democrats face the possibility of losing a Senate seat held by the late Edward Kennedy as voters go to the polls in Massachusetts. If the Democrats lose the election, it could cost them a 60-vote super-majority needed to help pass President Barack Obama's massive health-care package.
Companies continue reporting earnings in droves this week as there will be approximately 65 companies in the S&P 500 that are slated to release earnings by Friday. So far, earnings have been strong but the major averages have barely budged. Analysts believe that earnings surged +67% in the fourth quarter which would snap a record nine quarter losing streak. Remember that since the March low, the benchmark S&P 500 is up +70% which is the single largest stock market rally since the Great Depression! The robust rally sent the index’s price-earnings multiple (a.k.a P/E Ratio) to 25 last week, up from 10.1 in March 2009 which was the lowest reading in a quarter century.
For the most part, the major averages and leading stocks are acting well as investors continue to digest the slew of economic and earnings data being released each day. Until a clear picture can be formed as to how companies fared last quarter, one could easily expect to see more of this sideways action to continue. The market just began its 46th week since the March lows and the rally remains intact as long as the major averages continue trading above their respective 50-day moving average (DMA) lines.
Professional Money Management Services - A Winning System - Inquire today!
Our skilled team of portfolio managers knows how to follow the rules of this fact-based investment system. We do not follow opinion or the "conviction list" of some large Wall Street institution which would have us fully invested even during horrific bear markets. Instead, we remain fluid and only buy the best stocks when they are triggering proper technical buy signals. If you are not completely satisfied with the way your portfolio is being managed, Click here to submit your inquiry. *Accounts over $250,000 please. ** Serious inquires only, please.
PICTURED: The Dow Jones Industrial Average enjoyed a new 52-week high closing high with a triple digit gain.
|
|
|
 |
Healthcare Group Among Strong Gainers
Kenneth J. Gruneisen - Passed the CAN SLIM® Master's Exam
Commodity-linked areas posted gains as the Integrated Oil Index ($XOI +1.14%), Oil Services Index ($OSX +1.30%) and Gold & Silver Index ($XAU +0.65%) rallied. Gains from the influential Bank Index ($BKX +1.03%), Broker/Dealer Index ($XBD +0.78%), and Retail Index ($RLX +0.86%) helped underpin the major averages' advance. The tech sector posted unanimous gains as the Semiconductor Index ($SOX +1.79%), Biotechnology Index ($BTK +1.54%), Networking Index ($NWX +1.36%), and Internet Index ($IIX +0.91%). The Healthcare Index ($HMO +2.29%) group also posted a solid gain, rounding out a widely positive session.
Charts courtesy www.stockcharts.com
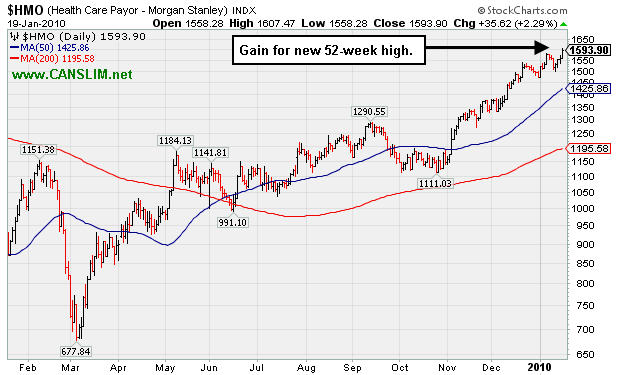
PICTURED: The Healthcare Index ($HMO +2.29%) group posted a gain for a new 52-week high.
| Oil Services |
$OSX |
213.52 |
+2.74 |
+1.30% |
+9.54% |
| Healthcare |
$HMO |
1,593.90 |
+35.62 |
+2.29% |
+8.21% |
| Integrated Oil |
$XOI |
1,104.27 |
+12.47 |
+1.14% |
+3.38% |
| Semiconductor |
$SOX |
350.84 |
+6.17 |
+1.79% |
-2.52% |
| Networking |
$NWX |
241.76 |
+3.25 |
+1.36% |
+4.63% |
| Internet |
$IIX |
235.66 |
+2.13 |
+0.91% |
+0.77% |
| Broker/Dealer |
$XBD |
118.85 |
+0.92 |
+0.78% |
+3.30% |
| Retail |
$RLX |
411.82 |
+3.52 |
+0.86% |
+0.17% |
| Gold & Silver |
$XAU |
173.90 |
+1.12 |
+0.65% |
+3.36% |
| Bank |
$BKX |
47.16 |
+0.48 |
+1.03% |
+10.42% |
| Biotech |
$BTK |
996.69 |
+15.11 |
+1.54% |
+5.79% |
|
|
|
 |
Repairing Recent Technical Damage
Kenneth J. Gruneisen - Passed the CAN SLIM® Master's Exam
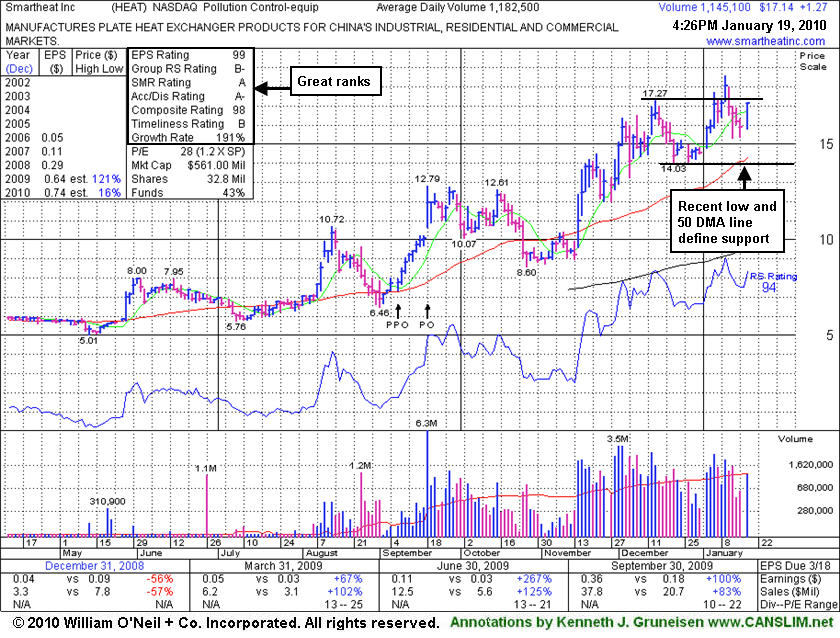
Smartheat Inc. (HEAT +$1.27 or +8.00% to $17.14) posted a solid gain today with average volume, helping repair recent technical damage. It rallied to its third highest close ever. It is currently consolidating well above prior chart lows and its 50-day moving average (DMA) line coinciding in the $14.00 area as important support levels. Its latest breakout from a short "ascending base" type pattern was noted, however distributional action last week promptly negated its bullish 1/12/10 gain as it slumped back into its prior base. The weak action suggested that profit taking pressure was to blame. After getting off to a strong start, HEAT traded as much as +55.0% higher in the more than 8 week period since first featured in yellow in the 11/17/09 mid-day report (read here). While it could make a stand and go on rallying, time is needed to allow for a sound new base to form.
The number of top-rated funds owning an interest in its shares rose from 3 in Jun '09 to 26 in Dec '09, which is reassuring concerning the I criteria. The 3 latest quarters show sales revenues and earnings increases well above the +25% guideline, satisfying the C criteria. There is limited history for this small Chinese firm in the Pollution Control - Equipment group, however its reported annual earnings (A criteria) history has been strong.
|
|
|
Color Codes Explained :
Y - Better candidates highlighted by our
staff of experts.
G - Previously featured
in past reports as yellow but may no longer be buyable under the
guidelines.
***Last / Change / Volume quote data in this table corresponds with the timestamp on the note***
Symbol/Exchange
Company Name
Industry Group |
Last |
Chg. |
Vol
% DAV |
Date Featured |
Price Featured |
Latest Pivot Point
Featured |
Status |
| Latest Max Buy Price |
ARST
-
|
$27.35
|
+0.62
|
164,753
32% DAV
521,900
|
12/22/2009
(Date
Featured) |
$25.94
(Price
Featured) |
PP = $27.20 |
G |
| MB = $28.56 |
Most Recent Note - 1/19/2010 4:07:16 PM
G - Gain today on very light volume while quietly consolidating above its 50 DMA line after last week's worrisome bout of distributional pressure. ARST was first featured in yellow at $19.91 in the 9/01/09 mid-day report with an annotated daily graph (read here).
>>> The latest Featured Stock Update with an annotated graph appeared on 1/4/2010. click here.
|
|
C
A
S
I |
News |
Chart |
SEC
View all notes Alert
me of new notes
Company
Profile
|
ASIA
-
|
$28.61
|
-0.19
|
663,657
54% DAV
1,238,400
|
12/24/2009
(Date
Featured) |
$31.05
(Price
Featured) |
PP = $32.40 |
G |
| MB = $34.02 |
Most Recent Note - 1/19/2010 4:08:56 PM
G - Loss today on average volume, still testing support at its 50-day moving average (DMA) line. Traded up as much as +68.13% since first featured in the August 2009 CANSLIM.net News (read here).
>>> The latest Featured Stock Update with an annotated graph appeared on 1/12/2010. click here.
|
|
C
A
S
I |
News |
Chart |
SEC
View all notes Alert
me of new notes
Company
Profile
|
BIDU
- NASDAQ
Baidu Inc Ads
INTERNET - Internet Information Providers
|
$434.02
|
-33.66
|
3,675,985
206% DAV
1,784,600
|
1/13/2010
(Date
Featured) |
$431.25
(Price
Featured) |
PP = $426.75 |
Y |
| MB = $448.09 |
Most Recent Note - 1/19/2010 4:12:14 PM
Y - Gapped down today, suffering a considerable loss on above average volume while finishing under its November '08 high closes. Consolidating under its "max buy" level, its color code was changed to yellow. Prior chart highs and its 50 DMA line define an important technical support level to watch. BIDU was featured in yellow on 1/13/10 as it cleared the 12/29/09 high (view all notes).
>>> The latest Featured Stock Update with an annotated graph appeared on 1/14/2010. click here.
|
|
C
A
S
I |
News |
Chart |
SEC
View all notes Alert
me of new notes
Company
Profile
|
CAAS
- NASDAQ
China Automotive Systems
AUTOMOTIVE - Auto Parts
|
$21.43
|
+0.40
|
987,780
89% DAV
1,104,800
|
11/30/2009
(Date
Featured) |
$18.84
(Price
Featured) |
PP = $17.62 |
G |
| MB = $18.50 |
Most Recent Note - 1/19/2010 4:17:43 PM
G - Positively reversed today for a gain on lighter but still above-average volume after another gap down. It found support and closed back above its December high closes after encountering heavy distributional pressure. CAAS was actually rather late-stage at $18.84 when first featured in the 11/30/09 mid-day report (read here).
>>> The latest Featured Stock Update with an annotated graph appeared on 1/15/2010. click here.
|
|
C
A
S
I |
News |
Chart |
SEC
View all notes Alert
me of new notes
Company
Profile
|
CACC
- NASDAQ
Credit Acceptance Corp
FINANCIAL SERVICES - Credit Services
|
$48.35
|
+0.93
|
16,162
36% DAV
45,400
|
9/29/2009
(Date
Featured) |
$33.48
(Price
Featured) |
PP = $37.10 |
G |
| MB = $38.96 |
Most Recent Note - 1/19/2010 4:19:18 PM
G - Gain today for a new high close after stubbornly holding its ground near all-time highs, extended from any sound base. Previous chart high and 50 DMA line coincide in the $37 area, defining an important support level to watch.
>>> The latest Featured Stock Update with an annotated graph appeared on 1/8/2010. click here.
|
|
C
A
S
I |
News |
Chart |
SEC
View all notes Alert
me of new notes
Company
Profile
|
CRM
- NYSE
Salesforce.com Inc
INTERNET - Internet Software & Services
|
$69.56
|
+0.93
|
772,101
41% DAV
1,887,100
|
12/18/2009
(Date
Featured) |
$67.32
(Price
Featured) |
PP = $67.82 |
G |
| MB = $71.21 |
Most Recent Note - 1/19/2010 4:22:11 PM
G - Positively reversed after a gap down today, holding its ground above important chart support previously noted at prior chart highs and its 50 DMA line. A damaging technical gap down on 1/12/10 was indicative of institutional (I criteria) distribution.
>>> The latest Featured Stock Update with an annotated graph appeared on 1/6/2010. click here.
|
|
C
A
S
I |
News |
Chart |
SEC
View all notes Alert
me of new notes
Company
Profile
|
CTRP
- NASDAQ
Ctrip.com Intl Ltd Adr
LEISURE - Resorts & Casinos
|
$72.98
|
+0.23
|
617,347
59% DAV
1,051,800
|
1/14/2010
(Date
Featured) |
$73.34
(Price
Featured) |
PP = $78.70 |
Y |
| MB = $82.64 |
Most Recent Note - 1/19/2010 4:23:06 PM
Y - Small gain today on light volume while consolidating above important support at its 50 DMA line. Color code was changed to yellow based on its resilience, with a new pivot point noted based on its current flat base pattern.
>>> The latest Featured Stock Update with an annotated graph appeared on 12/30/2009. click here.
|
|
C
A
S
I |
News |
Chart |
SEC
View all notes Alert
me of new notes
Company
Profile
|
GMCR
- NASDAQ
Green Mtn Coffee Roastrs
FOOD & BEVERAGE - Processed & Packaged Goods
|
$82.90
|
+2.49
|
1,427,890
88% DAV
1,621,400
|
12/28/2009
(Date
Featured) |
$77.49
(Price
Featured) |
PP = $76.50 |
G |
| MB = $80.33 |
Most Recent Note - 1/19/2010 4:25:05 PM
G - Consolidating above prior high closes in the $76-77 area defining an important support level to watch.
>>> The latest Featured Stock Update with an annotated graph appeared on 1/13/2010. click here.
|
|
C
A
S
I |
News |
Chart |
SEC
View all notes Alert
me of new notes
Company
Profile
|
HEAT
-
|
$17.14
|
+1.27
|
1,145,197
97% DAV
1,182,500
|
1/6/2010
(Date
Featured) |
$17.19
(Price
Featured) |
PP = $17.27 |
G |
| MB = $18.13 |
Most Recent Note - 1/19/2010 4:31:57 PM
G - Gain today with average volume helped repair recent technical damage as it rallied to its third highest close ever. Recent chart lows near $14 define the next important support level.
>>> The latest Featured Stock Update with an annotated graph appeared on 1/19/2010. click here.
|
|
C
A
S
I |
News |
Chart |
SEC
View all notes Alert
me of new notes
Company
Profile
|
LFT
-
|
$38.54
|
+0.39
|
675,745
160% DAV
421,100
|
11/17/2009
(Date
Featured) |
$31.77
(Price
Featured) |
PP = $33.04 |
G |
| MB = $34.69 |
Most Recent Note - 1/19/2010 4:33:52 PM
G - Held its ground with a gain on above average volume today. Losses last week with above average volume indicated worrisome distributional pressure. Its 50 DMA line near $35 has been previously noted as an initial support level to watch on pullbacks. Its fundamentals remain strong.
>>> The latest Featured Stock Update with an annotated graph appeared on 1/5/2010. click here.
|
|
C
A
S
I |
News |
Chart |
SEC
View all notes Alert
me of new notes
Company
Profile
|
PEGA
- NASDAQ
Pegasystems Inc
COMPUTER SOFTWARE & SERVICES - Business Software & Services
|
$35.01
|
+0.72
|
100,786
48% DAV
212,100
|
1/4/2010
(Date
Featured) |
$34.00
(Price
Featured) |
PP = $36.19 |
Y |
| MB = $38.00 |
Most Recent Note - 1/19/2010 4:34:53 PM
Y - Quiet volume behind its gain today left it perched near all-time highs with no resistance remaining due to overhead supply. Featured in the January 2010 issue of CANSLIM.net News (read here).
>>> The latest Featured Stock Update with an annotated graph appeared on 1/3/2010. click here.
|
|
C
A
S
I |
News |
Chart |
SEC
View all notes Alert
me of new notes
Company
Profile
|
VIT
-
|
$20.39
|
+1.04
|
469,341
84% DAV
560,100
|
12/24/2009
(Date
Featured) |
$20.07
(Price
Featured) |
PP = $21.17 |
Y |
| MB = $22.23 |
Most Recent Note - 1/19/2010 4:36:50 PM
Y - Overcame early weakness today and posted a gain on lighter volume. Distributional pressure in the past week raised concerns as it abruptly reversed under its pivot point following its big 1/06/10 gain on heavy volume and 1/11/10 gain on +36% above average volume.
>>> The latest Featured Stock Update with an annotated graph appeared on 1/11/2010. click here.
|
|
C
A
S
I |
News |
Chart |
SEC
View all notes Alert
me of new notes
Company
Profile
|
|
|
|
THESE ARE NOT BUY RECOMMENDATIONS!
Comments contained in the body of this report are technical
opinions only. The material herein has been obtained
from sources believed to be reliable and accurate, however,
its accuracy and completeness cannot be guaranteed.
This site is not an investment advisor, hence it does
not endorse or recommend any securities or other investments.
Any recommendation contained in this report may not
be suitable for all investors and it is not to be deemed
an offer or solicitation on our part with respect to
the purchase or sale of any securities. All trademarks,
service marks and trade names appearing in this report
are the property of their respective owners, and are
likewise used for identification purposes only.
This report is a service available
only to active Paid Premium Members.
You may opt-out of receiving report notifications
at any time. Questions or comments may be submitted
by writing to Premium Membership Services 665 S.E. 10 Street, Suite 201 Deerfield Beach, FL 33441-5634 or by calling 1-800-965-8307
or 954-785-1121.
|
|
|


