Symbol/Exchange
Company Name
Industry Group |
PRICE |
CHANGE
(%Change) |
Day High |
Volume
(% DAV)
(% 50 day avg vol) |
52 Wk Hi
% From Hi |
Featured
Date |
Price
Featured |
Pivot Featured |
|
Max Buy |
ABV
-
NYSE
Comp De Bebidas Adr
FOOD and BEVERAGE - Beverages - Brewers
|
$27.76
|
-0.32
-1.14% |
$28.47
|
8,028,935
305.64% of 50 DAV
50 DAV is 2,626,900
|
$32.00
-13.25%
|
12/10/2010
|
$27.97
|
PP = $29.09
|
|
MB = $30.54
|
 Most Recent Note - 1/18/2011 4:11:53 PM
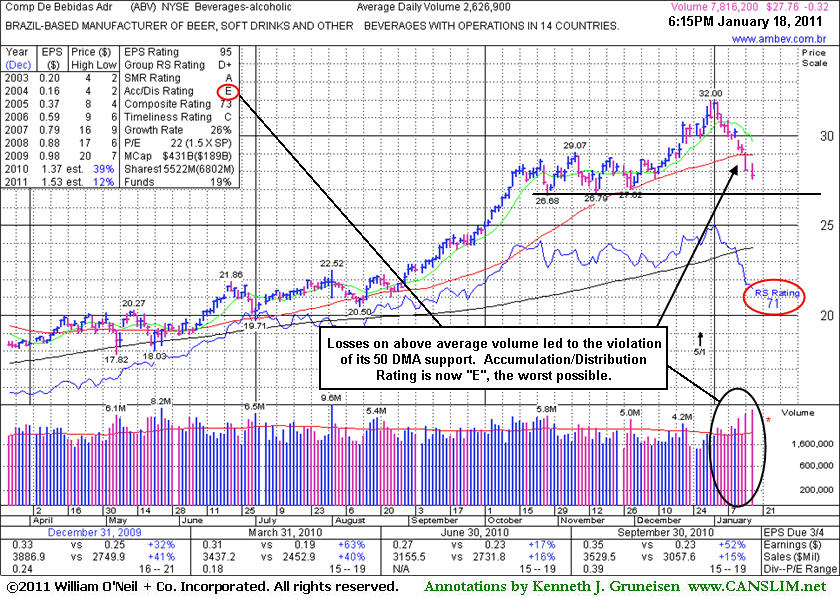
G - Down again today with above average volume, closing -13.2% off its 52-week high while slumping near October-December lows in the $27 area that may act as support. Waning Relative Strength is a concern. Last week it violated prior highs in the $29 area and its 50 DMA line with a damaging loss on heavy volume triggering technical sell signals.
>>> The latest Featured Stock Update with an annotated graph appeared on 1/18/2011. Click here.
View all notes |
Alert me of new notes |
CANSLIM.net Company Profile |
SEC |
Zacks Reports |
StockTalk |
News |
Chart |
Request a new note
C
A N
S L
I M


|
ARUN
-
NASDAQ
Aruba Networks Inc
COMPUTER HARDWARE - Networking andamp; Communication Dev
|
$25.97
|
+0.29
1.13% |
$26.00
|
1,851,309
74.46% of 50 DAV
50 DAV is 2,486,300
|
$25.96
0.05%
|
1/3/2011
|
$22.55
|
PP = $24.38
|
|
MB = $25.60
|
Most Recent Note - 1/18/2011 4:12:53 PM
G - Inched to another new high today with a light volume gain. Color code was changed to green after rallying last week to new all-time highs and closing above its "max buy" level. Prior highs in the $23-24 area define initial support above its 50 DMA line.
>>> The latest Featured Stock Update with an annotated graph appeared on 12/14/2010. Click here.
View all notes |
Alert me of new notes |
CANSLIM.net Company Profile |
SEC |
Zacks Reports |
StockTalk |
News |
Chart |
Request a new note
C
A N
S L
I M
|
CACC
-
NASDAQ
Credit Acceptance Corp
FINANCIAL SERVICES - Credit Services
|
$56.67
|
-1.70
-2.91% |
$58.31
|
32,574
134.60% of 50 DAV
50 DAV is 24,200
|
$64.09
-11.58%
|
11/22/2010
|
$59.97
|
PP = $62.00
|
|
MB = $65.10
|
Most Recent Note - 1/18/2011 4:14:16 PM
G - Considerable loss today, slumping toward its 200 DMA line and prior lows near $54-55, raising greater concerns. Based on its weakness and waning Relative Strength (RS rank is 61 now) it will be dropped from the Featured Stocks list tonight.
>>> The latest Featured Stock Update with an annotated graph appeared on 12/20/2010. Click here.
View all notes |
Alert me of new notes |
CANSLIM.net Company Profile |
SEC |
Zacks Reports |
StockTalk |
News |
Chart |
Request a new note
C
A N
S L
I M
|
CIS
-
NYSE
Camelot Info Systems Ads
COMPUTER SOFTWARE andamp; SERVICES - Information Technology Service
|
$25.40
|
-0.27
-1.05% |
$26.68
|
569,096
122.12% of 50 DAV
50 DAV is 466,000
|
$28.18
-9.87%
|
11/26/2010
|
$18.93
|
PP = $19.72
|
|
MB = $20.71
|
Most Recent Note - 1/18/2011 4:16:03 PM
G - Negative reversal today while consolidating above support at prior highs near $25 following its recent rally from a choppy 5-week consolidation.
>>> The latest Featured Stock Update with an annotated graph appeared on 1/11/2011. Click here.
View all notes |
Alert me of new notes |
CANSLIM.net Company Profile |
SEC |
Zacks Reports |
StockTalk |
News |
Chart |
Request a new note
C
A N
S L
I M
|
DECK
-
NASDAQ
Deckers Outdoor Corp
CONSUMER NON-DURABLES - Textile - Apparel Footwear
|
$80.03
|
-1.70
-2.08% |
$82.36
|
1,520,015
77.09% of 50 DAV
50 DAV is 1,971,700
|
$87.88
-8.93%
|
10/27/2010
|
$54.16
|
PP = $54.86
|
|
MB = $57.60
|
Most Recent Note - 1/18/2011 4:17:55 PM
G - Quietly consolidating near its 10-week moving average line for the first time after its late-October technical breakout. It may be considered a valid secondary buy point from its current level on up to 5% above the prior high ($87.88 plus 5%), however there are concerns after the +24% earnings increase for the Sept quarter was a hair below the minimum guideline. Any subsequent violation of its 50 DMA line would raise concerns and trigger a technical sell signal.
>>> The latest Featured Stock Update with an annotated graph appeared on 12/16/2010. Click here.
View all notes |
Alert me of new notes |
CANSLIM.net Company Profile |
SEC |
Zacks Reports |
StockTalk |
News |
Chart |
Request a new note
C
A N
S L
I M
|
Symbol/Exchange
Company Name
Industry Group |
PRICE |
CHANGE
(%Change) |
Day High |
Volume
(% DAV)
(% 50 day avg vol) |
52 Wk Hi
% From Hi |
Featured
Date |
Price
Featured |
Pivot Featured |
|
Max Buy |
EZCH
-
NASDAQ
Ezchip Semiconductor Ltd
ELECTRONICS - Semiconductor - Specialized
|
$32.46
|
+0.36
1.12% |
$33.20
|
610,550
225.38% of 50 DAV
50 DAV is 270,900
|
$32.25
0.65%
|
12/2/2010
|
$27.53
|
PP = $26.00
|
|
MB = $27.30
|
Most Recent Note - 1/18/2011 4:20:19 PM
G - Small gain today for another new 52-week high, but it closed in the lower third of its intra-day range. It is extended from a sound base after adding to a recent cluster of gains backed by above average volume.Prior chart highs in the $29 area define initial support to watch well above its 50 DMA line.
>>> The latest Featured Stock Update with an annotated graph appeared on 12/2/2010. Click here.
View all notes |
Alert me of new notes |
CANSLIM.net Company Profile |
SEC |
Zacks Reports |
StockTalk |
News |
Chart |
Request a new note
C
A N
S L
I M
|
EZPW
-
NASDAQ
Ezcorp Inc Cl A
SPECIALTY RETAIL - Specialty Retail, Other
|
$29.39
|
-0.24
-0.81% |
$29.93
|
603,686
156.35% of 50 DAV
50 DAV is 386,100
|
$29.94
-1.84%
|
11/5/2010
|
$24.02
|
PP = $23.85
|
|
MB = $25.04
|
Most Recent Note - 1/18/2011 4:21:01 PM
G - Held its ground near its all-time high today. Recent low and its 50 DMA line near $27 coincide to define an important chart support level to watch.
>>> The latest Featured Stock Update with an annotated graph appeared on 12/29/2010. Click here.
View all notes |
Alert me of new notes |
CANSLIM.net Company Profile |
SEC |
Zacks Reports |
StockTalk |
News |
Chart |
Request a new note
C
A N
S L
I M
|
FFIV
-
NASDAQ
F 5 Networks Inc
INTERNET - Internet Software and Services
|
$141.78
|
-2.39
-1.66% |
$145.73
|
2,875,698
119.13% of 50 DAV
50 DAV is 2,414,000
|
$145.76
-2.73%
|
1/13/2011
|
$145.71
|
PP = $143.85
|
|
MB = $151.04
|
Most Recent Note - 1/18/2011 4:25:56 PM
Y - Small loss today with above average volume is a sign of distributional pressure while failing to distance itself from its prior chart highs after recent gains without great volume conviction. Disciplined investors know that at least +40-50% above average volume is a requirement (preferably more) when a stock rises above its pivot point to trigger a proper technical buy signal. Color code was changed to yellow with new pivot point cited based on its 12/13/10 high plus 10 cents after a short and orderly 5-week flat base.
>>> The latest Featured Stock Update with an annotated graph appeared on 12/28/2010. Click here.
View all notes |
Alert me of new notes |
CANSLIM.net Company Profile |
SEC |
Zacks Reports |
StockTalk |
News |
Chart |
Request a new note
C
A N
S L
I M
|
FOSL
-
NASDAQ
Fossil Inc
CONSUMER DURABLES - Recreational Goods, Other
|
$70.16
|
-0.13
-0.18% |
$70.85
|
623,238
76.95% of 50 DAV
50 DAV is 809,900
|
$74.34
-5.62%
|
11/26/2010
|
$69.10
|
PP = $70.17
|
|
MB = $73.68
|
Most Recent Note - 1/18/2011 4:27:22 PM
G - Consolidating near its 50 DMA line. Color code was changed to green due to its recent deterioration and general lack of progress since its 12/02/10 breakout from a "3-weeks tight" pattern. Now perched near an upward trendline connecting its July - October lows, and any further deterioration may trigger a more worrisome technical sell signal.
>>> The latest Featured Stock Update with an annotated graph appeared on 1/12/2011. Click here.
View all notes |
Alert me of new notes |
CANSLIM.net Company Profile |
SEC |
Zacks Reports |
StockTalk |
News |
Chart |
Request a new note
C
A N
S L
I M
|
HMSY
-
NASDAQ
H M S Holdings Corp
COMPUTER SOFTWARE and SERVICES - Healthcare Information Service
|
$66.99
|
+0.33
0.50% |
$67.05
|
115,946
73.43% of 50 DAV
50 DAV is 157,900
|
$67.10
-0.16%
|
11/19/2010
|
$61.89
|
PP = $63.01
|
|
MB = $66.16
|
Most Recent Note - 1/18/2011 4:29:55 PM
G - Rallied today with below above average volume for yet another new high close. It built a base-on-base type pattern and found support at its 50 DMA line, while its waning Relative Strength rank (now 68) has been noted as a concern.
>>> The latest Featured Stock Update with an annotated graph appeared on 1/3/2011. Click here.
View all notes |
Alert me of new notes |
CANSLIM.net Company Profile |
SEC |
Zacks Reports |
StockTalk |
News |
Chart |
Request a new note
C
A N
S L
I M
|
Symbol/Exchange
Company Name
Industry Group |
PRICE |
CHANGE
(%Change) |
Day High |
Volume
(% DAV)
(% 50 day avg vol) |
52 Wk Hi
% From Hi |
Featured
Date |
Price
Featured |
Pivot Featured |
|
Max Buy |
JOBS
-
NASDAQ
Fifty One Job Inc Ads
DIVERSIFIED SERVICES - Staffing and; Outsourcing Service
|
$60.22
|
+2.29
3.95% |
$60.30
|
253,134
146.74% of 50 DAV
50 DAV is 172,500
|
$60.00
0.37%
|
10/13/2010
|
$42.07
|
PP = $40.60
|
|
MB = $42.63
|
Most Recent Note - 1/18/2011 4:32:05 PM
G - Posted a solid gain today with above average volume for a new all-time high. It had not formed a sound new base, only having recently consolidated for just 4 weeks after a considerable rally from below $20 in July.
>>> The latest Featured Stock Update with an annotated graph appeared on 12/30/2010. Click here.
View all notes |
Alert me of new notes |
CANSLIM.net Company Profile |
SEC |
Zacks Reports |
StockTalk |
News |
Chart |
Request a new note
C
A N
S L
I M
|
LULU
-
NASDAQ
Lululemon Athletica
MANUFACTURING - Textile Manufacturing
|
$70.97
|
-0.84
-1.17% |
$72.31
|
1,299,583
65.09% of 50 DAV
50 DAV is 1,996,600
|
$74.60
-4.87%
|
10/8/2010
|
$47.66
|
PP = $46.67
|
|
MB = $49.00
|
Most Recent Note - 1/18/2011 4:55:33 PM
G - Perched -4.9% from its all-time high with volume cooling since its considerable gap up gain on 1/12/11 with more than 3 times average volume. It did not form a sound new base and it is extended from its 50 DMA line.
>>> The latest Featured Stock Update with an annotated graph appeared on 1/14/2011. Click here.
View all notes |
Alert me of new notes |
CANSLIM.net Company Profile |
SEC |
Zacks Reports |
StockTalk |
News |
Chart |
Request a new note
C
A N
S L
I M
|
MWIV
-
NASDAQ
M W I Veterinary Supply
HEALTH SERVICES - Medical Instruments and; Supplies
|
$66.08
|
+0.15
0.23% |
$66.75
|
44,156
84.59% of 50 DAV
50 DAV is 52,200
|
$67.13
-1.56%
|
11/4/2010
|
$61.79
|
PP = $59.60
|
|
MB = $62.58
|
Most Recent Note - 1/18/2011 4:56:17 PM
G - Hovering near its all-time high after inching to new highs without great volume conviction. It has not formed a sound base pattern. Its 50 DMA line defines support to watch.
>>> The latest Featured Stock Update with an annotated graph appeared on 12/21/2010. Click here.
View all notes |
Alert me of new notes |
CANSLIM.net Company Profile |
SEC |
Zacks Reports |
StockTalk |
News |
Chart |
Request a new note
C
A N
S L
I M
|
NEOG
-
NASDAQ
Neogen Corp
DRUGS - Diagnostic Substances
|
$39.75
|
-0.22
-0.55% |
$40.46
|
70,320
69.21% of 50 DAV
50 DAV is 101,600
|
$43.14
-7.86%
|
9/1/2010
|
$30.79
|
PP = $30.49
|
|
MB = $32.01
|
Most Recent Note - 1/18/2011 4:57:14 PM
G - Hovering just above its 50 DMA line which has been a reliable support level during past consolidations.
>>> The latest Featured Stock Update with an annotated graph appeared on 12/6/2010. Click here.
View all notes |
Alert me of new notes |
CANSLIM.net Company Profile |
SEC |
Zacks Reports |
StockTalk |
News |
Chart |
Request a new note
C
A N
S L
I M
|
NFLX
-
NASDAQ
Netflix Inc
SPECIALTY RETAIL - Music and Video Stores
|
$193.68
|
+2.20
1.15% |
$194.84
|
2,654,327
47.43% of 50 DAV
50 DAV is 5,596,200
|
$206.80
-6.34%
|
1/10/2011
|
$187.88
|
PP = $209.34
|
|
MB = $219.81
|
Most Recent Note - 1/18/2011 4:58:40 PM
Y - Perched above its 50 DMA line just -7.4% off its 52-week high. Color code was changed to yellow with new pivot point cited based on its 52-week high plus ten cents.
>>> The latest Featured Stock Update with an annotated graph appeared on 1/10/2011. Click here.
View all notes |
Alert me of new notes |
CANSLIM.net Company Profile |
SEC |
Zacks Reports |
StockTalk |
News |
Chart |
Request a new note
C
A N
S L
I M
|
Symbol/Exchange
Company Name
Industry Group |
PRICE |
CHANGE
(%Change) |
Day High |
Volume
(% DAV)
(% 50 day avg vol) |
52 Wk Hi
% From Hi |
Featured
Date |
Price
Featured |
Pivot Featured |
|
Max Buy |
NTAP
-
NASDAQ
Netapp Inc
COMPUTER HARDWARE - Data Storage Devices
|
$58.99
|
-0.49
-0.82% |
$59.79
|
2,592,638
45.47% of 50 DAV
50 DAV is 5,701,900
|
$59.71
-1.21%
|
1/6/2011
|
$57.49
|
PP = $58.06
|
|
MB = $60.96
|
Most Recent Note - 1/18/2011 4:59:54 PM
Y - Perched at its 52-week high after quietly inching above its pivot point for new highs last week. Color code was changed to yellow with new pivot point cited based on its 11/10/10 high plus 10 cents. Gains with +50% above average volume, ideally even greater volume, are needed behind a gain above its pivot point to trigger a convincing technical buy signal.
>>> The latest Featured Stock Update with an annotated graph appeared on 12/27/2010. Click here.
View all notes |
Alert me of new notes |
CANSLIM.net Company Profile |
SEC |
Zacks Reports |
StockTalk |
News |
Chart |
Request a new note
C
A N
S L
I M
|
OPEN
-
NASDAQ
Opentable Inc
INTERNET - Internet Software and Services
|
$79.45
|
-0.65
-0.81% |
$80.62
|
486,742
61.22% of 50 DAV
50 DAV is 795,100
|
$82.70
-3.92%
|
1/5/2011
|
$74.05
|
PP = $76.79
|
|
MB = $80.63
|
Most Recent Note - 1/18/2011 5:02:04 PM
Y - Holding its ground stubbornly near its 52-week high with volume totals cooling after a streak of volume-driven gains last week triggered a technical buy signal. Color code was changed to yellow after quietly consolidating below its "max buy" level. Prior highs in the $76 area define initial support to watch above its 50 DMA line.
>>> The latest Featured Stock Update with an annotated graph appeared on 1/5/2011. Click here.
View all notes |
Alert me of new notes |
CANSLIM.net Company Profile |
SEC |
Zacks Reports |
StockTalk |
News |
Chart |
Request a new note
C
A N
S L
I M
|
ORCL
-
NASDAQ
Oracle Corp
COMPUTER SOFTWARE and SERVICES - Application Software
|
$31.53
|
+0.29
0.91% |
$31.55
|
26,975,227
94.41% of 50 DAV
50 DAV is 28,573,600
|
$32.27
-2.29%
|
12/7/2010
|
$29.05
|
PP = $29.92
|
|
MB = $31.42
|
Most Recent Note - 1/18/2011 5:03:37 PM
G - Still consolidating in a tight trading range near its 52-week high, stubbornly holding its ground since its 12/17/10 gap up gain. Support to watch is at prior chart highs and its 50 DMA line just under the $30 level.
>>> The latest Featured Stock Update with an annotated graph appeared on 1/7/2011. Click here.
View all notes |
Alert me of new notes |
CANSLIM.net Company Profile |
SEC |
Zacks Reports |
StockTalk |
News |
Chart |
Request a new note
C
A N
S L
I M
|
PAY
-
NYSE
Verifone Systems Inc
COMPUTER HARDWARE - Transaction Automation Systems
|
$43.80
|
-0.02
-0.05% |
$43.93
|
2,012,361
130.19% of 50 DAV
50 DAV is 1,545,700
|
$44.87
-2.38%
|
11/29/2010
|
$33.96
|
PP = $36.04
|
|
MB = $37.84
|
Most Recent Note - 1/18/2011 5:05:03 PM
G - Churned above average volume today near its 52-week high, extended from any sound base. Recent lows in the $38 area along with its 50 DMA line define important near-term chart support to watch.
>>> The latest Featured Stock Update with an annotated graph appeared on 12/15/2010. Click here.
View all notes |
Alert me of new notes |
CANSLIM.net Company Profile |
SEC |
Zacks Reports |
StockTalk |
News |
Chart |
Request a new note
C
A N
S L
I M
|
PCLN
-
NASDAQ
Priceline.Com Inc
INTERNET - Internet Software and Services
|
$440.91
|
+2.92
0.67% |
$441.50
|
693,386
66.88% of 50 DAV
50 DAV is 1,036,800
|
$443.19
-0.51%
|
11/1/2002
|
$399.55
|
PP = $428.20
|
|
MB = $449.61
|
Most Recent Note - 1/18/2011 5:06:05 PM
Y - Volume totals have been cooling while consolidating in a tight trading range above prior highs in the $426-428 area that may now serve as initial support to watch.
>>> The latest Featured Stock Update with an annotated graph appeared on 1/2/2011. Click here.
View all notes |
Alert me of new notes |
CANSLIM.net Company Profile |
SEC |
Zacks Reports |
StockTalk |
News |
Chart |
Request a new note
C
A N
S L
I M
|
Symbol/Exchange
Company Name
Industry Group |
PRICE |
CHANGE
(%Change) |
Day High |
Volume
(% DAV)
(% 50 day avg vol) |
52 Wk Hi
% From Hi |
Featured
Date |
Price
Featured |
Pivot Featured |
|
Max Buy |
RAX
-
NYSE
Rackspace Hosting Inc
INTERNET - Internet Software and; Services
|
$34.53
|
-0.10
-0.29% |
$35.00
|
1,449,338
85.23% of 50 DAV
50 DAV is 1,700,500
|
$35.00
-1.34%
|
1/10/2011
|
$22.84
|
PP = $32.76
|
|
MB = $34.40
|
Most Recent Note - 1/18/2011 5:08:04 PM
G - Hovering above its previously cited "max buy" level, its color code is changed to green. It held its ground stubbornly after a gap up gain on 1/11/11 with above average volume triggered a new (or add-on) technical buy signal. No resistance remains due to overhead supply.
>>> The latest Featured Stock Update with an annotated graph appeared on 12/31/2010. Click here.
View all notes |
Alert me of new notes |
CANSLIM.net Company Profile |
SEC |
Zacks Reports |
StockTalk |
News |
Chart |
Request a new note
C
A N
S L
I M
|
ROVI
-
NASDAQ
Rovi Corp
COMPUTER SOFTWARE andamp; SERVICES - Security Software andamp; Services
|
$68.85
|
+0.27
0.39% |
$69.40
|
2,222,810
152.26% of 50 DAV
50 DAV is 1,459,900
|
$69.50
-0.94%
|
10/29/2010
|
$49.99
|
PP = $53.10
|
|
MB = $55.76
|
Most Recent Note - 1/18/2011 5:09:26 PM
G - Posted another small gain today with above average volume. It is extended from a sound base, yet unhindered by overhead supply, it may produce more climactic gains. The recent low near $58.50 and its 50 DMA line define chart support levels to watch.
>>> The latest Featured Stock Update with an annotated graph appeared on 12/13/2010. Click here.
View all notes |
Alert me of new notes |
CANSLIM.net Company Profile |
SEC |
Zacks Reports |
StockTalk |
News |
Chart |
Request a new note
C
A N
S L
I M
|
SHOO
-
NASDAQ
Steven Madden Limited
CONSUMER NON-DURABLES - Textile - Apparel Footwear
|
$41.90
|
-0.18
-0.43% |
$42.19
|
228,570
63.76% of 50 DAV
50 DAV is 358,500
|
$47.69
-12.14%
|
11/23/2010
|
$44.61
|
PP = $44.95
|
|
MB = $47.20
|
Most Recent Note - 1/18/2011 5:12:29 PM
G - Consolidating -12% off its 52-week high, perched above previously cited support at prior highs near $40. Meanwhile, more damaging losses would raise serious concerns. Its downward sloping 50 DMA line may now act as resistance.
>>> The latest Featured Stock Update with an annotated graph appeared on 1/4/2011. Click here.
View all notes |
Alert me of new notes |
CANSLIM.net Company Profile |
SEC |
Zacks Reports |
StockTalk |
News |
Chart |
Request a new note
C
A N
S L
I M
|
UA
-
NYSE
Under Armour Inc Cl A
CONSUMER NON-DURABLES - Textile - Apparel Clothing
|
$56.83
|
+0.53
0.94% |
$56.72
|
488,033
74.78% of 50 DAV
50 DAV is 652,600
|
$60.14
-5.50%
|
9/9/2010
|
$39.99
|
PP = $40.10
|
|
MB = $42.11
|
Most Recent Note - 1/18/2011 5:13:25 PM
G - Posted a 4th consecutive gain on light volume today. Working on a possible new base after 6 weeks of consolidation, it rallied with below average volume this week while finding support near its 50 DMA line.
>>> The latest Featured Stock Update with an annotated graph appeared on 12/23/2010. Click here.
View all notes |
Alert me of new notes |
CANSLIM.net Company Profile |
SEC |
Zacks Reports |
StockTalk |
News |
Chart |
Request a new note
C
A N
S L
I M
|
ULTA
-
NASDAQ
Ulta Salon Cosm & Frag
SPECIALTY RETAIL - Specialty Retail, Other
|
$36.45
|
-0.61
-1.65% |
$37.21
|
527,193
93.18% of 50 DAV
50 DAV is 565,800
|
$38.25
-4.71%
|
1/6/2011
|
$36.12
|
PP = $37.34
|
|
MB = $39.21
|
Most Recent Note - 1/18/2011 5:20:05 PM
Y - Loss today with near average volume led to a close just pennies below its 12/01/10 high close, raising some concern while technically negating its recent breakout gain with a close back in its prior base. Subsequent volume-driven gains above its pivot point would be a very reassuring sign.
>>> The latest Featured Stock Update with an annotated graph appeared on 1/6/2011. Click here.
View all notes |
Alert me of new notes |
CANSLIM.net Company Profile |
SEC |
Zacks Reports |
StockTalk |
News |
Chart |
Request a new note
C
A N
S L
I M
|
Symbol/Exchange
Company Name
Industry Group |
PRICE |
CHANGE
(%Change) |
Day High |
Volume
(% DAV)
(% 50 day avg vol) |
52 Wk Hi
% From Hi |
Featured
Date |
Price
Featured |
Pivot Featured |
|
Max Buy |