You are not logged in.
This means you
CAN ONLY VIEW reports that were published prior to Sunday, February 25, 2024.
You
MUST UPGRADE YOUR MEMBERSHIP if you want to see any current reports.
AFTER MARKET UPDATE - FRIDAY, JANUARY 17TH, 2020
Previous After Market Report Next After Market Report >>>
|
|
|
|
DOW |
+50.46 |
29,348.10 |
+0.17% |
|
Volume |
988,409,840 |
+17% |
|
Volume |
2,520,090,170 |
+10% |
|
NASDAQ |
+31.81 |
9,388.94 |
+0.34% |
|
Advancers |
1,458 |
51% |
|
Advancers |
1,387 |
44% |
|
S&P 500 |
+12.81 |
3,329.62 |
+0.39% |
|
Decliners |
1,409 |
49% |
|
Decliners |
1,755 |
56% |
|
Russell 2000 |
-5.58 |
1,699.64 |
-0.33% |
|
52 Wk Highs |
339 |
|
|
52 Wk Highs |
394 |
|
|
S&P 600 |
-1.75 |
1,039.28 |
-0.17% |
|
52 Wk Lows |
7 |
|
|
52 Wk Lows |
16 |
|
|
 |
Major Indices Rallied Further Into Record High Territory
Kenneth J. Gruneisen - Passed the CAN SLIM® Master's Exam
The Dow added 50 points to finish the week 1.8% higher. The S&P 500 added 0.4% to extended its weekly gain to nearly 2.0%. The Nasdaq Composite advanced 0.3% and 2.3% for the week. All three major averages closed at record levels. Advancers led decliners by a narrow margin on the NYSE, meanwhile, decliners led advancers by 9-7 on the Nasdaq exchange. The reported volume totals were higher than the prior session totals on the NYSE and on the Nasdaq exchange, inflated by options expirations. There were 111 high-ranked companies from the Leaders List that hit a new 52-week high and were listed on the BreakOuts Page, up from the total of 96 on the prior session. New 52-week highs totals expanded and easily outnumbered new 52-week lows totals on the NYSE and on the Nasdaq exchange. The major indices (M criteria) are in a "confirmed uptrend" after enduring distributional pressure in recent weeks. The Featured Stocks Page provides the most timely analysis on high-ranked leaders. Charts used courtesy of www.stockcharts.com
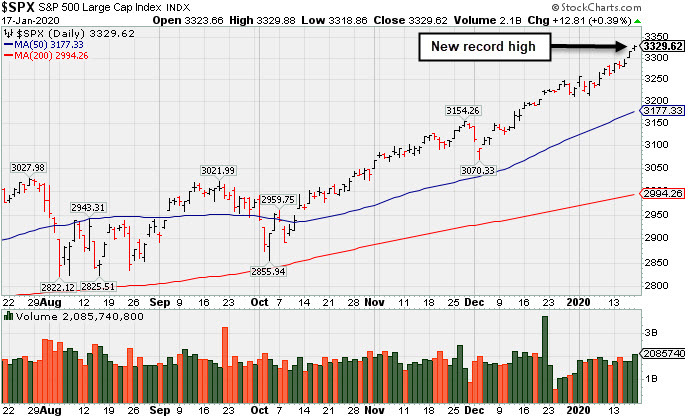
PICTURED: The S&P 500 Index hit yet another new record high
Stocks finished higher Friday, as signs of a stabilizing Chinese economy extended the perceived “risk-on” sentiment. A report out of Beijing showed China’s economy grew at 6.1% in 2019, which was in-line with economist expectations, while industrial production surprised on the upside. The encouraging data release comes just days after the U.S. and China officially signed the “phase one” trade pact.
Ten of 11 S&P 500 sectors ended the day in positive territory with Energy bucking the uptrend. In earnings, CSX Corp (CSX -0.44%) edged lower after reporting a larger-than-anticipated drop in freight volume in the most recent quarter. Trucking company JB Hunt (JBHT -4.24%) fell after disappointing analysts’ earnings and revenue projections. Elsewhere, Google parent Alphabet (GOOGL +2.02%) rose following a target price increase, and surpassed the $1 trillion market capitalization level this week.
On the domestic data front, a report showed housing starts surged 16.9% in December, the largest uptick in three years, and well above expectations of a 1.1% increase. Separately, U.S. industrial production dipped 0.3% in December after gaining a downwardly revised 0.8% in the prior month. Meanwhile, the flash reading of consumer sentiment for January from the University of Michigan ticked down slightly to 99.1 from with December’s 99.3 figure. Treasuries weakened, with the yield on the benchmark 10-year note up two basis points to 1.82%. |
 Kenneth J. Gruneisen started out as a licensed stockbroker in August 1987, a couple of months prior to the historic stock market crash that took the Dow Jones Industrial Average down -22.6% in a single day. He has published daily fact-based fundamental and technical analysis on high-ranked stocks online for two decades. Through FACTBASEDINVESTING.COM, Kenneth provides educational articles, news, market commentary, and other information regarding proven investment systems that work in good times and bad.
Comments contained in the body of this report are technical opinions only and are not necessarily those of Gruneisen Growth Corp. The material herein has been obtained from sources believed to be reliable and accurate, however, its accuracy and completeness cannot be guaranteed. Our firm, employees, and customers may effect transactions, including transactions contrary to any recommendation herein, or have positions in the securities mentioned herein or options with respect thereto. Any recommendation contained in this report may not be suitable for all investors and it is not to be deemed an offer or solicitation on our part with respect to the purchase or sale of any securities. |
|
 |
Semiconductor Index and Bank Index Rose
Kenneth J. Gruneisen - Passed the CAN SLIM® Master's Exam
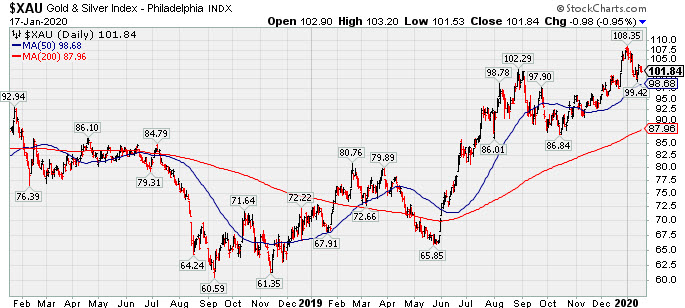
The Bank Index ($BKX +0.36%) posted a modest gain while the Broker/Dealer Index ($XBD -0.04%) and the Retail Index ($RLX +0.05%) both finished flat. The Semiconductor Index ($SOX +0.67%) rose while the Networking Index ($NWX -0.14%) and the Biotech Index ($BTK -0.74%) ended the session lower. Commodity-linked groups had a negative bias as the Oil Services Index ($OSX -0.87%), Integrated Oil Index ($XOI -0.78%), and the Gold & Silver Index ($XAU -0.95%) unanimously fell.
PICTURED: The Gold & Silver Index ($XAU -0.95%) has pulled back since the start of the year.
| Oil Services |
$OSX |
74.99 |
-0.66 |
-0.87% |
-4.22% |
| Integrated Oil |
$XOI |
1,253.75 |
-9.83 |
-0.78% |
-1.32% |
| Semiconductor |
$SOX |
1,916.62 |
+12.69 |
+0.67% |
+3.62% |
| Networking |
$NWX |
594.35 |
-0.84 |
-0.14% |
+1.88% |
| Broker/Dealer |
$XBD |
301.89 |
-0.11 |
-0.04% |
+3.96% |
| Retail |
$RLX |
2,481.01 |
+1.28 |
+0.05% |
+1.30% |
| Gold & Silver |
$XAU |
101.84 |
-0.98 |
-0.95% |
-4.75% |
| Bank |
$BKX |
110.92 |
+0.40 |
+0.36% |
-2.15% |
| Biotech |
$BTK |
5,176.54 |
-38.65 |
-0.74% |
+2.15% |
|
|
|
 |
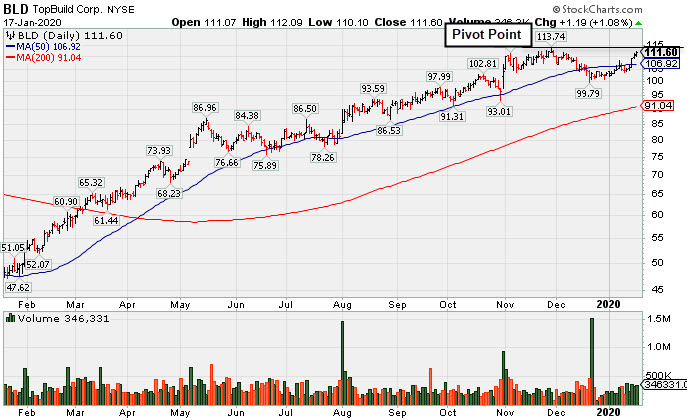
Fifth Consecutive Gain Leaves TopBuild Near 52-Week High
Kenneth J. Gruneisen - Passed the CAN SLIM® Master's Exam
Topbuild Corp (BLD +$1.19 or +1.08% to $111.60) challenged its all-time high with today's 5th consecutive gain. The recent rebound above its 50-day moving average (DMA) line ($106.92) helped its outlook to improve. Previously noted damaging volume-driven losses triggered a technical sell signal. Subsequent gains for new highs backed by at least +40% above average volume may trigger a new (or add on) technical buy signal.
Recently it reported earnings +24% on +5% sales revenues for the Sep '19 quarter versus the year ago period, just below the +25% minimum guideline (C criteria). It still has a 98 Earnings Per Share Rating. Its annual earnings (A criteria) history has also been strong and steady since turning profitable in FY '14. BLD was last shown in this FSU section on 12/24/19 with an annotated graph under the headline, "Recent Slump Below 50-Day Moving Average Did Technical Damage". It traded up as much as 38.4% since first highlighted in yellow with new pivot point cited based on its 8/12/18 high plus 10 cents in the 5/17/19 mid-day report (read here).
The number of top-rated funds owning its shares rose from 380 in Dec '18 to 486 in Dec '19. Its current Up/Down Volume Ratio of 1.5 is an unbiased indication its shares have been under accumulation over the past 50 days. It has a Timeliness Rating of A, but it still has a Sponsorship Rating of D.
|
|
|
Color Codes Explained :
Y - Better candidates highlighted by our
staff of experts.
G - Previously featured
in past reports as yellow but may no longer be buyable under the
guidelines.
***Last / Change / Volume data in this table is the closing quote data***
Symbol/Exchange
Company Name
Industry Group |
PRICE |
CHANGE
(%Change) |
Day High |
Volume
(% DAV)
(% 50 day avg vol) |
52 Wk Hi
% From Hi |
Featured
Date |
Price
Featured |
Pivot Featured |
|
Max Buy |
 CCBG
-
NASDAQ
CCBG
-
NASDAQ
Capital City Bk Gp
BANKING - Regional - Mid-Atlantic Banks
|
$29.04
|
+0.04
0.14% |
$29.40
|
34,060
75.86% of 50 DAV
50 DAV is 44,900
|
$30.95
-6.17%
|
12/16/2019
|
$30.07
|
PP = $30.95
|
|
MB = $32.50
|
Most Recent Note - 1/14/2020 5:05:15 PM
G - Color code is changed to green while slumping below its 50 DMA line ($29.61) raising concerns after meeting resistance at its 52-week high. Prior low ($28.16 on 12/03/19) defines the next important support level.
>>> FEATURED STOCK ARTICLE : Perched Near 52-Week High After Forming an Orderly Base - 1/2/2020 |
View all notes |
Set NEW NOTE alert |
Company Profile |
SEC
News |
Chart |
Request a new note
C
A
S
I |
FTNT
-
NASDAQ
Fortinet Inc
Computer Sftwr-Security
|
$117.49
|
-1.60
-1.34% |
$119.50
|
1,107,447
90.18% of 50 DAV
50 DAV is 1,228,000
|
$119.23
-1.46%
|
12/9/2019
|
$103.85
|
PP = $106.10
|
|
MB = $111.41
|
Most Recent Note - 1/14/2020 5:08:51 PM
G - Hit yet another new 52-week high with below average volume behind today's gain, wedging higher and getting very extended from any sound base. Its 50 DMA line ($104.75) defines important near-term support to watch. See the latest FSU analysis for more details and a new annotated graph.
>>> FEATURED STOCK ARTICLE : Extended From Base After Wedging Higher - 1/14/2020 |
View all notes |
Set NEW NOTE alert |
Company Profile |
SEC
News |
Chart |
Request a new note
C
A
S
I |
SPSC
-
NASDAQ
S P S Commerce Inc
COMPUTER SOFTWARE and SERVICES - Application Software
|
$57.00
|
-1.43
-2.45% |
$58.60
|
158,456
91.59% of 50 DAV
50 DAV is 173,000
|
$59.14
-3.62%
|
11/29/2019
|
$56.59
|
PP = $59.24
|
|
MB = $62.20
|
 Most Recent Note - 1/17/2020 6:19:56 PM
Y - Pulled back today when perched near its all-time high with very little resistance remaining. Subsequent gains above its pivot point backed by at least +40% above average volume are needed to trigger a new technical buy signal. Fundamentals remain strong. Its Relative Strength Rating of 82 is above the 80+ minimum guideline for buy candidates.
>>> FEATURED STOCK ARTICLE : Still Lingering Below Prior Resistance - 1/13/2020 |
View all notes |
Set NEW NOTE alert |
Company Profile |
SEC
News |
Chart |
Request a new note
C
A
S
I |
AUDC
-
NASDAQ
Audiocodes Ltd
ELECTRONICS - Scientific and Technical Instrum
|
$27.46
|
-0.69
-2.45% |
$28.58
|
238,540
91.05% of 50 DAV
50 DAV is 262,000
|
$28.21
-2.66%
|
9/13/2019
|
$19.68
|
PP = $19.84
|
|
MB = $20.83
|
Most Recent Note - 1/16/2020 6:16:20 PM
G - Hit another new all-time high with average volume behind today's big gain. Very extended from the previously noted base. Its 50 DMA line ($24.31) defines support above with prior highs in the $22 area. Fundamentals remain strong.
>>> FEATURED STOCK ARTICLE : Large Loss With Higher Volume Indicates Distributional Pressure - 1/6/2020 |
View all notes |
Set NEW NOTE alert |
Company Profile |
SEC
News |
Chart |
Request a new note
C
A
S
I |
CHDN
-
NASDAQ
Churchill Downs Inc
LEISURE - Gaming Activities
|
$145.13
|
+1.16
0.81% |
$145.30
|
136,175
57.95% of 50 DAV
50 DAV is 235,000
|
$144.18
0.66%
|
10/8/2019
|
$129.77
|
PP = $132.83
|
|
MB = $139.47
|
Most Recent Note - 1/16/2020 6:18:23 PM
G - Hit another new 52-week high with light volume behind today's 4th consecutive gain. Its 50 DMA line ($132.15) defines near-term support above the prior low ($121.81 on 11/07/19) The Jun and Sep '19 quarterly earnings versus the year ago periods were both below the +25% minimum guideline (C criteria) and raised fundamental concerns.
>>> FEATURED STOCK ARTICLE : Touched a New HIgh With Gains Backed by Light Volume - 12/30/2019 |
View all notes |
Set NEW NOTE alert |
Company Profile |
SEC
News |
Chart |
Request a new note
C
A
S
I |
Symbol/Exchange
Company Name
Industry Group |
PRICE |
CHANGE
(%Change) |
Day High |
Volume
(% DAV)
(% 50 day avg vol) |
52 Wk Hi
% From Hi |
Featured
Date |
Price
Featured |
Pivot Featured |
|
Max Buy |
LULU
-
NASDAQ
Lululemon Athletica
MANUFACTURING - Textile Manufacturing
|
$241.25
|
-2.46
-1.01% |
$245.73
|
1,320,764
64.90% of 50 DAV
50 DAV is 2,035,000
|
$247.51
-2.53%
|
9/6/2019
|
$201.25
|
PP = $194.35
|
|
MB = $204.07
|
Most Recent Note - 1/17/2020 6:15:39 PM
G - Stubbornly holding its ground perched near its all-time high with volume totals cooling. Extended from any sound base. Its 50 DMA line ($226) and prior low ($218.18 on 12/12/19) define important near-term support to watch. Fundamentals remain strong.
>>> FEATURED STOCK ARTICLE : Perched at All-Time High After Gains Lacking Great Volume - 1/9/2020 |
View all notes |
Set NEW NOTE alert |
Company Profile |
SEC
News |
Chart |
Request a new note
C
A
S
I |
CPRT
-
NASDAQ
Copart Inc
SPECIALTY RETAIL - Auto Dealerships
|
$97.12
|
-0.09
-0.09% |
$97.30
|
2,596,839
141.67% of 50 DAV
50 DAV is 1,833,000
|
$97.36
-0.25%
|
1/2/2020
|
$92.80
|
PP = $92.51
|
|
MB = $97.14
|
Most Recent Note - 1/17/2020 12:12:54 PM
Y - Perched at its all-time high and near its "max buy" level after 7 consecutive gains marked by below average volume. Its 50 DMA line ($89.53) defines near-term support. Fundamentals remain strong.
>>> FEATURED STOCK ARTICLE : Perched at All-Time HIgh Following Recent Volume-Driven Gain - 1/7/2020 |
View all notes |
Set NEW NOTE alert |
Company Profile |
SEC
News |
Chart |
Request a new note
C
A
S
I |
NMIH
-
NASDAQ
N M I Holdings Inc Cl A
Finance-MrtgandRel Svc
|
$33.53
|
+0.38
1.15% |
$33.67
|
468,412
88.21% of 50 DAV
50 DAV is 531,000
|
$35.79
-6.31%
|
11/8/2019
|
$32.89
|
PP = $31.44
|
|
MB = $33.01
|
Most Recent Note - 1/14/2020 5:11:33 PM
G - A rebound above the 50 DMA line ($32.89) still is needed for its outlook to improve. Prior highs in the $30-31 area define the next important near-term support. Fundamentals remain strong.
>>> FEATURED STOCK ARTICLE : Outlook Hurt by Slump Below 50-Day Moving Average - 1/10/2020 |
View all notes |
Set NEW NOTE alert |
Company Profile |
SEC
News |
Chart |
Request a new note
C
A
S
I |
SPLK
-
NASDAQ
Splunk Inc
Computer Sftwr-Database
|
$157.96
|
-2.36
-1.47% |
$161.49
|
1,630,995
80.46% of 50 DAV
50 DAV is 2,027,000
|
$160.43
-1.54%
|
11/25/2019
|
$147.79
|
PP = $142.16
|
|
MB = $149.27
|
Most Recent Note - 1/16/2020 6:20:22 PM
G - Hit yet another new high with today's gain backed by below average volume, getting more extended from the previously noted base. Prior highs in the $142-143 area define important support to watch coinciding with its 50 DMA line ($143).
>>> FEATURED STOCK ARTICLE : New High Hit With Another Gain on Near Average Volume - 1/8/2020 |
View all notes |
Set NEW NOTE alert |
Company Profile |
SEC
News |
Chart |
Request a new note
C
A
S
I |
PAYC
-
NYSE
Paycom Software Inc
COMPUTER SOFTWARE and SERVICES - Application Software
|
$296.24
|
+1.93
0.66% |
$296.52
|
308,327
59.99% of 50 DAV
50 DAV is 514,000
|
$297.53
-0.43%
|
11/20/2019
|
$252.97
|
PP = $259.81
|
|
MB = $272.80
|
Most Recent Note - 1/17/2020 6:17:40 PM
G - Managed a best-ever close with today's 3rd consecutive gain backed by light volume. Very extended from any sound base. Its 50 DMA line ($262) defines important near-term support to watch. Fundamentals remain strong.
>>> FEATURED STOCK ARTICLE : Perched Near High and Near the Max Buy Level - 1/3/2020 |
View all notes |
Set NEW NOTE alert |
Company Profile |
SEC
News |
Chart |
Request a new note
C
A
S
I |
Symbol/Exchange
Company Name
Industry Group |
PRICE |
CHANGE
(%Change) |
Day High |
Volume
(% DAV)
(% 50 day avg vol) |
52 Wk Hi
% From Hi |
Featured
Date |
Price
Featured |
Pivot Featured |
|
Max Buy |
BLD
-
NYSE
Topbuild Corp
Bldg-Constr Prds/Misc
|
$111.60
|
+1.19
1.08% |
$112.09
|
346,331
127.33% of 50 DAV
50 DAV is 272,000
|
$113.74
-1.88%
|
12/9/2019
|
$109.71
|
PP = $113.84
|
|
MB = $119.53
|
Most Recent Note - 1/17/2020 6:12:54 PM
Y - Challenged its 52-week high with today's 5th consecutive gain. Recent rebound above its 50 DMA line ($106.92) helped its outlook to improve. See the latest FSU analysis for more details and a new annotated graph.
>>> FEATURED STOCK ARTICLE : Fifth Consecutive Gain Leaves TopBuild Near 52-Week High - 1/17/2020 |
View all notes |
Set NEW NOTE alert |
Company Profile |
SEC
News |
Chart |
Request a new note
C
A
S
I |
GLOB
-
NYSE
Globant SA
Computer-Tech Services
|
$119.67
|
+3.01
2.58% |
$119.83
|
189,330
69.61% of 50 DAV
50 DAV is 272,000
|
$118.84
0.70%
|
11/14/2019
|
$106.87
|
PP = $112.43
|
|
MB = $118.05
|
Most Recent Note - 1/15/2020 5:25:17 PM
Y - Posted a solid gain with +12% above average volume today for a new high. Gains above the pivot point backed by at least +40% above average volume are needed to trigger a proper technical buy signal. Its 50 DMA line ($104) defines important near-term support to watch on pullbacks. Fundamentals remain strong. See the latest FSU analysis for more details and a new annotated graph.
>>> FEATURED STOCK ARTICLE : Gain for New High Today Backed by Only +12% Above Average Volume - 1/15/2020 |
View all notes |
Set NEW NOTE alert |
Company Profile |
SEC
News |
Chart |
Request a new note
C
A
S
I |
|
|
|
THESE ARE NOT BUY RECOMMENDATIONS!
Comments contained in the body of this report are technical
opinions only. The material herein has been obtained
from sources believed to be reliable and accurate, however,
its accuracy and completeness cannot be guaranteed.
This site is not an investment advisor, hence it does
not endorse or recommend any securities or other investments.
Any recommendation contained in this report may not
be suitable for all investors and it is not to be deemed
an offer or solicitation on our part with respect to
the purchase or sale of any securities. All trademarks,
service marks and trade names appearing in this report
are the property of their respective owners, and are
likewise used for identification purposes only.
This report is a service available
only to active Paid Premium Members.
You may opt-out of receiving report notifications
at any time. Questions or comments may be submitted
by writing to Premium Membership Services 665 S.E. 10 Street, Suite 201 Deerfield Beach, FL 33441-5634 or by calling 1-800-965-8307
or 954-785-1121.
|
|
|