You are not logged in.
This means you
CAN ONLY VIEW reports that were published prior to Monday, April 14, 2025.
You
MUST UPGRADE YOUR MEMBERSHIP if you want to see any current reports.
AFTER MARKET UPDATE - THURSDAY, JANUARY 17TH, 2013
Previous After Market Report Next After Market Report >>>
|
|
|
|
DOW |
+84.79 |
13,596.02 |
+0.63% |
|
Volume |
710,015,880 |
+18% |
|
Volume |
1,706,500,340 |
+4% |
|
NASDAQ |
+18.46 |
3,136.00 |
+0.59% |
|
Advancers |
2,285 |
73% |
|
Advancers |
1,640 |
64% |
|
S&P 500 |
+8.31 |
1,480.94 |
+0.56% |
|
Decliners |
719 |
23% |
|
Decliners |
790 |
31% |
|
Russell 2000 |
+8.05 |
890.36 |
+0.91% |
|
52 Wk Highs |
379 |
|
|
52 Wk Highs |
160 |
|
|
S&P 600 |
+5.34 |
498.11 |
+1.08% |
|
52 Wk Lows |
2 |
|
|
52 Wk Lows |
9 |
|
|
 |
Breadth Positive and Volume Higher as Indices Rally Further
Kenneth J. Gruneisen - Passed the CAN SLIM® Master's Exam
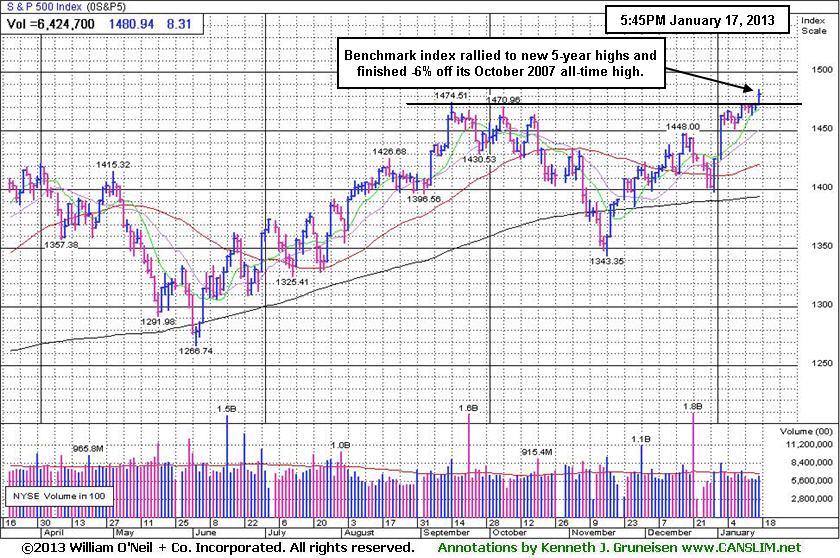
The major averages rallied to finish higher on Thursday and the benchmark S&P 500 Index ended at its best level in more than five years. The volume totals were reported higher on the NYSE and on the Nasdaq exchange, indicating an encouraging increase in buying demand from influential institutional investors. Breadth was positive as advancers led decliners by 3-1 on the NYSE and by 2-1 margin on the Nasdaq exchange. The total number of stocks hitting new 52-week highs swelled and easily outnumbered new 52-week lows on the NYSE and on the Nasdaq exchange. New 52-week lows totals were in the single digits on both exchanges again. There were 117 high-ranked companies from the CANSLIM.net Leaders List making new 52-week highs and appearing on the CANSLIM.net BreakOuts Page, more than doubling the prior session total of 51 stocks. There were gains for 6 of the 9 high-ranked companies currently included on the Featured Stocks Page. Patience and selectivity are required, however, as the latest rally has produced very few action worthy candidates meeting all of the fact-based investment system's criteria.
The major averages were firmly in positive territory following better-than-expected data on the labor and housing markets. Before the open, weekly initial jobless claims unexpectedly declined 37,000 to 335,000, a 5-year low. A separate report showed housing starts unexpectedly climbed +12.1% in December, helping give a boost to shares of homebuilder Pulte Group (PHM +5.33%) among others. The market remained higher despite a Philadelphia Fed survey which revealed that business activity in the Mid-Atlantic region contracted in January.
Consumer discretionary was the best performing sector. eBay Inc (EBAY +2.40%) rose after reporting revenues above some analyst projections. Industrials also outperformed including a gain from General Electric (GE +0.85%). Financials were the laggard on the session as Bank of America Corp (BAC -4.24%) and Citigroup Inc (C -2.92%) declined amid disappointment in their quarterly results.
Treasuries retreated with the 10-year note off 15/32 to yield 1.87%.
Investors may consider new buying efforts in stocks meeting all key criteria, as the market's (M criteria) confirmed uptrend showed a great expansion in leadership (stocks hitting new 52-week highs). Solid gains have helped all of the major averages blast higher.
Watch for an announcement via email concerning the next WEBCAST. The webcast will also be available via an updated link highlighted at the top of the Premium Member Homepage.
PICTURED: The S&P 500 Index rallied to new 5-year highs and finished -6% off its all-time high from October 2007.
|
 Kenneth J. Gruneisen started out as a licensed stockbroker in August 1987, a couple of months prior to the historic stock market crash that took the Dow Jones Industrial Average down -22.6% in a single day. He has published daily fact-based fundamental and technical analysis on high-ranked stocks online for two decades. Through FACTBASEDINVESTING.COM, Kenneth provides educational articles, news, market commentary, and other information regarding proven investment systems that work in good times and bad.
Comments contained in the body of this report are technical opinions only and are not necessarily those of Gruneisen Growth Corp. The material herein has been obtained from sources believed to be reliable and accurate, however, its accuracy and completeness cannot be guaranteed. Our firm, employees, and customers may effect transactions, including transactions contrary to any recommendation herein, or have positions in the securities mentioned herein or options with respect thereto. Any recommendation contained in this report may not be suitable for all investors and it is not to be deemed an offer or solicitation on our part with respect to the purchase or sale of any securities. |
|
 |
Retail, Broker/Dealer, Energy and Tech Indexes Rose
Kenneth J. Gruneisen - Passed the CAN SLIM® Master's Exam
Defensive groups were mixed as the Healthcare Index ($HMO +1.48%) posted a solid gain but the Gold & Silver Index ($XAU -0.56%) edged lower. The Semiconductor Index ($SOX +2.00%) led the tech sector higher while the Networking Index ($NWX +0.81%) and the Internet Index ($IIX +0.39%) posted smaller gains, but the Biotechnology Index ($BTK -0.03%) finished flat. Influential gains from the Retail Index ($RLX +0.87%) and the Broker/Dealer Index ($XBD +0.76%) underpinned the major averages' gains, meanwhile the Bank Index ($BKX +0.15%) lagged. Gains in energy-related shares helped the Integrated Oil Index ($XOI +0.60%) and the Oil Services Index ($OSX +0.72%) rise, rounding out Thursday's widely positive session.
Charts courtesy www.stockcharts.com
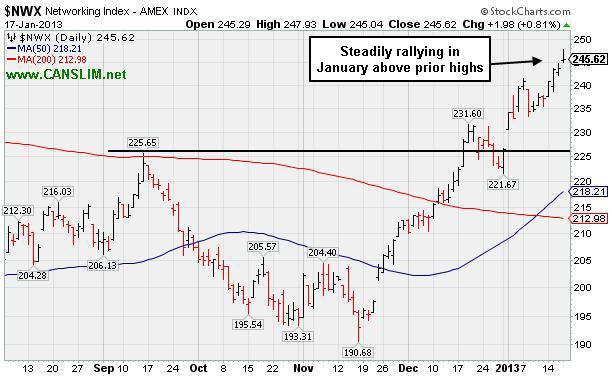
PICTURED: The Networking Index ($NWX +0.81%) has been steadily rallying in January above prior highs.
| Oil Services |
$OSX |
235.50 |
+1.68 |
+0.72% |
+6.97% |
| Healthcare |
$HMO |
2,587.80 |
+37.85 |
+1.48% |
+2.93% |
| Integrated Oil |
$XOI |
1,301.64 |
+7.81 |
+0.60% |
+4.82% |
| Semiconductor |
$SOX |
412.53 |
+8.07 |
+2.00% |
+7.41% |
| Networking |
$NWX |
245.62 |
+1.98 |
+0.81% |
+8.42% |
| Internet |
$IIX |
342.21 |
+1.33 |
+0.39% |
+4.65% |
| Broker/Dealer |
$XBD |
98.91 |
+0.75 |
+0.76% |
+4.85% |
| Retail |
$RLX |
681.91 |
+5.89 |
+0.87% |
+4.42% |
| Gold & Silver |
$XAU |
161.52 |
-0.91 |
-0.56% |
-2.46% |
| Bank |
$BKX |
53.62 |
+0.08 |
+0.15% |
+4.56% |
| Biotech |
$BTK |
1,654.80 |
-0.55 |
-0.03% |
+6.97% |
|
|
|
 |
Rule Suggests Letting Explosive Winners Have Time For Greater Gains
Kenneth J. Gruneisen - Passed the CAN SLIM® Master's Exam
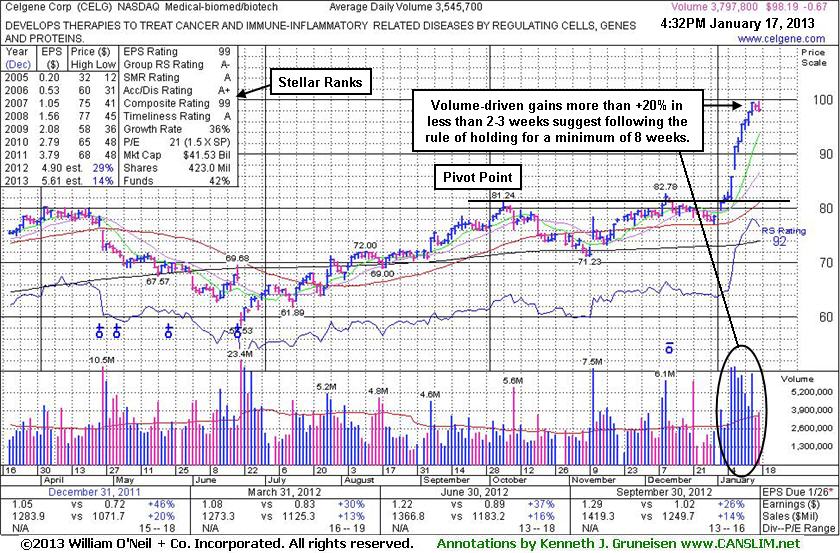
Celgene Corp (CELG -$0.67 or +0.68% to $98.19) is holding its ground near its 52-week high following a streak of 11 consecutive gains marked by above average volume. It is very extended from its prior base. Having quickly rallied more than +20% in the first 2-3 weeks after its technical breakout, the investment system rules suggest holding such explosive winners for a minimum of 8 weeks to allow for potentially greater gains. Disciplined investors never hold any stock if it fails badly however, or if it falls more than -7% from their purchase price.
CELG has maintained a strong earnings history (C and A criteria). Watch for the company to make its latest quarterly earnings report before the open on January 24, 2013, and note that volume and volatility often increase near earnings news.
The Medical -Biomed/Biotech firm's last appearance in this FSU section was on 1/03/13 with an annotated graph under the headline, "RS Rating Waning While Perched Near High". Buy candidates should have a RS rank of 80+, so it was noted that the sub par rank then argued against new buying efforts, however the bullish action in the days that followed helped its RS rank quickly ratchet higher and it is currently sporting a 92 RS rank.
The number of top-rated funds owning its shares rose from 1,623 in Dec '11 to 1,681 in Sep '12, a reassuring trend concerning the I criteria. Its current Up/Down Volume Ratio of 2.3 also offers an unbiased indication its shares have been under accumulation over the past 50 days. However, the company is already well-known by the institutional crowd.
|
|
|
Color Codes Explained :
Y - Better candidates highlighted by our
staff of experts.
G - Previously featured
in past reports as yellow but may no longer be buyable under the
guidelines.
***Last / Change / Volume data in this table is the closing quote data***
Symbol/Exchange
Company Name
Industry Group |
PRICE |
CHANGE
(%Change) |
Day High |
Volume
(% DAV)
(% 50 day avg vol) |
52 Wk Hi
% From Hi |
Featured
Date |
Price
Featured |
Pivot Featured |
|
Max Buy |
CELG
-
NASDAQ
Celgene Corp
DRUGS - Drug Manufacturers - Major
|
$98.19
|
-0.67
-0.68% |
$99.75
|
3,835,817
108.18% of 50 DAV
50 DAV is 3,545,700
|
$99.51
-1.33%
|
12/11/2012
|
$82.24
|
PP = $81.34
|
|
MB = $85.41
|
 Most Recent Note - 1/17/2013 5:05:24 PM
G - Very extended from its prior base, but having rallied more than +20% in the first 2-3 weeks after its breakout, the investment system rules suggest holding such winners for a minimum of 8 weeks. See the latest FSU analysis for more details and a new annotated graph.
>>> The latest Featured Stock Update with an annotated graph appeared on 1/17/2013. Click here.
View all notes |
Alert me of new notes |
CANSLIM.net Company Profile |
SEC |
Zacks Reports |
StockTalk |
News |
Chart |
Request a new note
C
A N
S L
I M


|
CFNL
-
NASDAQ
Cardinal Financial Corp
BANKING - Regional - Southeast Banks
|
$15.91
|
-0.39
-2.39% |
$16.14
|
514,225
236.10% of 50 DAV
50 DAV is 217,800
|
$16.90
-5.86%
|
12/3/2012
|
$15.20
|
PP = $16.31
|
|
MB = $17.13
|
Most Recent Note - 1/17/2013 11:58:24 AM
Y - Gapped down today, testing support at its 50 DMA line. That important short-term average acted as support throughout its ongoing ascent, while a damaging violation may trigger a technical sell signal. Reported earnings +54% on +28% sales revenues for the quarter ended December 31, 2012 versus the year ago period, continuing its strong earnings track record satisfying the C criteria.
>>> The latest Featured Stock Update with an annotated graph appeared on 1/15/2013. Click here.
View all notes |
Alert me of new notes |
CANSLIM.net Company Profile |
SEC |
Zacks Reports |
StockTalk |
News |
Chart |
Request a new note
C
A N
S L
I M
|
CMCSA
-
NASDAQ
Comcast Corp Cl A
MEDIA - CATV Systems
|
$39.95
|
+0.77
1.97% |
$40.04
|
11,103,241
98.06% of 50 DAV
50 DAV is 11,323,400
|
$39.29
1.68%
|
12/3/2012
|
$37.08
|
PP = $38.06
|
|
MB = $39.96
|
Most Recent Note - 1/17/2013 4:20:03 PM
G - Color code is changed to green after rallying to its "max buy" level and finishing strong for another new 52-week high today. No resistance remains due to overhead supply. Prior highs in the $38 area define initial support to watch on pullbacks.
>>> The latest Featured Stock Update with an annotated graph appeared on 1/11/2013. Click here.
View all notes |
Alert me of new notes |
CANSLIM.net Company Profile |
SEC |
Zacks Reports |
StockTalk |
News |
Chart |
Request a new note
C
A N
S L
I M
|
MIDD
-
NASDAQ
Middleby Corp
MANUFACTURING - Diversified Machinery
|
$131.29
|
+0.68
0.52% |
$132.22
|
69,550
80.68% of 50 DAV
50 DAV is 86,200
|
$134.51
-2.39%
|
10/8/2012
|
$118.46
|
PP = $122.67
|
|
MB = $128.80
|
Most Recent Note - 1/14/2013 5:50:33 PM
G - Holding its ground stubbornly near its 52-week and all-time highs with recent volume totals below average. Earnings +23% on +18% sales for the Sep '12 quarter, below the +25% minimum earnings guideline (C criteria), raised concerns. See latest FSU analysis for more details and a new annotated graph.
>>> The latest Featured Stock Update with an annotated graph appeared on 1/14/2013. Click here.
View all notes |
Alert me of new notes |
CANSLIM.net Company Profile |
SEC |
Zacks Reports |
StockTalk |
News |
Chart |
Request a new note
C
A N
S L
I M
|
N
-
NYSE
Netsuite Inc
DIVERSIFIED SERVICES - Business/Management Services
|
$67.72
|
+0.62
0.92% |
$67.95
|
101,290
28.10% of 50 DAV
50 DAV is 360,400
|
$70.80
-4.35%
|
12/12/2012
|
$64.75
|
PP = $67.12
|
|
MB = $70.48
|
Most Recent Note - 1/15/2013 2:51:32 PM
Y - Perched near its 52-week high today. Recent gains above its pivot point have been marked by below average volume. Disciplined investors know that volume must be at least +40% above average behind gains above the pivot point to trigger a proper technical buy signal.
>>> The latest Featured Stock Update with an annotated graph appeared on 1/4/2013. Click here.
View all notes |
Alert me of new notes |
CANSLIM.net Company Profile |
SEC |
Zacks Reports |
StockTalk |
News |
Chart |
Request a new note
C
A N
S L
I M
|
Symbol/Exchange
Company Name
Industry Group |
PRICE |
CHANGE
(%Change) |
Day High |
Volume
(% DAV)
(% 50 day avg vol) |
52 Wk Hi
% From Hi |
Featured
Date |
Price
Featured |
Pivot Featured |
|
Max Buy |
NSR
-
NYSE
Neustar Inc
TELECOMMUNICATIONS - Diversified Communication Serv
|
$43.39
|
-0.96
-2.16% |
$45.49
|
648,561
156.17% of 50 DAV
50 DAV is 415,300
|
$44.82
-3.19%
|
12/11/2012
|
$41.85
|
PP = $41.41
|
|
MB = $43.48
|
Most Recent Note - 1/17/2013 4:24:25 PM
G - After hitting a new 52-week high today there was a worrisome "negative reversal" for a loss with above average volume. Prior highs and its 50 DMA line coincide near $41 defining chart support to watch on pullbacks. See the latest FSU analysis for more details and a new annotated graph.
>>> The latest Featured Stock Update with an annotated graph appeared on 1/16/2013. Click here.
View all notes |
Alert me of new notes |
CANSLIM.net Company Profile |
SEC |
Zacks Reports |
StockTalk |
News |
Chart |
Request a new note
C
A N
S L
I M
|
RAX
-
NYSE
Rackspace Hosting Inc
INTERNET - Internet Software and; Services
|
$77.33
|
+0.60
0.78% |
$77.74
|
955,028
71.35% of 50 DAV
50 DAV is 1,338,500
|
$78.62
-1.64%
|
12/18/2012
|
$71.88
|
PP = $70.10
|
|
MB = $73.61
|
Most Recent Note - 1/15/2013 2:50:13 PM
G - Volume totals have been cooling for the past week while holding its ground in a tight range near its all-time high. Extended from its prior base, meanwhile prior highs in the $70 area define initial support to watch.
>>> The latest Featured Stock Update with an annotated graph appeared on 1/8/2013. Click here.
View all notes |
Alert me of new notes |
CANSLIM.net Company Profile |
SEC |
Zacks Reports |
StockTalk |
News |
Chart |
Request a new note
C
A N
S L
I M
|
RNF
-
NYSE
Rentech Nitrogen Ptnr Lp
CHEMICALS - Agricultural Chemicals
|
$44.48
|
+0.36
0.82% |
$44.75
|
336,574
105.44% of 50 DAV
50 DAV is 319,200
|
$48.19
-7.70%
|
11/1/2012
|
$39.11
|
PP = $40.15
|
|
MB = $42.16
|
Most Recent Note - 1/16/2013 12:28:03 PM
G - Down considerably today for a 3rd loss with above average volume in a 4-day span after getting extended from prior highs in the $40 area which define support to watch on pullbacks. Disciplined investors avoid chasing stocks extended more than +5% above prior highs following a technical breakout from a sound base.
>>> The latest Featured Stock Update with an annotated graph appeared on 1/9/2013. Click here.
View all notes |
Alert me of new notes |
CANSLIM.net Company Profile |
SEC |
Zacks Reports |
StockTalk |
News |
Chart |
Request a new note
C
A N
S L
I M
|
VRX
-
NYSE
Valeant Pharmaceuticals
DRUGS - Drug Manufacturers - Other
|
$63.78
|
+0.26
0.41% |
$64.69
|
1,594,335
102.36% of 50 DAV
50 DAV is 1,557,600
|
$64.41
-0.98%
|
12/20/2012
|
$60.24
|
PP = $61.21
|
|
MB = $64.27
|
Most Recent Note - 1/14/2013 5:59:36 PM
Y - Hovering quietly above its pivot point and near its 52-week high today. Volume behind recent gains was below the +40% above average volume guideline which is the bare minimum threshold needed to trigger a proper technical buy signal. Disciplined investors may use a tactic called "pyramiding" to allow market action to dictate their positioning.
>>> The latest Featured Stock Update with an annotated graph appeared on 1/10/2013. Click here.
View all notes |
Alert me of new notes |
CANSLIM.net Company Profile |
SEC |
Zacks Reports |
StockTalk |
News |
Chart |
Request a new note
C
A N
S L
I M
|
|
|
|
THESE ARE NOT BUY RECOMMENDATIONS!
Comments contained in the body of this report are technical
opinions only. The material herein has been obtained
from sources believed to be reliable and accurate, however,
its accuracy and completeness cannot be guaranteed.
This site is not an investment advisor, hence it does
not endorse or recommend any securities or other investments.
Any recommendation contained in this report may not
be suitable for all investors and it is not to be deemed
an offer or solicitation on our part with respect to
the purchase or sale of any securities. All trademarks,
service marks and trade names appearing in this report
are the property of their respective owners, and are
likewise used for identification purposes only.
This report is a service available
only to active Paid Premium Members.
You may opt-out of receiving report notifications
at any time. Questions or comments may be submitted
by writing to Premium Membership Services 665 S.E. 10 Street, Suite 201 Deerfield Beach, FL 33441-5634 or by calling 1-800-965-8307
or 954-785-1121.
|
|
|

