You are not logged in.
This means you
CAN ONLY VIEW reports that were published prior to Monday, April 14, 2025.
You
MUST UPGRADE YOUR MEMBERSHIP if you want to see any current reports.
AFTER MARKET UPDATE - WEDNESDAY, JANUARY 16TH, 2013
Previous After Market Report Next After Market Report >>>
|
|
|
|
DOW |
-23.66 |
13,511.23 |
-0.17% |
|
Volume |
599,710,060 |
-1% |
|
Volume |
1,636,185,880 |
-9% |
|
NASDAQ |
+6.76 |
3,117.54 |
+0.22% |
|
Advancers |
1,357 |
44% |
|
Advancers |
985 |
38% |
|
S&P 500 |
+0.29 |
1,472.63 |
+0.02% |
|
Decliners |
1,619 |
52% |
|
Decliners |
1,473 |
58% |
|
Russell 2000 |
-2.29 |
882.31 |
-0.26% |
|
52 Wk Highs |
163 |
|
|
52 Wk Highs |
100 |
|
|
S&P 600 |
-1.21 |
492.77 |
-0.24% |
|
52 Wk Lows |
4 |
|
|
52 Wk Lows |
6 |
|
|
 |
Major Averages Ended Mixed Again With Lighter Volume
Kenneth J. Gruneisen - Passed the CAN SLIM® Master's Exam
On Wednesday the major averages again ended mixed and little changed. The volume totals were reported lighter on the NYSE and on the Nasdaq exchange. Breadth was negative as decliners led advancers by nearly 3-2 on the Nasdaq exchange and by a narrower 8-7 margin on the NYSE. The total number of stocks hitting new 52-week highs easily outnumbered new 52-week lows on the NYSE and on the Nasdaq exchange. New 52-week lows totals were in the single digits on both exchanges. There were 51 high-ranked companies from the CANSLIM.net Leaders List making new 52-week highs and appearing on the CANSLIM.net BreakOuts Page, down from the prior session total of 59 stocks. Any sustainable rally requires a healthy crop of companies hitting new 52-week highs, so it remains encouraging to see solid leadership. There were unanimous losses for the 9 high-ranked companies currently included on the Featured Stocks Page, disconcertingly weak action versus the broader market yet again.
Uncertainty kept the market from making headway as investors weighed concerns over global growth against the latest economic data and bank earnings. The market opened lower after the World Bank on Tuesday cut its 2013 global growth forecast to 2.4% from 3.0%. Economic reports showed consumer prices were unchanged while industrial production rose +0.3% in December. The Fed's Beige Book survey revealed business activity expanded at a moderate pace.
On the earnings front, The Goldman Sachs Group Inc (GS +4.06%) and JP Morgan Chase & Co (JPM +1.01%) rose after reporting better-than-expected quarterly results. Chipotle Mexican Grill (CMG -5.51%) slumped after issuing preliminary fourth-quarter earnings below expectations. Technology was the best performing group with Apple Inc (AAPL +4.15%) climbing. Hewlett-Packard Co (HPQ +4.11%) rose following a report the company received interest from potential buyers for two of its businesses. Shares of Boeing Co (BA -3.38%) declined amid safety concerns surrounding its Dreamliner 787 aircraft.
The 10-year note was up 3/16 to yield 1.81%.
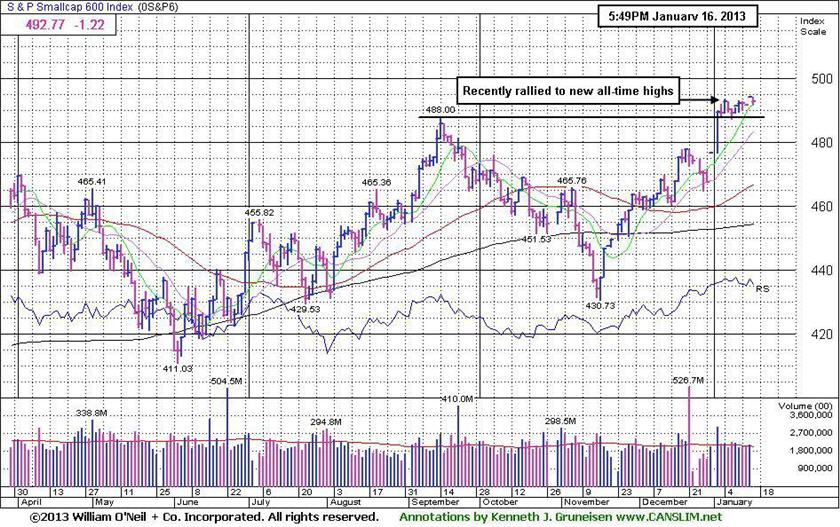
Investors may consider new buying efforts in stocks meeting all key criteria, as the market's (M criteria) confirmed uptrend showed a great expansion in leadership (stocks hitting new 52-week highs) after overcoming recent pressure. Solid gains helped the benchmark S&P 500 Index promptly rebound above its 50-day moving average (DMA) line, and Nasdaq Composite Index and Dow Jones Industrial Average both promptly rebounded above their respective 50 DMA and 200 DMA lines. All of the major averages then blasted above their December highs with additional volume-driven gains.
Watch for an announcement via email concerning the next WEBCAST. The webcast will also be available via an updated link highlighted at the top of the Premium Member Homepage.
PICTURED: The S&P Small-Cap 600 Index recently rallied to new all-time highs, which bodes well for the broader market outlook.
|
 Kenneth J. Gruneisen started out as a licensed stockbroker in August 1987, a couple of months prior to the historic stock market crash that took the Dow Jones Industrial Average down -22.6% in a single day. He has published daily fact-based fundamental and technical analysis on high-ranked stocks online for two decades. Through FACTBASEDINVESTING.COM, Kenneth provides educational articles, news, market commentary, and other information regarding proven investment systems that work in good times and bad.
Comments contained in the body of this report are technical opinions only and are not necessarily those of Gruneisen Growth Corp. The material herein has been obtained from sources believed to be reliable and accurate, however, its accuracy and completeness cannot be guaranteed. Our firm, employees, and customers may effect transactions, including transactions contrary to any recommendation herein, or have positions in the securities mentioned herein or options with respect thereto. Any recommendation contained in this report may not be suitable for all investors and it is not to be deemed an offer or solicitation on our part with respect to the purchase or sale of any securities. |
|
 |
Bank, Semiconductor, and Energy-Related Indexes Rose
Kenneth J. Gruneisen - Passed the CAN SLIM® Master's Exam
The Bank Index ($BKX +0.43%) posted a modest gain, however small losses from the Broker/Dealer Index ($XBD -0.21%) and Retail Index ($RLX -0.17%) limited the major averages' ability to rally. The Semiconductor Index ($SOX +1.15%) tried to lead the tech sector higher, but the Networking Index ($NWX +0.13%) and Internet Index ($IIX -0.02%) finished virtually unchanged and the Biotechnology Index ($BTK -0.60%) edged lower. Energy-related shares had a slightly positive bias as the Integrated Oil Index ($XOI +0.23%) and Oil Services Index ($OSX +0.74%) posted modest gains. Meanwhile, defensive groups showed modest weakness as the Gold & Silver Index ($XAU -0.67%) and Healthcare Index ($HMO -0.40%) both edged lower.
Charts courtesy www.stockcharts.com
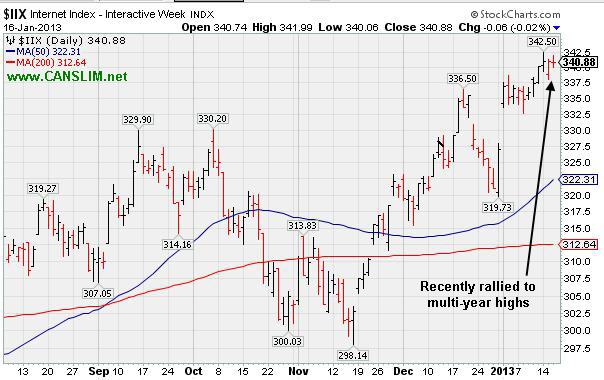
PICTURED: The Internet Index ($IIX -0.02%) recently rallied to new multi-year highs.
| Oil Services |
$OSX |
233.82 |
+1.71 |
+0.74% |
+6.20% |
| Healthcare |
$HMO |
2,549.96 |
-10.21 |
-0.40% |
+1.42% |
| Integrated Oil |
$XOI |
1,293.83 |
+2.91 |
+0.23% |
+4.19% |
| Semiconductor |
$SOX |
404.46 |
+4.59 |
+1.15% |
+5.31% |
| Networking |
$NWX |
243.64 |
+0.32 |
+0.13% |
+7.54% |
| Internet |
$IIX |
340.88 |
-0.06 |
-0.02% |
+4.24% |
| Broker/Dealer |
$XBD |
98.16 |
-0.20 |
-0.21% |
+4.06% |
| Retail |
$RLX |
676.02 |
-1.16 |
-0.17% |
+3.52% |
| Gold & Silver |
$XAU |
162.43 |
-1.10 |
-0.67% |
-1.91% |
| Bank |
$BKX |
53.54 |
+0.23 |
+0.43% |
+4.41% |
| Biotech |
$BTK |
1,655.35 |
-10.03 |
-0.60% |
+7.00% |
|
|
|
 |
Extended From Base After Prior Highs Acted as Support
Kenneth J. Gruneisen - Passed the CAN SLIM® Master's Exam
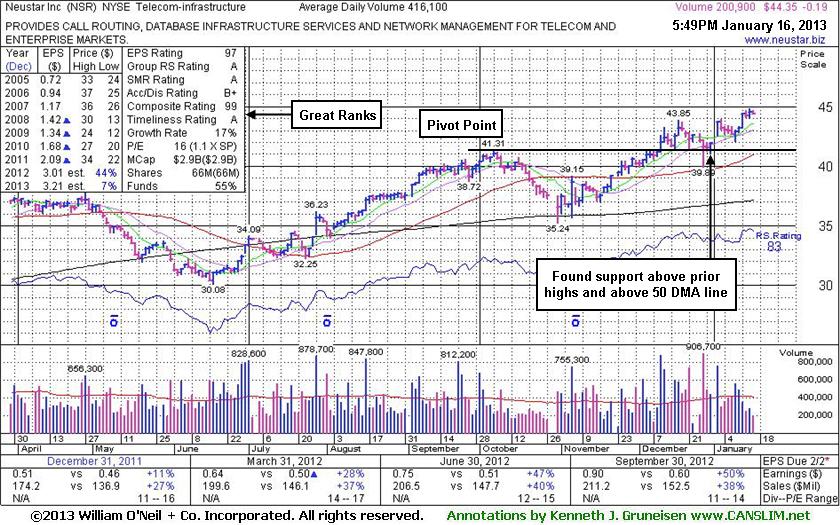
Neustar Inc (NSR -$0.19 or -0.43% to $44.35) is perched at its 52-week high today, extended from its prior base. Prior highs and its 50-day moving average (DMA) line coincide near $41 defining chart support to watch on pullbacks. Leadership from other high-ranked leaders in the Telecom - Infrastructure group is a reassuring sign (concerning the L criteria). Its Group Relative Strength Rating has improved to a 86 from a 79 rating since since it was last shown in this FSU section on 1/02/13 with an annotated graph under the headline, "Held Ground Following Prior Breakout; Getting Extended Now", as it rallied above its "max buy" level with a volume-driven gain.
Disciplined investors know to avoid chasing extended stocks more than +5% above their pivot point, and they always sell if ever any stock falls more than -7% from their purchase price to properly manage risk under the fact-based system's guidelines. Its 12/11/12 gain on heavy volume +172% above average clinched a technical buy signal. It rose from a 10-week base during which it found support at its 200-day moving average (DMA) line. Prior highs and its 50 DMA line acted as support while investors may have accumulated shares before rallying further into new high territory.
Quarterly comparisons through Sep '12 showed 3 consecutive increases of more than the +25% minimum earnings guideline (C criteria). The number of top-rated funds owning its shares rose from 400 in Mar '12 to 408 in Dec '12, a slightly reassuring trend concerning the I criteria. Its Return On Equity is reported at 29%, well above the 17% minimum guideline. Its small supply of 66 million shares (S criteria) outstanding can lead to greater price volatility if the institutional crowd rushes to accumulate shares, or if they decide to leave.
|
|
|
Color Codes Explained :
Y - Better candidates highlighted by our
staff of experts.
G - Previously featured
in past reports as yellow but may no longer be buyable under the
guidelines.
***Last / Change / Volume data in this table is the closing quote data***
Symbol/Exchange
Company Name
Industry Group |
PRICE |
CHANGE
(%Change) |
Day High |
Volume
(% DAV)
(% 50 day avg vol) |
52 Wk Hi
% From Hi |
Featured
Date |
Price
Featured |
Pivot Featured |
|
Max Buy |
CELG
-
NASDAQ
Celgene Corp
DRUGS - Drug Manufacturers - Major
|
$98.86
|
-0.53
-0.53% |
$99.25
|
3,440,978
97.77% of 50 DAV
50 DAV is 3,519,500
|
$99.51
-0.65%
|
12/11/2012
|
$82.24
|
PP = $81.34
|
|
MB = $85.41
|
Most Recent Note - 1/15/2013 11:57:51 AM
G - Hit another new 52-week high today while on track for its 11th consecutive gain, very extended from its prior base. Having quickly rallied more than +20% in the first 2-3 weeks after a breakout, the investment system rules suggest holding such winners for a minimum of 8 weeks.
>>> The latest Featured Stock Update with an annotated graph appeared on 1/3/2013. Click here.
View all notes |
Alert me of new notes |
CANSLIM.net Company Profile |
SEC |
Zacks Reports |
StockTalk |
News |
Chart |
Request a new note
C
A N
S L
I M


|
CFNL
-
NASDAQ
Cardinal Financial Corp
BANKING - Regional - Southeast Banks
|
$16.30
|
-0.08
-0.49% |
$16.45
|
188,721
86.21% of 50 DAV
50 DAV is 218,900
|
$16.90
-3.55%
|
12/3/2012
|
$15.20
|
PP = $16.31
|
|
MB = $17.13
|
Most Recent Note - 1/15/2013 7:07:07 PM
Y - Finding support while consolidating above its prior highs. Still trading below its "max buy" level after the rally above its pivot point on 1/02/13 triggered a technical buy signal. See the latest FSU analysis for more details and a new annotated graph.
>>> The latest Featured Stock Update with an annotated graph appeared on 1/15/2013. Click here.
View all notes |
Alert me of new notes |
CANSLIM.net Company Profile |
SEC |
Zacks Reports |
StockTalk |
News |
Chart |
Request a new note
C
A N
S L
I M
|
CMCSA
-
NASDAQ
Comcast Corp Cl A
MEDIA - CATV Systems
|
$39.18
|
-0.02
-0.05% |
$39.29
|
8,854,387
77.47% of 50 DAV
50 DAV is 11,429,200
|
$39.22
-0.10%
|
12/3/2012
|
$37.08
|
PP = $38.06
|
|
MB = $39.96
|
Most Recent Note - 1/15/2013 11:59:40 AM
Y - Inching to another new 52-week high today. No resistance remains due to overhead supply. Its recent low defines initial support near its 50 DMA line
>>> The latest Featured Stock Update with an annotated graph appeared on 1/11/2013. Click here.
View all notes |
Alert me of new notes |
CANSLIM.net Company Profile |
SEC |
Zacks Reports |
StockTalk |
News |
Chart |
Request a new note
C
A N
S L
I M
|
MIDD
-
NASDAQ
Middleby Corp
MANUFACTURING - Diversified Machinery
|
$130.61
|
-1.31
-0.99% |
$131.58
|
52,048
60.24% of 50 DAV
50 DAV is 86,400
|
$134.51
-2.90%
|
10/8/2012
|
$118.46
|
PP = $122.67
|
|
MB = $128.80
|
Most Recent Note - 1/14/2013 5:50:33 PM
G - Holding its ground stubbornly near its 52-week and all-time highs with recent volume totals below average. Earnings +23% on +18% sales for the Sep '12 quarter, below the +25% minimum earnings guideline (C criteria), raised concerns. See latest FSU analysis for more details and a new annotated graph.
>>> The latest Featured Stock Update with an annotated graph appeared on 1/14/2013. Click here.
View all notes |
Alert me of new notes |
CANSLIM.net Company Profile |
SEC |
Zacks Reports |
StockTalk |
News |
Chart |
Request a new note
C
A N
S L
I M
|
N
-
NYSE
Netsuite Inc
DIVERSIFIED SERVICES - Business/Management Services
|
$67.10
|
-0.90
-1.32% |
$68.17
|
239,991
66.39% of 50 DAV
50 DAV is 361,500
|
$70.80
-5.23%
|
12/12/2012
|
$64.75
|
PP = $67.12
|
|
MB = $70.48
|
Most Recent Note - 1/15/2013 2:51:32 PM
Y - Perched near its 52-week high today. Recent gains above its pivot point have been marked by below average volume. Disciplined investors know that volume must be at least +40% above average behind gains above the pivot point to trigger a proper technical buy signal.
>>> The latest Featured Stock Update with an annotated graph appeared on 1/4/2013. Click here.
View all notes |
Alert me of new notes |
CANSLIM.net Company Profile |
SEC |
Zacks Reports |
StockTalk |
News |
Chart |
Request a new note
C
A N
S L
I M
|
Symbol/Exchange
Company Name
Industry Group |
PRICE |
CHANGE
(%Change) |
Day High |
Volume
(% DAV)
(% 50 day avg vol) |
52 Wk Hi
% From Hi |
Featured
Date |
Price
Featured |
Pivot Featured |
|
Max Buy |
NSR
-
NYSE
Neustar Inc
TELECOMMUNICATIONS - Diversified Communication Serv
|
$44.35
|
-0.19
-0.43% |
$44.68
|
200,939
48.29% of 50 DAV
50 DAV is 416,100
|
$44.82
-1.05%
|
12/11/2012
|
$41.85
|
PP = $41.41
|
|
MB = $43.48
|
 Most Recent Note - 1/16/2013 6:07:51 PM
G - Perched at its 52-week high today, extended from its prior base. Prior highs and its 50 DMA line coincide near $41 defining chart support to watch on pullbacks. See the latest FSU analysis for more details and a new annotated graph.
>>> The latest Featured Stock Update with an annotated graph appeared on 1/16/2013. Click here.
View all notes |
Alert me of new notes |
CANSLIM.net Company Profile |
SEC |
Zacks Reports |
StockTalk |
News |
Chart |
Request a new note
C
A N
S L
I M
|
RAX
-
NYSE
Rackspace Hosting Inc
INTERNET - Internet Software and; Services
|
$76.73
|
-0.85
-1.10% |
$77.72
|
1,188,606
88.31% of 50 DAV
50 DAV is 1,345,900
|
$78.62
-2.40%
|
12/18/2012
|
$71.88
|
PP = $70.10
|
|
MB = $73.61
|
Most Recent Note - 1/15/2013 2:50:13 PM
G - Volume totals have been cooling for the past week while holding its ground in a tight range near its all-time high. Extended from its prior base, meanwhile prior highs in the $70 area define initial support to watch.
>>> The latest Featured Stock Update with an annotated graph appeared on 1/8/2013. Click here.
View all notes |
Alert me of new notes |
CANSLIM.net Company Profile |
SEC |
Zacks Reports |
StockTalk |
News |
Chart |
Request a new note
C
A N
S L
I M
|
RNF
-
NYSE
Rentech Nitrogen Ptnr Lp
CHEMICALS - Agricultural Chemicals
|
$44.12
|
-2.75
-5.87% |
$46.64
|
1,180,843
379.69% of 50 DAV
50 DAV is 311,000
|
$48.19
-8.44%
|
11/1/2012
|
$39.11
|
PP = $40.15
|
|
MB = $42.16
|
Most Recent Note - 1/16/2013 12:28:03 PM
G - Down considerably today for a 3rd loss with above average volume in a 4-day span after getting extended from prior highs in the $40 area which define support to watch on pullbacks. Disciplined investors avoid chasing stocks extended more than +5% above prior highs following a technical breakout from a sound base.
>>> The latest Featured Stock Update with an annotated graph appeared on 1/9/2013. Click here.
View all notes |
Alert me of new notes |
CANSLIM.net Company Profile |
SEC |
Zacks Reports |
StockTalk |
News |
Chart |
Request a new note
C
A N
S L
I M
|
VRX
-
NYSE
Valeant Pharmaceuticals
DRUGS - Drug Manufacturers - Other
|
$63.52
|
-0.18
-0.28% |
$63.82
|
1,232,880
77.86% of 50 DAV
50 DAV is 1,583,500
|
$64.41
-1.38%
|
12/20/2012
|
$60.24
|
PP = $61.21
|
|
MB = $64.27
|
Most Recent Note - 1/14/2013 5:59:36 PM
Y - Hovering quietly above its pivot point and near its 52-week high today. Volume behind recent gains was below the +40% above average volume guideline which is the bare minimum threshold needed to trigger a proper technical buy signal. Disciplined investors may use a tactic called "pyramiding" to allow market action to dictate their positioning.
>>> The latest Featured Stock Update with an annotated graph appeared on 1/10/2013. Click here.
View all notes |
Alert me of new notes |
CANSLIM.net Company Profile |
SEC |
Zacks Reports |
StockTalk |
News |
Chart |
Request a new note
C
A N
S L
I M
|
|
|
|
THESE ARE NOT BUY RECOMMENDATIONS!
Comments contained in the body of this report are technical
opinions only. The material herein has been obtained
from sources believed to be reliable and accurate, however,
its accuracy and completeness cannot be guaranteed.
This site is not an investment advisor, hence it does
not endorse or recommend any securities or other investments.
Any recommendation contained in this report may not
be suitable for all investors and it is not to be deemed
an offer or solicitation on our part with respect to
the purchase or sale of any securities. All trademarks,
service marks and trade names appearing in this report
are the property of their respective owners, and are
likewise used for identification purposes only.
This report is a service available
only to active Paid Premium Members.
You may opt-out of receiving report notifications
at any time. Questions or comments may be submitted
by writing to Premium Membership Services 665 S.E. 10 Street, Suite 201 Deerfield Beach, FL 33441-5634 or by calling 1-800-965-8307
or 954-785-1121.
|
|
|

