You are not logged in.
This means you
CAN ONLY VIEW reports that were published prior to Monday, April 14, 2025.
You
MUST UPGRADE YOUR MEMBERSHIP if you want to see any current reports.
AFTER MARKET UPDATE - TUESDAY, JANUARY 15TH, 2013
Previous After Market Report Next After Market Report >>>
|
|
|
|
DOW |
+27.57 |
13,534.89 |
+0.20% |
|
Volume |
603,247,080 |
+2% |
|
Volume |
1,806,666,980 |
-1% |
|
NASDAQ |
-6.72 |
3,110.78 |
-0.22% |
|
Advancers |
1,735 |
56% |
|
Advancers |
1,314 |
51% |
|
S&P 500 |
+1.66 |
1,472.34 |
+0.11% |
|
Decliners |
1,272 |
41% |
|
Decliners |
1,142 |
44% |
|
Russell 2000 |
+4.50 |
884.60 |
+0.51% |
|
52 Wk Highs |
186 |
|
|
52 Wk Highs |
114 |
|
|
S&P 600 |
+2.47 |
493.98 |
+0.50% |
|
52 Wk Lows |
4 |
|
|
52 Wk Lows |
14 |
|
|
 |
Major Averages Ended Mixed Again With Mixed Volume Totals
Kenneth J. Gruneisen - Passed the CAN SLIM® Master's Exam
On Tuesday the major averages ended mixed and little changed as the debt ceiling debate in Washington weighed on investor sentiment. The volume totals were reported mixed, slightly higher on the NYSE and lower on the Nasdaq exchange. Advancers led decliners by nearly 3-2 on the NYSE and by a narrower margin on the Nasdaq exchange. The total number of stocks hitting new 52-week highs easily outnumbered new 52-week lows on the NYSE and on the Nasdaq exchange. There were 59 high-ranked companies from the CANSLIM.net Leaders List making new 52-week highs and appearing on the CANSLIM.net BreakOuts Page, down from the prior session total of 73 stocks. Any sustainable rally requires a healthy crop of companies hitting new 52-week highs, so it remains encouraging to see solid leadership. There were gains for 5 of the 9 high-ranked companies currently included on the Featured Stocks Page.
Uncertainty over fourth-quarter earnings also provided headwind as the pace of scheduled releases picks up. On the economic front, reports showed retail sales rose +0.5% while producer prices declined -0.2% in December. Manufacturing activity in New York contracted for a sixth consecutive month in January.
On the earnings front, homebuilder Lennar Corp (LEN -0.83%) edged lower following their quarterly profit tally. In other news, Lululemon Athletica Inc (LULU -3.91%) fell after the company lowered their current quarter earnings guidance. Tech was a notable laggard led by losses for Apple Inc (AAPL -3.15%) and Hewlett-Packard Co (HPQ -2.48%). Facebook Inc (FB -2.74%) fell after introducing a new search tool for its website. Dell Inc (DELL +7.16%) rose again on continued speculation the PC maker is in buyout talks. Telecom was the worst performing sector with Verizon Communications Inc (VZ -1.46%) down. Consumer stocks outperformed with discount retailer Big Lots Inc (BIG +3.58% ) advancing. In the financials, JP Morgan Chase & Co (JPM +1.02%) gained while The Goldman Sachs Group Inc (GS -0.40%) edged lower ahead of their earnings releases before the open Wednesday.
The 10-year note finished up 1/8 of a point to yield 1.83%.
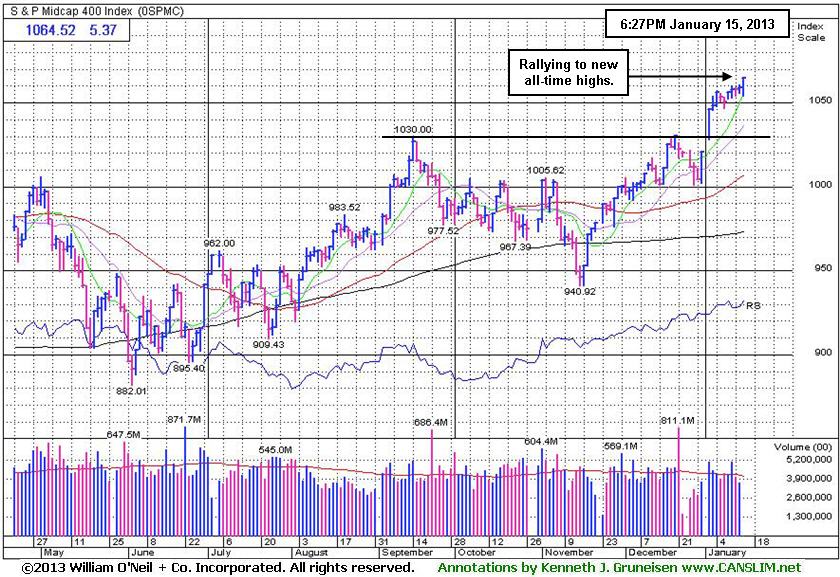
Investors may consider new buying efforts in stocks meeting all key criteria, as the market's (M criteria) confirmed uptrend showed a great expansion in leadership (stocks hitting new 52-week highs) after overcoming recent pressure. Solid gains helped the benchmark S&P 500 Index promptly rebound above its 50-day moving average (DMA) line, and Nasdaq Composite Index and Dow Jones Industrial Average both promptly rebounded above their respective 50 DMA and 200 DMA lines. All of the major averages then blasted above their December highs with additional volume-driven gains.
Watch for an announcement via email concerning the next WEBCAST. The webcast will also be available via an updated link highlighted at the top of the Premium Member Homepage.
PICTURED: The S&P Mid-Cap 400 Index is rallying for new all-time highs, which bodes well for the broader market outlook.
|
 Kenneth J. Gruneisen started out as a licensed stockbroker in August 1987, a couple of months prior to the historic stock market crash that took the Dow Jones Industrial Average down -22.6% in a single day. He has published daily fact-based fundamental and technical analysis on high-ranked stocks online for two decades. Through FACTBASEDINVESTING.COM, Kenneth provides educational articles, news, market commentary, and other information regarding proven investment systems that work in good times and bad.
Comments contained in the body of this report are technical opinions only and are not necessarily those of Gruneisen Growth Corp. The material herein has been obtained from sources believed to be reliable and accurate, however, its accuracy and completeness cannot be guaranteed. Our firm, employees, and customers may effect transactions, including transactions contrary to any recommendation herein, or have positions in the securities mentioned herein or options with respect thereto. Any recommendation contained in this report may not be suitable for all investors and it is not to be deemed an offer or solicitation on our part with respect to the purchase or sale of any securities. |
|
 |
Retail, Financial, Defensive, and Energy-Related Groups Rose
Kenneth J. Gruneisen - Passed the CAN SLIM® Master's Exam
The tech sector was mixed as the Semiconductor Index ($SOX -0.50%) edged lower, the Internet Index ($IIX -0.00%) finished flat, and the Biotechnology Index ($BTK +0.32%) and Networking Index ($NWX +1.02%) each posted gains. Financial shares were a positive influence as the Bank Index ($BKX +0.68%) and the Broker/Dealer Index ($XBD +0.48%) posted small gains, and the Retail Index ($RLX +0.99%) also gave the market a lift. Defensive groups had a positive bias as the Gold & Silver Index ($XAU +0.53%) and the Healthcare Index ($HMO +0.63%) tallied gains. Energy-related shares also gained ground as the Oil Services Index ($OSX +0.97%) and the Integrated Oil Index ($XOI +0.41%) traded higher.
Charts courtesy www.stockcharts.com
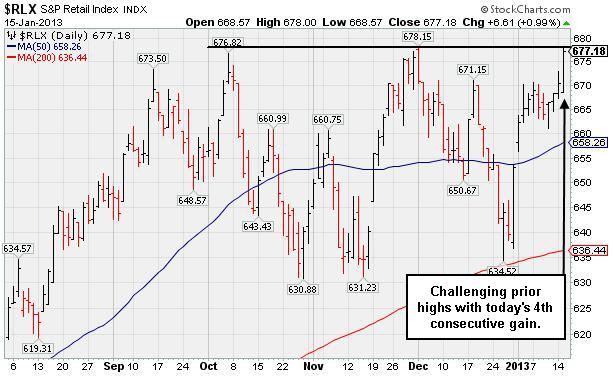
PICTURED: The Retail Index ($RLX +0.99%) is challenging prior highs with its 4th consecutive gain.
| Oil Services |
$OSX |
232.11 |
+2.24 |
+0.97% |
+5.43% |
| Healthcare |
$HMO |
2,560.17 |
+16.14 |
+0.63% |
+1.83% |
| Integrated Oil |
$XOI |
1,290.92 |
+5.25 |
+0.41% |
+3.95% |
| Semiconductor |
$SOX |
399.87 |
-2.02 |
-0.50% |
+4.12% |
| Networking |
$NWX |
243.32 |
+2.46 |
+1.02% |
+7.40% |
| Internet |
$IIX |
340.93 |
-0.00 |
-0.00% |
+4.26% |
| Broker/Dealer |
$XBD |
98.36 |
+0.47 |
+0.48% |
+4.27% |
| Retail |
$RLX |
677.18 |
+6.61 |
+0.99% |
+3.69% |
| Gold & Silver |
$XAU |
163.53 |
+0.87 |
+0.53% |
-1.25% |
| Bank |
$BKX |
53.31 |
+0.36 |
+0.68% |
+3.96% |
| Biotech |
$BTK |
1,665.39 |
+5.33 |
+0.32% |
+7.65% |
|
|
|
 |
Consolidating Above Support Following Breakout Gain
Kenneth J. Gruneisen - Passed the CAN SLIM® Master's Exam
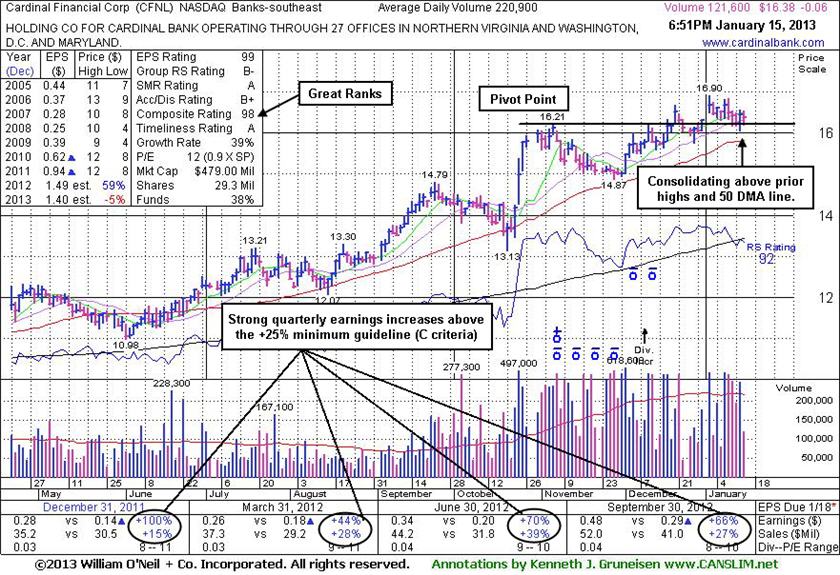
Cardinal Financial Corp's (CFNL -$0.06 or -0.36% to $16.38) has been finding support while consolidating above its prior highs, and it has been staying well above its 50-day moving average (DMA) line. It was last shown in this FSU section on 12/31/12 with an annotated graph under the headline, "Volume-Driven Gain Still Needed to Trigger Technical Buy Signal". Now it is still trading below its "max buy" level after the subsequent rally above its pivot point on 1/02/13 with +72% above average volume triggered a technical buy signal.
A gain above a stock's pivot point needs to be backed by at least +40% above average volume to trigger a proper new (or add-on) technical buy signal. Without sufficient volume conviction investors have less reason to believe a stock is attracting the great buying demand from the institutional crowd which is necessary for any meaningful advance in the shares' price. In this case, volume was well above the minimum threshold.
It stayed above the prior high ($14.79 on 9/24/12) defining important support during its prior consolidation. The high-ranked leader hailing from the Banks - Southeast industry group reported earnings +66% on +27% sales revenues for the quarter ended September 30, 2012 versus the year ago period, continuing its track record of strong quarterly earnings comparisons underpinned by encouraging sales revenues increases. It has earned high ranks and matches favorably with the C and A criteria. The number of top-rated funds owning its shares rose from 172 in Sep '11 to 190 in Dec '12, a reassuring trend concerning the I criteria. Its small supply (S criteria) of only 29.3 millions shares outstanding is a favorable characteristic, yet it can contribute to greater price volatility in the event of institutional accumulation or distributional pressure.
|
|
|
Color Codes Explained :
Y - Better candidates highlighted by our
staff of experts.
G - Previously featured
in past reports as yellow but may no longer be buyable under the
guidelines.
***Last / Change / Volume data in this table is the closing quote data***
Symbol/Exchange
Company Name
Industry Group |
PRICE |
CHANGE
(%Change) |
Day High |
Volume
(% DAV)
(% 50 day avg vol) |
52 Wk Hi
% From Hi |
Featured
Date |
Price
Featured |
Pivot Featured |
|
Max Buy |
CELG
-
NASDAQ
Celgene Corp
DRUGS - Drug Manufacturers - Major
|
$99.39
|
+1.72
1.76% |
$99.51
|
6,607,519
192.69% of 50 DAV
50 DAV is 3,429,100
|
$97.71
1.72%
|
12/11/2012
|
$82.24
|
PP = $81.34
|
|
MB = $85.41
|
 Most Recent Note - 1/15/2013 11:57:51 AM
G - Hit another new 52-week high today while on track for its 11th consecutive gain, very extended from its prior base. Having quickly rallied more than +20% in the first 2-3 weeks after a breakout, the investment system rules suggest holding such winners for a minimum of 8 weeks.
>>> The latest Featured Stock Update with an annotated graph appeared on 1/3/2013. Click here.
View all notes |
Alert me of new notes |
CANSLIM.net Company Profile |
SEC |
Zacks Reports |
StockTalk |
News |
Chart |
Request a new note
C
A N
S L
I M


|
CFNL
-
NASDAQ
Cardinal Financial Corp
BANKING - Regional - Southeast Banks
|
$16.38
|
-0.06
-0.36% |
$16.54
|
121,644
55.07% of 50 DAV
50 DAV is 220,900
|
$16.90
-3.08%
|
12/3/2012
|
$15.20
|
PP = $16.31
|
|
MB = $17.13
|
Most Recent Note - 1/15/2013 7:07:07 PM
Y - Finding support while consolidating above its prior highs. Still trading below its "max buy" level after the rally above its pivot point on 1/02/13 triggered a technical buy signal. See the latest FSU analysis for more details and a new annotated graph.
>>> The latest Featured Stock Update with an annotated graph appeared on 1/15/2013. Click here.
View all notes |
Alert me of new notes |
CANSLIM.net Company Profile |
SEC |
Zacks Reports |
StockTalk |
News |
Chart |
Request a new note
C
A N
S L
I M
|
CMCSA
-
NASDAQ
Comcast Corp Cl A
MEDIA - CATV Systems
|
$39.20
|
+0.28
0.72% |
$39.22
|
12,442,008
108.93% of 50 DAV
50 DAV is 11,421,900
|
$38.93
0.69%
|
12/3/2012
|
$37.08
|
PP = $38.06
|
|
MB = $39.96
|
Most Recent Note - 1/15/2013 11:59:40 AM
Y - Inching to another new 52-week high today. No resistance remains due to overhead supply. Its recent low defines initial support near its 50 DMA line
>>> The latest Featured Stock Update with an annotated graph appeared on 1/11/2013. Click here.
View all notes |
Alert me of new notes |
CANSLIM.net Company Profile |
SEC |
Zacks Reports |
StockTalk |
News |
Chart |
Request a new note
C
A N
S L
I M
|
MIDD
-
NASDAQ
Middleby Corp
MANUFACTURING - Diversified Machinery
|
$131.92
|
+0.48
0.37% |
$132.03
|
25,466
28.94% of 50 DAV
50 DAV is 88,000
|
$134.51
-1.93%
|
10/8/2012
|
$118.46
|
PP = $122.67
|
|
MB = $128.80
|
Most Recent Note - 1/14/2013 5:50:33 PM
G - Holding its ground stubbornly near its 52-week and all-time highs with recent volume totals below average. Earnings +23% on +18% sales for the Sep '12 quarter, below the +25% minimum earnings guideline (C criteria), raised concerns. See latest FSU analysis for more details and a new annotated graph.
>>> The latest Featured Stock Update with an annotated graph appeared on 1/14/2013. Click here.
View all notes |
Alert me of new notes |
CANSLIM.net Company Profile |
SEC |
Zacks Reports |
StockTalk |
News |
Chart |
Request a new note
C
A N
S L
I M
|
N
-
NYSE
Netsuite Inc
DIVERSIFIED SERVICES - Business/Management Services
|
$68.00
|
-0.18
-0.26% |
$68.79
|
214,671
58.59% of 50 DAV
50 DAV is 366,400
|
$70.80
-3.95%
|
12/12/2012
|
$64.75
|
PP = $67.12
|
|
MB = $70.48
|
Most Recent Note - 1/15/2013 2:51:32 PM
Y - Perched near its 52-week high today. Recent gains above its pivot point have been marked by below average volume. Disciplined investors know that volume must be at least +40% above average behind gains above the pivot point to trigger a proper technical buy signal.
>>> The latest Featured Stock Update with an annotated graph appeared on 1/4/2013. Click here.
View all notes |
Alert me of new notes |
CANSLIM.net Company Profile |
SEC |
Zacks Reports |
StockTalk |
News |
Chart |
Request a new note
C
A N
S L
I M
|
Symbol/Exchange
Company Name
Industry Group |
PRICE |
CHANGE
(%Change) |
Day High |
Volume
(% DAV)
(% 50 day avg vol) |
52 Wk Hi
% From Hi |
Featured
Date |
Price
Featured |
Pivot Featured |
|
Max Buy |
NSR
-
NYSE
Neustar Inc
TELECOMMUNICATIONS - Diversified Communication Serv
|
$44.54
|
+0.27
0.61% |
$44.82
|
282,262
67.29% of 50 DAV
50 DAV is 419,500
|
$44.66
-0.27%
|
12/11/2012
|
$41.85
|
PP = $41.41
|
|
MB = $43.48
|
Most Recent Note - 1/15/2013 2:54:28 PM
G - Touched a new 52-week high today with a small gain on light volume. Extended from its prior base, meanwhile, prior highs and its 50 DMA line coincide near $41 defining chart support to watch on pullbacks.
>>> The latest Featured Stock Update with an annotated graph appeared on 1/2/2013. Click here.
View all notes |
Alert me of new notes |
CANSLIM.net Company Profile |
SEC |
Zacks Reports |
StockTalk |
News |
Chart |
Request a new note
C
A N
S L
I M
|
RAX
-
NYSE
Rackspace Hosting Inc
INTERNET - Internet Software and; Services
|
$77.58
|
-0.07
-0.09% |
$78.22
|
714,052
52.06% of 50 DAV
50 DAV is 1,371,700
|
$78.62
-1.32%
|
12/18/2012
|
$71.88
|
PP = $70.10
|
|
MB = $73.61
|
Most Recent Note - 1/15/2013 2:50:13 PM
G - Volume totals have been cooling for the past week while holding its ground in a tight range near its all-time high. Extended from its prior base, meanwhile prior highs in the $70 area define initial support to watch.
>>> The latest Featured Stock Update with an annotated graph appeared on 1/8/2013. Click here.
View all notes |
Alert me of new notes |
CANSLIM.net Company Profile |
SEC |
Zacks Reports |
StockTalk |
News |
Chart |
Request a new note
C
A N
S L
I M
|
RNF
-
NYSE
Rentech Nitrogen Ptnr Lp
CHEMICALS - Agricultural Chemicals
|
$46.87
|
-0.39
-0.83% |
$48.19
|
437,791
136.85% of 50 DAV
50 DAV is 319,900
|
$47.44
-1.20%
|
11/1/2012
|
$39.11
|
PP = $40.15
|
|
MB = $42.16
|
Most Recent Note - 1/15/2013 3:00:11 PM
G - Trading up again today, getting very extended from prior highs in the $40 area which define support to watch on pullbacks. Disciplined investors avoid chasing stocks extended more than +5% above prior highs following a technical breakout from a sound base.
>>> The latest Featured Stock Update with an annotated graph appeared on 1/9/2013. Click here.
View all notes |
Alert me of new notes |
CANSLIM.net Company Profile |
SEC |
Zacks Reports |
StockTalk |
News |
Chart |
Request a new note
C
A N
S L
I M
|
VRX
-
NYSE
Valeant Pharmaceuticals
DRUGS - Drug Manufacturers - Other
|
$63.70
|
+0.12
0.19% |
$63.88
|
1,396,744
88.51% of 50 DAV
50 DAV is 1,578,000
|
$64.41
-1.10%
|
12/20/2012
|
$60.24
|
PP = $61.21
|
|
MB = $64.27
|
Most Recent Note - 1/14/2013 5:59:36 PM
Y - Hovering quietly above its pivot point and near its 52-week high today. Volume behind recent gains was below the +40% above average volume guideline which is the bare minimum threshold needed to trigger a proper technical buy signal. Disciplined investors may use a tactic called "pyramiding" to allow market action to dictate their positioning.
>>> The latest Featured Stock Update with an annotated graph appeared on 1/10/2013. Click here.
View all notes |
Alert me of new notes |
CANSLIM.net Company Profile |
SEC |
Zacks Reports |
StockTalk |
News |
Chart |
Request a new note
C
A N
S L
I M
|
|
|
|
THESE ARE NOT BUY RECOMMENDATIONS!
Comments contained in the body of this report are technical
opinions only. The material herein has been obtained
from sources believed to be reliable and accurate, however,
its accuracy and completeness cannot be guaranteed.
This site is not an investment advisor, hence it does
not endorse or recommend any securities or other investments.
Any recommendation contained in this report may not
be suitable for all investors and it is not to be deemed
an offer or solicitation on our part with respect to
the purchase or sale of any securities. All trademarks,
service marks and trade names appearing in this report
are the property of their respective owners, and are
likewise used for identification purposes only.
This report is a service available
only to active Paid Premium Members.
You may opt-out of receiving report notifications
at any time. Questions or comments may be submitted
by writing to Premium Membership Services 665 S.E. 10 Street, Suite 201 Deerfield Beach, FL 33441-5634 or by calling 1-800-965-8307
or 954-785-1121.
|
|
|

