You are not logged in.
This means you
CAN ONLY VIEW reports that were published prior to Monday, April 14, 2025.
You
MUST UPGRADE YOUR MEMBERSHIP if you want to see any current reports.
AFTER MARKET UPDATE - FRIDAY, JANUARY 15TH, 2010
Previous After Market Report Next After Market Report >>>
|
|
|
|
DOW |
-100.90 |
10,609.65 |
-0.94% |
|
Volume |
1,407,762,590 |
+59% |
|
Volume |
2,711,510,030 |
+18% |
|
NASDAQ |
-28.75 |
2,287.99 |
-1.24% |
|
Advancers |
935 |
30% |
|
Advancers |
722 |
26% |
|
S&P 500 |
-12.43 |
1,136.03 |
-1.08% |
|
Decliners |
2,110 |
67% |
|
Decliners |
2,001 |
71% |
|
Russell 2000 |
-8.47 |
637.96 |
-1.31% |
|
52 Wk Highs |
194 |
|
|
52 Wk Highs |
96 |
|
|
S&P 600 |
-4.02 |
338.54 |
-1.17% |
|
52 Wk Lows |
5 |
|
|
52 Wk Lows |
5 |
|
|
 |
Distributional Action As Earnings Season Kicks Off
Adam Sarhan, Contributing Writer,
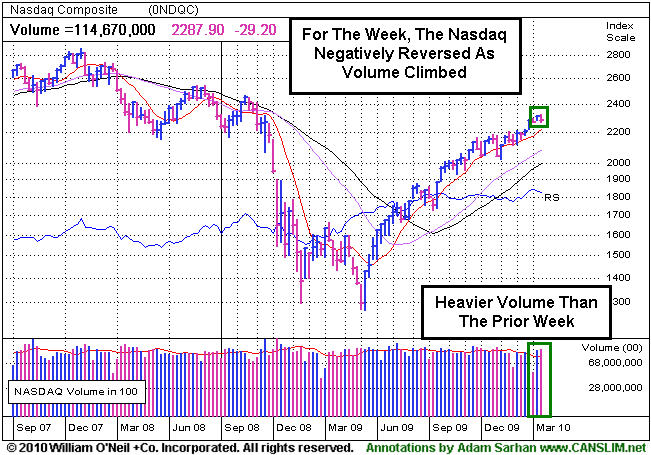
The major averages closed lower on Friday and for the week as investors digested a slew of economic and earnings data. Volume was reported higher than the prior session on the NYSE and on the Nasdaq exchange which marked a distribution day and suggested that large institutions were aggressively selling stocks. Decliners led advancers by over a 2-to-1 ratio on the NYSE and by nearly a 3-to-1 ratio on the Nasdaq exchange. There were only 15 high-ranked companies from the CANSLIM.net Leaders List that made a new 52-week high and appeared on the CANSLIM.net BreakOuts Page, lower than the total of 28 issues that appeared on the prior session. New 52-week highs still solidly outnumbered new 52-week lows on the NYSE and on the Nasdaq exchange.
On Monday, stocks ended mixed after China reported record imports and the US dollar declined. After Monday's closing bell, Alcoa Inc. (AA -1.14%) officially kicked off earnings season as the company reported lackluster fourth-quarter earnings which set a negative tone for the rest of the week. On Tuesday, the major averages collectively fell for the first time this year after a disappointing start to earnings season and China raised reserve limits for its banks. The move was designed to curb their explosive economic growth. Since the March bottom China has played a pivotal role in leading the global economy out of the worst recession since WWII. China has emerged as a strong economic engine for growth. The threat of an economic slowdown in China spooks many investors.
On Wednesday, stocks closed higher after Google (GOOG -1.67%) threatened to leave China, the world's largest internet market, on censorship concerns. Several of Wall Street's top bankers spent the morning testifying on Capital Hill about the 2007-2009 financial crisis. The bankers, whose companies collectively received more than $100 billion in government aid, spent hours explaining what happened during the crisis. The Financial Crisis Inquiry Commission was formed to examine and learn from what went wrong during that period. At 2:00PM EST, the Federal Reserve released its Beige Book which showed the economy continues to recover in many regions in the country.
On Thursday, it was encouraging to see stocks edge higher on weaker than expected economic data. Most of Thursday's headlines occurred before the open, The European Central Bank held rates steady and said they will wait for further economic recovery before withdrawing emergency stimulus measures. Domestically, two important economic reports were released at 8:30 AM EST: weekly jobless claims and last month's retail sales. Both reports missed views.
Stocks closed decidedly lower on Friday after a slew of economic data was released: a mild consumer price index (CPI), a stronger than expected manufacturing report from the NY region, a solid reading on Industrial production, and a weaker than expected reading on consumer sentiment. Longstanding readers of this column know how much importance we place on paying attention to how the market reacts to the latest data. That said, Friday's reaction was lackluster at best.
Several high profile companies reported their fourth quarter results but, so far, few have impressed the Street. The vast majority of companies are slated to report their Q4 results over the next few weeks which will give investors a better understanding of how companies fared last quarter. Analysts believe that the average company in the S&P 500 increased its earnings by +62% during the fourth quarter. If that occurs, that will be the first quarterly increase since 2007 and snap the longest consecutive losing streak in modern history!
For the most part, the major averages and leading stocks are beginning to weaken as investors continue to digest the slew of economic and earnings data being released everyday. Until a clear picture can be formed as to how companies fared last quarter one could easily expect to see more of this sideways action to continue. The market just completed its 45th week since the March lows and the rally remains intact as long as the major averages continue trading above their respective 50-day moving average (DMA) lines. Until those levels are breached, the bulls deserve the benefit of the doubt.
Professional Money Management Services - A Winning System - Inquire today!
Our skilled team of portfolio managers knows how to follow the rules of this fact-based investment system. We do not follow opinion or the "conviction list" of some large Wall Street institution which would have us fully invested even during horrific bear markets. Instead, we remain fluid and only buy the best stocks when they are triggering proper technical buy signals. If you are not completely satisfied with the way your portfolio is being managed, Click here to submit your inquiry. *Accounts over $250,000 please. ** Serious inquires only, please.
PICTURED: The Nasdaq Composite Index negatively reversed on heavier volume than the prior session (and also on the weekly graph shown).
|
|
|
 |
Closer Look at the Semiconductor and Retail Indexes Today
Kenneth J. Gruneisen - Passed the CAN SLIM® Master's Exam
The Healthcare Index ($HMO +0.41%) was a standout gainer while most industry groups ended Friday's session in the red. Many chip-related shares were smacked with large losses, and the Semiconductor Index ($SOX -3.44%) was one of the hardest hit tech indexes. Meanwhile, the Networking Index ($NWX -1.30%), Internet Index ($IIX -0.79%), and Biotechnology Index ($BTK -0.47%) each suffered smaller losses. Financial shares ended lower and had a negative influence on the major averages. The Bank Index ($BKX -2.16%) fell harder than the Broker/Dealer Index ($XBD -0.56%). Commodity-linked shares slid as the Gold & Silver Index ($XAU -2.05%), Oil Services Index ($OSX -1.27%), and Integrated Oil Index ($XOI -0.88%) ended unanimously lower to close the week.
Charts courtesy www.stockcharts.com
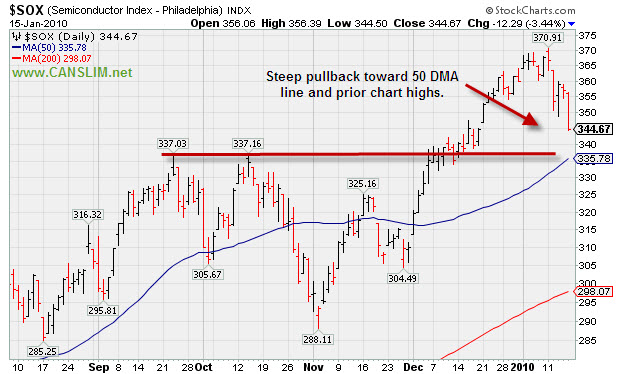
PICTURED 1: The Semiconductor Index ($SOX -3.44%) fell toward its prior chart highs and 50-day moving average line. If the index's action is indicative of the average stock in the group, the above clearly is suggesting that there could be further losses expected before any chart support is reached.
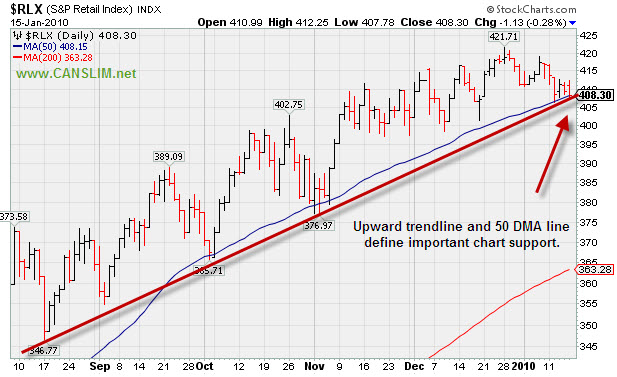 . .
PICTURED 2: The Retail Index ($RLX -0.28%) edged lower. Its upward trendline and 50-day moving average line define a support level presently being tested. Let the action in each individual issue be the determing factor, yet always be mindful of the group action. Group action has overwhelming influence!
| Oil Services |
$OSX |
210.78 |
-2.71 |
-1.27% |
+8.14% |
| Healthcare |
$HMO |
1,558.28 |
+6.44 |
+0.41% |
+5.79% |
| Integrated Oil |
$XOI |
1,091.80 |
-9.66 |
-0.88% |
+2.21% |
| Semiconductor |
$SOX |
344.67 |
-12.29 |
-3.44% |
-4.23% |
| Networking |
$NWX |
238.51 |
-3.13 |
-1.30% |
+3.22% |
| Internet |
$IIX |
233.53 |
-1.87 |
-0.79% |
-0.14% |
| Broker/Dealer |
$XBD |
117.93 |
-0.66 |
-0.56% |
+2.50% |
| Retail |
$RLX |
408.30 |
-1.13 |
-0.28% |
-0.69% |
| Gold & Silver |
$XAU |
172.78 |
-3.62 |
-2.05% |
+2.69% |
| Bank |
$BKX |
46.68 |
-1.03 |
-2.16% |
+9.30% |
| Biotech |
$BTK |
981.58 |
-4.66 |
-0.47% |
+4.19% |
|
|
|
 |
Damaging Distribution is Often a Sign of Danger
Kenneth J. Gruneisen - Passed the CAN SLIM® Master's Exam
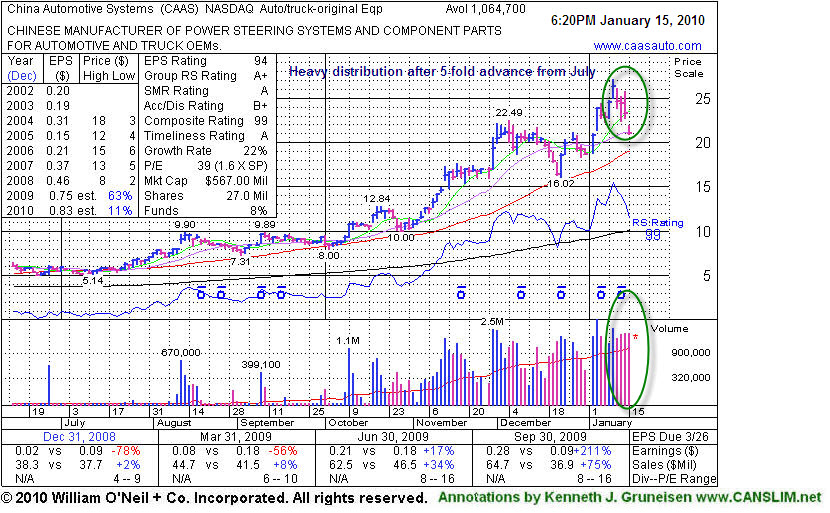
China Automotive Systems (CAAS -$2.21 or -9.51% to $21.03) gapped down today after an analyst downgrade, suffering its 4th consecutive loss on above average volume. It is heavy distributional pressure after a 5-fold run up since July 2009. Perhaps its ugly action is a hint it could be a wise time to be locking in profits rather than accumulating. CAAS was actually rather late-stage at $18.84 when first featured in the 11/30/09 mid-day report (read here). It is now extended from an ideal buy point and considered "damaged goods" although some might be watching for it to find support near previous resistance. It is usually best to avoid the temptation to buy apparent "bargains", and instead buy on signs of strength.
The daily chart below shows recent quarters with sales revenues accelerating greatly and earnings increases getting bigger, and it has a good annual earnings history (A criteria). Increasing ownership from a handful top-rated funds is encouraging news concerning the I criteria of the investment system, as the number of top-rated funds rose from 4 in Dec '09 to 9 in Sept '09. Meanwhile, the small supply of shares (S criteria) in its publicly traded float could contribute to great volatility in the event of more abrupt maneuvering by large and highly influential fund managers.
|
|
|
Color Codes Explained :
Y - Better candidates highlighted by our
staff of experts.
G - Previously featured
in past reports as yellow but may no longer be buyable under the
guidelines.
***Last / Change / Volume quote data in this table corresponds with the timestamp on the note***
Symbol/Exchange
Company Name
Industry Group |
Last |
Chg. |
Vol
% DAV |
Date Featured |
Price Featured |
Latest Pivot Point
Featured |
Status |
| Latest Max Buy Price |
ARST
-
|
$26.73
|
-0.26
|
423,455
82% DAV
518,700
|
12/22/2009
(Date
Featured) |
$25.94
(Price
Featured) |
PP = $27.20 |
G |
| MB = $28.56 |
Most Recent Note - 1/15/2010 5:51:29 PM
G - Quietly consolidating above its 50 DMA line after this week's worrisome bout of distributional pressure. ARST was first featured in yellow at $19.91 in the 9/01/09 mid-day report with an annotated daily graph (read here).
>>> The latest Featured Stock Update with an annotated graph appeared on 1/4/2010. click here.
|
|
C
A
S
I |
News |
Chart |
SEC
View all notes Alert
me of new notes
Company
Profile
|
ASIA
-
|
$28.80
|
-0.21
|
802,149
65% DAV
1,237,300
|
12/24/2009
(Date
Featured) |
$31.05
(Price
Featured) |
PP = $32.40 |
G |
| MB = $34.02 |
Most Recent Note - 1/15/2010 6:06:25 PM
G - Testing support at its 50-day moving average (DMA) line this week - always an important support level to watch. Traded up as much as +68.13% since first featured in the August 2009 CANSLIM.net News (read here).
>>> The latest Featured Stock Update with an annotated graph appeared on 1/12/2010. click here.
|
|
C
A
S
I |
News |
Chart |
SEC
View all notes Alert
me of new notes
Company
Profile
|
BIDU
- NASDAQ
Baidu Inc Ads
INTERNET - Internet Information Providers
|
$467.68
|
+3.45
|
4,643,860
270% DAV
1,720,500
|
1/13/2010
(Date
Featured) |
$431.25
(Price
Featured) |
PP = $426.75 |
G |
| MB = $448.09 |
Most Recent Note - 1/15/2010 6:13:17 PM
G - Hit another new all-time high today. Considerable gains this week helped it rebound above its 50 DMA line and quickly get extended from more than +5% above its pivot point from the latest "double bottom" base pattern. BIDU triggered a technical buy signal and was featured in yellow on 1/13/10 as it cleared the 12/29/09 high mentioned in the prior note (view all notes).
>>> The latest Featured Stock Update with an annotated graph appeared on 1/14/2010. click here.
|
|
C
A
S
I |
News |
Chart |
SEC
View all notes Alert
me of new notes
Company
Profile
|
CAAS
- NASDAQ
China Automotive Systems
AUTOMOTIVE - Auto Parts
|
$21.03
|
-2.21
|
2,120,830
199% DAV
1,064,700
|
11/30/2009
(Date
Featured) |
$18.84
(Price
Featured) |
PP = $17.62 |
G |
| MB = $18.50 |
Most Recent Note - 1/15/2010 6:29:57 PM
G - Gapped down today after an analyst downgrade, suffering its 4th consecutive loss on above average volume. It is heavy distributional pressure after a 5-fold run up since July 2009. Perhaps its ugly action is a hint it could be a time to be locking in profits rather than accumulating. CAAS was actually rather late=stage at $18.84 when first featured in the 11/30/09 mid-day report (read here).
>>> The latest Featured Stock Update with an annotated graph appeared on 1/15/2010. click here.
|
|
C
A
S
I |
News |
Chart |
SEC
View all notes Alert
me of new notes
Company
Profile
|
CACC
- NASDAQ
Credit Acceptance Corp
FINANCIAL SERVICES - Credit Services
|
$47.42
|
-0.58
|
37,442
83% DAV
45,100
|
9/29/2009
(Date
Featured) |
$33.48
(Price
Featured) |
PP = $37.10 |
G |
| MB = $38.96 |
Most Recent Note - 1/15/2010 6:32:57 PM
G - Stubbornly holding its ground perched near all-time highs, extended from any sound base. Previous chart high and 50 DMA line coincide in the $37 area, defining an important support level to watch.
>>> The latest Featured Stock Update with an annotated graph appeared on 1/8/2010. click here.
|
|
C
A
S
I |
News |
Chart |
SEC
View all notes Alert
me of new notes
Company
Profile
|
CRM
- NYSE
Salesforce.com Inc
INTERNET - Internet Software & Services
|
$68.63
|
-0.56
|
2,141,125
114% DAV
1,870,900
|
12/18/2009
(Date
Featured) |
$67.32
(Price
Featured) |
PP = $67.82 |
G |
| MB = $71.21 |
Most Recent Note - 1/15/2010 6:38:17 PM
G - Holding its ground above chart support previously noted after a damaging technical gap down this week. Large gap down on 1/12/10 was indicative of institutional activity (I criteria) - clear distributional pressure.
>>> The latest Featured Stock Update with an annotated graph appeared on 1/6/2010. click here.
|
|
C
A
S
I |
News |
Chart |
SEC
View all notes Alert
me of new notes
Company
Profile
|
CTRP
- NASDAQ
Ctrip.com Intl Ltd Adr
LEISURE - Resorts & Casinos
|
$72.75
|
-0.59
|
601,449
57% DAV
1,059,300
|
1/14/2010
(Date
Featured) |
$73.34
(Price
Featured) |
PP = $78.70 |
Y |
| MB = $82.64 |
Most Recent Note - 1/15/2010 6:39:56 PM
Y - Consolidating above important support at its 50 DMA line. Color code was changed to yellow based on its resilience, with a new pivot point noted based on its current flat base pattern.
>>> The latest Featured Stock Update with an annotated graph appeared on 12/30/2009. click here.
|
|
C
A
S
I |
News |
Chart |
SEC
View all notes Alert
me of new notes
Company
Profile
|
GMCR
- NASDAQ
Green Mtn Coffee Roastrs
FOOD & BEVERAGE - Processed & Packaged Goods
|
$80.41
|
-0.83
|
1,538,108
95% DAV
1,618,800
|
12/28/2009
(Date
Featured) |
$77.49
(Price
Featured) |
PP = $76.50 |
G |
| MB = $80.33 |
Most Recent Note - 1/15/2010 6:41:30 PM
G - Considerable loss today negated the bulk of the prior session's gain and was a sign of distributional pressure as it promptly pulled back after hitting a fresh 52-week high. Prior chart highs in the $76-77 area are important support levels to watch now.
>>> The latest Featured Stock Update with an annotated graph appeared on 1/13/2010. click here.
|
|
C
A
S
I |
News |
Chart |
SEC
View all notes Alert
me of new notes
Company
Profile
|
HEAT
-
|
$15.87
|
-0.32
|
614,606
52% DAV
1,172,500
|
1/6/2010
(Date
Featured) |
$17.19
(Price
Featured) |
PP = $17.27 |
G |
| MB = $18.13 |
Most Recent Note - 1/15/2010 6:49:48 PM
G - Its 4 consecutive losses and close below its 12/15/09 close ($16.59) is a clear sign of technical damage. Recent chart lows near $14 define the next important support level.
>>> The latest Featured Stock Update with an annotated graph appeared on 12/31/2009. click here.
|
|
C
A
S
I |
News |
Chart |
SEC
View all notes Alert
me of new notes
Company
Profile
|
LFT
-
|
$38.15
|
-0.20
|
620,090
147% DAV
422,500
|
11/17/2009
(Date
Featured) |
$31.77
(Price
Featured) |
PP = $33.04 |
G |
| MB = $34.69 |
Most Recent Note - 1/15/2010 6:50:42 PM
G - Held its ground after a big loss on 1/13/10 with above average volume indicated more worrisome distributional pressure. Its 50 DMA line near $35 has been previously noted as an initial support level to watch on pullbacks. Its fundamentals remain strong.
>>> The latest Featured Stock Update with an annotated graph appeared on 1/5/2010. click here.
|
|
C
A
S
I |
News |
Chart |
SEC
View all notes Alert
me of new notes
Company
Profile
|
PEGA
- NASDAQ
Pegasystems Inc
COMPUTER SOFTWARE & SERVICES - Business Software & Services
|
$34.29
|
-0.88
|
181,223
83% DAV
217,600
|
1/4/2010
(Date
Featured) |
$34.00
(Price
Featured) |
PP = $36.19 |
Y |
| MB = $38.00 |
Most Recent Note - 1/15/2010 6:51:49 PM
Y - Quietly perched near all-time highs with no resistance remaining due to overhead supply. Featured in the January 2010 issue of CANSLIM.net News (read here).
>>> The latest Featured Stock Update with an annotated graph appeared on 1/3/2010. click here.
|
|
C
A
S
I |
News |
Chart |
SEC
View all notes Alert
me of new notes
Company
Profile
|
VIT
-
|
$19.35
|
-0.64
|
511,405
91% DAV
560,700
|
12/24/2009
(Date
Featured) |
$20.07
(Price
Featured) |
PP = $21.17 |
Y |
| MB = $22.23 |
Most Recent Note - 1/15/2010 6:53:17 PM
Y - Lost ground again on lighter volume, after distributional pressure in the past week raised concerns. It abruptly reversed under its pivot point following its big 1/06/10 gain on heavy volume and 1/11/10 gain on +36% above average volume.
>>> The latest Featured Stock Update with an annotated graph appeared on 1/11/2010. click here.
|
|
C
A
S
I |
News |
Chart |
SEC
View all notes Alert
me of new notes
Company
Profile
|
|
|
|
THESE ARE NOT BUY RECOMMENDATIONS!
Comments contained in the body of this report are technical
opinions only. The material herein has been obtained
from sources believed to be reliable and accurate, however,
its accuracy and completeness cannot be guaranteed.
This site is not an investment advisor, hence it does
not endorse or recommend any securities or other investments.
Any recommendation contained in this report may not
be suitable for all investors and it is not to be deemed
an offer or solicitation on our part with respect to
the purchase or sale of any securities. All trademarks,
service marks and trade names appearing in this report
are the property of their respective owners, and are
likewise used for identification purposes only.
This report is a service available
only to active Paid Premium Members.
You may opt-out of receiving report notifications
at any time. Questions or comments may be submitted
by writing to Premium Membership Services 665 S.E. 10 Street, Suite 201 Deerfield Beach, FL 33441-5634 or by calling 1-800-965-8307
or 954-785-1121.
|
|
|


