You are not logged in.
This means you
CAN ONLY VIEW reports that were published prior to Monday, April 14, 2025.
You
MUST UPGRADE YOUR MEMBERSHIP if you want to see any current reports.
AFTER MARKET UPDATE - MONDAY, JANUARY 14TH, 2013
Previous After Market Report Next After Market Report >>>
|
|
|
|
DOW |
+18.89 |
13,507.32 |
+0.14% |
|
Volume |
590,485,300 |
-7% |
|
Volume |
1,831,813,250 |
+7% |
|
NASDAQ |
-8.13 |
3,117.50 |
-0.26% |
|
Advancers |
1,490 |
48% |
|
Advancers |
1,153 |
45% |
|
S&P 500 |
-1.37 |
1,470.68 |
-0.09% |
|
Decliners |
1,497 |
48% |
|
Decliners |
1,292 |
50% |
|
Russell 2000 |
-0.67 |
880.10 |
-0.08% |
|
52 Wk Highs |
222 |
|
|
52 Wk Highs |
132 |
|
|
S&P 600 |
-0.55 |
491.51 |
-0.11% |
|
52 Wk Lows |
3 |
|
|
52 Wk Lows |
7 |
|
|
 |
Major Averages Ended Mixed With Mixed Volume Totals
Kenneth J. Gruneisen - Passed the CAN SLIM® Master's Exam
The major averages finished mixed and little changed on Monday. The volume totals were reported mixed, lighter on the NYSE and higher on the Nasdaq exchange. Decliners narrowly led advancers on the NYSE and on the Nasdaq exchange. The total number of stocks hitting new 52-week highs easily outnumbered new 52-week lows on the NYSE and on the Nasdaq exchange. New 52-week lows totals were in the single digits on both the NYSE and on the Nasdaq exchange.There were 73 high-ranked companies from the CANSLIM.net Leaders List making new 52-week highs and appearing on the CANSLIM.net BreakOuts Page, down from the prior session total of 77 stocks. Any sustainable rally requires a healthy crop of companies hitting new 52-week highs, so it remains encouraging to see solid leadership. There were gains for 5 of the 10 high-ranked companies currently included on the Featured Stocks Page.
The major averages traded in a narrow range. With no scheduled economic reports, investor attention was on the Fed with Chairman Ben Bernanke slated to speak at the University of Michigan after the close.
A decline in Apple Inc (AAPL -3.57%) came after reports the company cut orders for iPhone components due to weaker demand. Dell Inc (DELL +12.96%) rose on a report the company is in buyout talks with private equity firms. In the financials, Bank of America Corp (BAC -1.38%) fell ahead of its scheduled earnings release later this week. Telecom was the worst performing group. Sprint Nextel Corp (S -3.89%) and Verizon Communications Inc (VZ -1.64%) finished lower. Consumer and industrial stocks were the best performing areas. Coach Inc (COH +3.67%) gained and United Parcel Service Inc (UPS +1.69%) rose after the company ended its bid to acquire European rival TNT Express.
The 10-year note was up 5/32 to yield 1.85%.
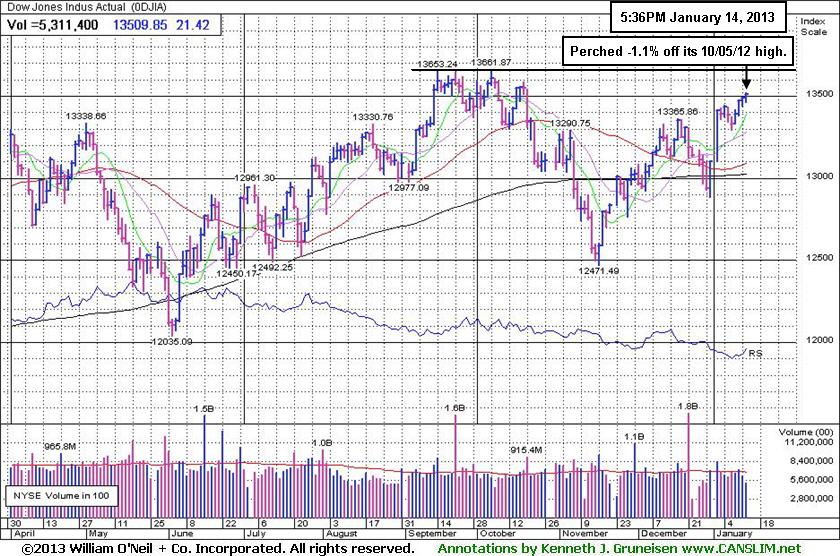
Investors may consider new buying efforts in stocks meeting all key criteria, as the market's (M criteria) confirmed uptrend showed a great expansion in leadership (stocks hitting new 52-week highs) after overcoming recent pressure. Solid gains helped the benchmark S&P 500 Index promptly rebound above its 50-day moving average (DMA) line, and Nasdaq Composite Index and Dow Jones Industrial Average both promptly rebounded above their respective 50 DMA and 200 DMA lines. All of the major averages then blasted above their December highs with additional volume-driven gains.
Watch for an announcement via email concerning the next WEBCAST. The webcast will also be available via an updated link highlighted at the top of the Premium Member Homepage.
PICTURED: The Dow Jones Industrial Average is currently perched within -1.12% of its 10/05/12 high. Any meaningful rally above the old high might be viewed as a bullish technical signal which would bode well for the broader market outloo
|
 Kenneth J. Gruneisen started out as a licensed stockbroker in August 1987, a couple of months prior to the historic stock market crash that took the Dow Jones Industrial Average down -22.6% in a single day. He has published daily fact-based fundamental and technical analysis on high-ranked stocks online for two decades. Through FACTBASEDINVESTING.COM, Kenneth provides educational articles, news, market commentary, and other information regarding proven investment systems that work in good times and bad.
Comments contained in the body of this report are technical opinions only and are not necessarily those of Gruneisen Growth Corp. The material herein has been obtained from sources believed to be reliable and accurate, however, its accuracy and completeness cannot be guaranteed. Our firm, employees, and customers may effect transactions, including transactions contrary to any recommendation herein, or have positions in the securities mentioned herein or options with respect thereto. Any recommendation contained in this report may not be suitable for all investors and it is not to be deemed an offer or solicitation on our part with respect to the purchase or sale of any securities. |
|
 |
Tech and Retail Gains Offset Weaker Groups
Kenneth J. Gruneisen - Passed the CAN SLIM® Master's Exam
The Bank Index ($BKX -0.43%) and Broker/Dealer Index ($XBD -0.27%) edged lower while the Retail Index ($RLX +0.34%) posted a gain. Energy-related shares were mixed as the Oil Services Index ($OSX -0.98%) fell and the Integrated Oil Index ($XOI +0.28%) posted a small gain. Defensive groups were mixed as the Gold & Silver Index ($XAU -0.43%) fell and the Healthcare Index ($HMO +0.66%) posted a small gain. The tech sector was led higher by the Biotechnology Index ($BTK +1.33%) and the Networking Index ($NWX +1.60%) followed by a smaller gain from the Internet Index ($IIX +0.23%), meanwhile the Semiconductor Index ($SOX -0.24%) edged lower.
Charts courtesy www.stockcharts.com
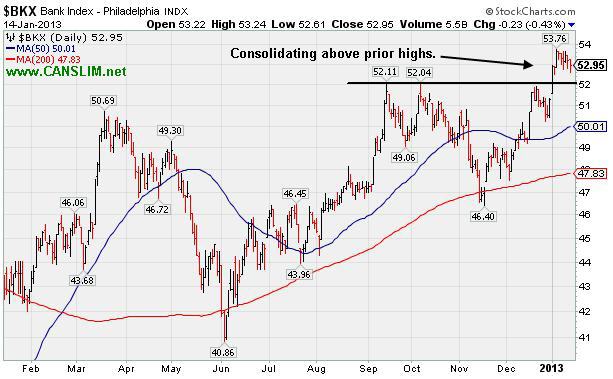
PICTURED: The Bank Index ($BKX -0.43%) is consolidating above prior highs.
| Oil Services |
$OSX |
229.87 |
-2.28 |
-0.98% |
+4.41% |
| Healthcare |
$HMO |
2,544.03 |
+16.73 |
+0.66% |
+1.19% |
| Integrated Oil |
$XOI |
1,285.67 |
+3.55 |
+0.28% |
+3.53% |
| Semiconductor |
$SOX |
401.89 |
-0.97 |
-0.24% |
+4.64% |
| Networking |
$NWX |
240.86 |
+3.80 |
+1.60% |
+6.31% |
| Internet |
$IIX |
340.93 |
+0.80 |
+0.23% |
+4.26% |
| Broker/Dealer |
$XBD |
97.89 |
-0.27 |
-0.27% |
+3.78% |
| Retail |
$RLX |
670.57 |
+2.25 |
+0.34% |
+2.68% |
| Gold & Silver |
$XAU |
162.66 |
-0.70 |
-0.43% |
-1.78% |
| Bank |
$BKX |
52.95 |
-0.23 |
-0.43% |
+3.26% |
| Biotech |
$BTK |
1,660.06 |
+21.75 |
+1.33% |
+7.31% |
|
|
|
 |
Found Technical Support But Fundamental Flaws Remain a Concern
Kenneth J. Gruneisen - Passed the CAN SLIM® Master's Exam
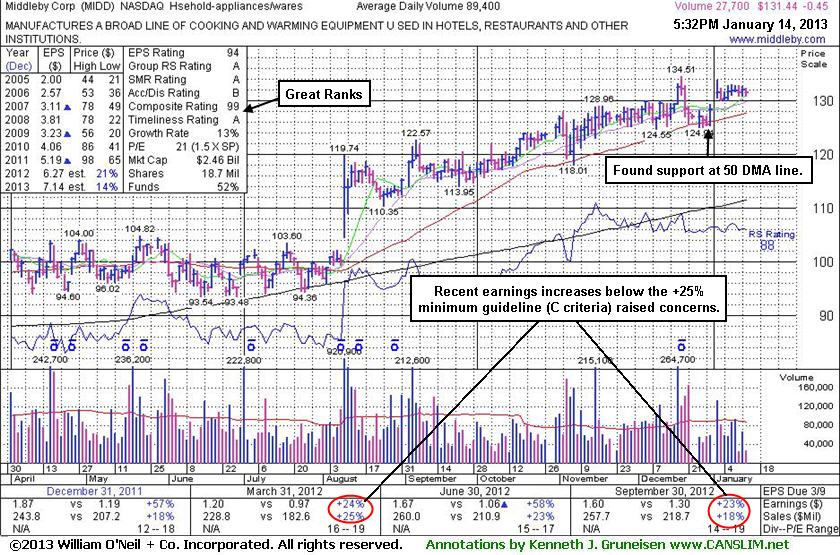
Middleby Corp (MIDD -0.45 or -0.34% to $131.44) is holding its ground stubbornly near its 52-week and all-time highs with recent volume totals below average. Earnings +23% on +18% sales for the Sep '12 quarter, below the +25% minimum earnings guideline (C criteria), raised concerns. Its last appearance in this FSU section was on 12/26/12 with an annotated graph under the headline, "Following Distributional Action 50-Day Average Acted as Support". That followed 3 consecutive losses with above average volume and increasing volume, enduring distributional pressure after a negative reversal on 12/19/12 at its new 52-week and all-time high.
Prior reports cautioned members - "Disciplined investors may watch closely for sell signals if holding it and giving it a chance to produce more climactic gains. Its 50-day moving average (DMA) line defines near-term chart support to watch where any violation would trigger a technical sell signal. It reported earnings +23% on +18% sales for the Sep '12 quarter, below the +25% minimum earnings guideline (C criteria), raising fundamental concerns. Prior reports also cautioned that its annual earnings (A criteria) had a downturn in FY '09, yet they have otherwise been good and steady."
The number of top-rated funds owning its shares rose from 351 in Dec '11 to 388 in Dec '12, a reassuring sign concerning the I criteria. Today its current Up/Down Volume Ratio of 1.5 is an unbiased indication its shares have been under accumulation over the past 50 days. Its small supply (S criteria) of only 17.1 million shares in the public float can contribute to greater price volatility in the event of institutional buying or selling.
Investors who are disciplined, selective, and patient would likely watch for a fresh breakout in another high-ranked stock without any fundamental flaws, rather than looking for excuses to buy one with flaws.
|
|
|
Color Codes Explained :
Y - Better candidates highlighted by our
staff of experts.
G - Previously featured
in past reports as yellow but may no longer be buyable under the
guidelines.
***Last / Change / Volume data in this table is the closing quote data***
Symbol/Exchange
Company Name
Industry Group |
PRICE |
CHANGE
(%Change) |
Day High |
Volume
(% DAV)
(% 50 day avg vol) |
52 Wk Hi
% From Hi |
Featured
Date |
Price
Featured |
Pivot Featured |
|
Max Buy |
CELG
-
NASDAQ
Celgene Corp
DRUGS - Drug Manufacturers - Major
|
$97.67
|
+1.37
1.42% |
$97.71
|
4,220,818
124.32% of 50 DAV
50 DAV is 3,395,100
|
$96.33
1.39%
|
12/11/2012
|
$82.24
|
PP = $81.34
|
|
MB = $85.41
|
Most Recent Note - 1/11/2013 11:58:39 AM
G - Perched at its 52-week high today after a streak of 8 consecutive gains, very extended from its prior base. Prior highs near $81-82 define initial support to watch on pullbacks.
>>> The latest Featured Stock Update with an annotated graph appeared on 1/3/2013. Click here.
View all notes |
Alert me of new notes |
CANSLIM.net Company Profile |
SEC |
Zacks Reports |
StockTalk |
News |
Chart |
Request a new note
C
A N
S L
I M


|
CFNL
-
NASDAQ
Cardinal Financial Corp
BANKING - Regional - Southeast Banks
|
$16.44
|
+0.20
1.23% |
$16.55
|
251,209
114.55% of 50 DAV
50 DAV is 219,300
|
$16.90
-2.72%
|
12/3/2012
|
$15.20
|
PP = $16.31
|
|
MB = $17.13
|
 Most Recent Note - 1/14/2013 5:53:33 PM
Y - Gain with above average volume today, finding support while consolidating above its prior highs. Still trading below its "max buy" level after the rally above its pivot point on 1/02/13 triggered a technical buy signal.
>>> The latest Featured Stock Update with an annotated graph appeared on 12/31/2012. Click here.
View all notes |
Alert me of new notes |
CANSLIM.net Company Profile |
SEC |
Zacks Reports |
StockTalk |
News |
Chart |
Request a new note
C
A N
S L
I M
|
CMCSA
-
NASDAQ
Comcast Corp Cl A
MEDIA - CATV Systems
|
$38.92
|
+0.46
1.20% |
$38.93
|
8,626,824
74.54% of 50 DAV
50 DAV is 11,573,400
|
$38.76
0.41%
|
12/3/2012
|
$37.08
|
PP = $38.06
|
|
MB = $39.96
|
Most Recent Note - 1/11/2013 5:36:26 PM
Y - It managed an impressive "positive reversal" on Tuesday after dipping near its 50 DMA line. Hovering near its 52-week high since its gain above its pivot point on 1/02/12 triggered a technical buy signal. No resistance remains due to overhead supply. See the latest FSU analysis for more details and a new annotated graph.
>>> The latest Featured Stock Update with an annotated graph appeared on 1/11/2013. Click here.
View all notes |
Alert me of new notes |
CANSLIM.net Company Profile |
SEC |
Zacks Reports |
StockTalk |
News |
Chart |
Request a new note
C
A N
S L
I M
|
LULU
-
NASDAQ
Lululemon Athletica
MANUFACTURING - Textile Manufacturing
|
$72.30
|
+1.46
2.06% |
$72.60
|
3,779,406
186.91% of 50 DAV
50 DAV is 2,022,000
|
$81.09
-10.84%
|
12/26/2012
|
$73.81
|
PP = $77.95
|
|
MB = $81.85
|
Most Recent Note - 1/14/2013 5:57:23 PM
Rebounded above its 50 DMA line with today's volume-driven gain helping its technical stance. However, its Relative Strength rank has slumped well below the 80+ minimum guideline for buy candidates, and it will be dropped from the Featured Stocks list tonight. It faces resistance due to overhead supply up through the $81 level.
>>> The latest Featured Stock Update with an annotated graph appeared on 12/28/2012. Click here.
View all notes |
Alert me of new notes |
CANSLIM.net Company Profile |
SEC |
Zacks Reports |
StockTalk |
News |
Chart |
Request a new note
C
A N
S L
I M
|
MIDD
-
NASDAQ
Middleby Corp
MANUFACTURING - Diversified Machinery
|
$131.44
|
-0.45
-0.34% |
$132.30
|
27,781
31.07% of 50 DAV
50 DAV is 89,400
|
$134.51
-2.28%
|
10/8/2012
|
$118.46
|
PP = $122.67
|
|
MB = $128.80
|
Most Recent Note - 1/14/2013 5:50:33 PM
G - Holding its ground stubbornly near its 52-week and all-time highs with recent volume totals below average. Earnings +23% on +18% sales for the Sep '12 quarter, below the +25% minimum earnings guideline (C criteria), raised concerns. See latest FSU analysis for more details and a new annotated graph.
>>> The latest Featured Stock Update with an annotated graph appeared on 1/14/2013. Click here.
View all notes |
Alert me of new notes |
CANSLIM.net Company Profile |
SEC |
Zacks Reports |
StockTalk |
News |
Chart |
Request a new note
C
A N
S L
I M
|
Symbol/Exchange
Company Name
Industry Group |
PRICE |
CHANGE
(%Change) |
Day High |
Volume
(% DAV)
(% 50 day avg vol) |
52 Wk Hi
% From Hi |
Featured
Date |
Price
Featured |
Pivot Featured |
|
Max Buy |
N
-
NYSE
Netsuite Inc
DIVERSIFIED SERVICES - Business/Management Services
|
$68.18
|
-0.59
-0.86% |
$68.89
|
402,374
107.01% of 50 DAV
50 DAV is 376,000
|
$70.80
-3.70%
|
12/12/2012
|
$64.75
|
PP = $67.12
|
|
MB = $70.48
|
Most Recent Note - 1/9/2013 5:43:06 PM
Y - Gains above its pivot point have been marked by below average volume. Disciplined investors know that volume must be at least +40% above average behind gains above the pivot point to trigger a proper technical buy signal.
>>> The latest Featured Stock Update with an annotated graph appeared on 1/4/2013. Click here.
View all notes |
Alert me of new notes |
CANSLIM.net Company Profile |
SEC |
Zacks Reports |
StockTalk |
News |
Chart |
Request a new note
C
A N
S L
I M
|
NSR
-
NYSE
Neustar Inc
TELECOMMUNICATIONS - Diversified Communication Serv
|
$44.27
|
-0.08
-0.18% |
$44.66
|
256,933
60.63% of 50 DAV
50 DAV is 423,800
|
$44.39
-0.27%
|
12/11/2012
|
$41.85
|
PP = $41.41
|
|
MB = $43.48
|
Most Recent Note - 1/11/2013 5:34:28 PM
G - Color code is changed to green again after rallying above its "max buy" level with today's light volume gain. Prior highs and its 50 DMA line define support to watch on pullbacks.
>>> The latest Featured Stock Update with an annotated graph appeared on 1/2/2013. Click here.
View all notes |
Alert me of new notes |
CANSLIM.net Company Profile |
SEC |
Zacks Reports |
StockTalk |
News |
Chart |
Request a new note
C
A N
S L
I M
|
RAX
-
NYSE
Rackspace Hosting Inc
INTERNET - Internet Software and; Services
|
$77.65
|
-0.18
-0.23% |
$78.62
|
651,348
47.08% of 50 DAV
50 DAV is 1,383,400
|
$78.36
-0.91%
|
12/18/2012
|
$71.88
|
PP = $70.10
|
|
MB = $73.61
|
Most Recent Note - 1/8/2013 2:46:54 PM
G - Inching to another new all-time high with today's gain lacking great volume conviction. Getting extended from its prior base, meanwhile prior highs in the $70 area define initial support to watch.
>>> The latest Featured Stock Update with an annotated graph appeared on 1/8/2013. Click here.
View all notes |
Alert me of new notes |
CANSLIM.net Company Profile |
SEC |
Zacks Reports |
StockTalk |
News |
Chart |
Request a new note
C
A N
S L
I M
|
RNF
-
NYSE
Rentech Nitrogen Ptnr Lp
CHEMICALS - Agricultural Chemicals
|
$47.26
|
+1.19
2.58% |
$47.44
|
363,984
114.14% of 50 DAV
50 DAV is 318,900
|
$46.88
0.81%
|
11/1/2012
|
$39.11
|
PP = $40.15
|
|
MB = $42.16
|
Most Recent Note - 1/11/2013 12:40:08 PM
G - Very extended after a streak of 9 consecutive gains, its prior highs in the $40 area define initial support to watch on pullbacks. Disciplined investors avoid chasing stocks extended more than +5% above prior highs following a technical breakout from a sound base.
>>> The latest Featured Stock Update with an annotated graph appeared on 1/9/2013. Click here.
View all notes |
Alert me of new notes |
CANSLIM.net Company Profile |
SEC |
Zacks Reports |
StockTalk |
News |
Chart |
Request a new note
C
A N
S L
I M
|
VRX
-
NYSE
Valeant Pharmaceuticals
DRUGS - Drug Manufacturers - Other
|
$63.58
|
-0.05
-0.08% |
$63.73
|
694,934
43.83% of 50 DAV
50 DAV is 1,585,400
|
$64.41
-1.29%
|
12/20/2012
|
$60.24
|
PP = $61.21
|
|
MB = $64.27
|
Most Recent Note - 1/14/2013 5:59:36 PM
Y - Hovering quietly above its pivot point and near its 52-week high today. Volume behind recent gains was below the +40% above average volume guideline which is the bare minimum threshold needed to trigger a proper technical buy signal. Disciplined investors may use a tactic called "pyramiding" to allow market action to dictate their positioning.
>>> The latest Featured Stock Update with an annotated graph appeared on 1/10/2013. Click here.
View all notes |
Alert me of new notes |
CANSLIM.net Company Profile |
SEC |
Zacks Reports |
StockTalk |
News |
Chart |
Request a new note
C
A N
S L
I M
|
Symbol/Exchange
Company Name
Industry Group |
PRICE |
CHANGE
(%Change) |
Day High |
Volume
(% DAV)
(% 50 day avg vol) |
52 Wk Hi
% From Hi |
Featured
Date |
Price
Featured |
Pivot Featured |
|
Max Buy |
|
|
|
THESE ARE NOT BUY RECOMMENDATIONS!
Comments contained in the body of this report are technical
opinions only. The material herein has been obtained
from sources believed to be reliable and accurate, however,
its accuracy and completeness cannot be guaranteed.
This site is not an investment advisor, hence it does
not endorse or recommend any securities or other investments.
Any recommendation contained in this report may not
be suitable for all investors and it is not to be deemed
an offer or solicitation on our part with respect to
the purchase or sale of any securities. All trademarks,
service marks and trade names appearing in this report
are the property of their respective owners, and are
likewise used for identification purposes only.
This report is a service available
only to active Paid Premium Members.
You may opt-out of receiving report notifications
at any time. Questions or comments may be submitted
by writing to Premium Membership Services 665 S.E. 10 Street, Suite 201 Deerfield Beach, FL 33441-5634 or by calling 1-800-965-8307
or 954-785-1121.
|
|
|

