You are not logged in.
This means you
CAN ONLY VIEW reports that were published prior to Monday, April 21, 2025.
You
MUST UPGRADE YOUR MEMBERSHIP if you want to see any current reports.
AFTER MARKET UPDATE - THURSDAY, JANUARY 14TH, 2010
Previous After Market Report Next After Market Report >>>
|
|
|
|
DOW |
+29.78 |
10,710.55 |
+0.28% |
|
Volume |
888,126,190 |
-8% |
|
Volume |
2,303,984,730 |
-3% |
|
NASDAQ |
+8.84 |
2,316.74 |
+0.38% |
|
Advancers |
1,724 |
55% |
|
Advancers |
1,580 |
56% |
|
S&P 500 |
+2.97 |
1,148.65 |
+0.26% |
|
Decliners |
1,294 |
41% |
|
Decliners |
1,114 |
39% |
|
Russell 2000 |
+3.48 |
647.04 |
+0.54% |
|
52 Wk Highs |
295 |
|
|
52 Wk Highs |
143 |
|
|
S&P 600 |
+1.93 |
342.92 |
+0.57% |
|
52 Wk Lows |
1 |
|
|
52 Wk Lows |
2 |
|
|
 |
Major Averages Post Small Gains On Light Volume
Adam Sarhan, Contributing Writer,
Stocks edged higher on weaker than expected economic data. Volume was reported slightly lighter and near the prior session's totals on the NYSE and on the Nasdaq exchange while the overall action suggested that large institutions were not aggressively buying stocks. Advancers led decliners by nearly a 3-to-2 ratio on the NYSE and on the Nasdaq exchange. There were 28 high-ranked companies from the CANSLIM.net Leaders List that made a new 52-week high and appeared on the CANSLIM.net BreakOuts Page, higher than the total of 20 issues that appeared on the prior session. New 52-week highs still solidly outnumbered new 52-week lows on the NYSE and on the Nasdaq exchange and new lows fell to single digits.
Most of Thursday's important headlines occurred before the opening bell. The European Central Bank held rates steady and said they will wait for further economic recovery before withdrawing emergency stimulus measures. Domestically, two important economic reports were released at 8:30 AM EST: weekly jobless claims and last month's retail sales. The Labor Department said that first-time unemployment (aka. jobless) claims rose more than forecast to 444,000 last week. The 11,000 increase was offset by another decline in the four-week average, down 9,000 to 440,750. It is important to note that the four-week average has declined for 19 straight weeks which clearly indicates a sharp improvement in the labor market. Elsewhere, retail sales unexpectedly fell -0.3% in December after a +1.8% increase in November. December's reading fell short of the Street's estimate for a +0.4% increase which caught many analysts by surprise.
Companies continued reporting their fourth quarter results but the vast majority are expected to report over the next few weeks. Next week alone, sixty-six companies in the S&P 500 are slated to report their fourth quarter results which will give investors a better understanding of how companies fared last quarter. Analysts believe that the average company in the S&P 500 increased its earnings by +62% during the fourth quarter. If that occurs, that will be the first quarterly increase since 2007 and snap the longest consecutive losing streak in modern history!
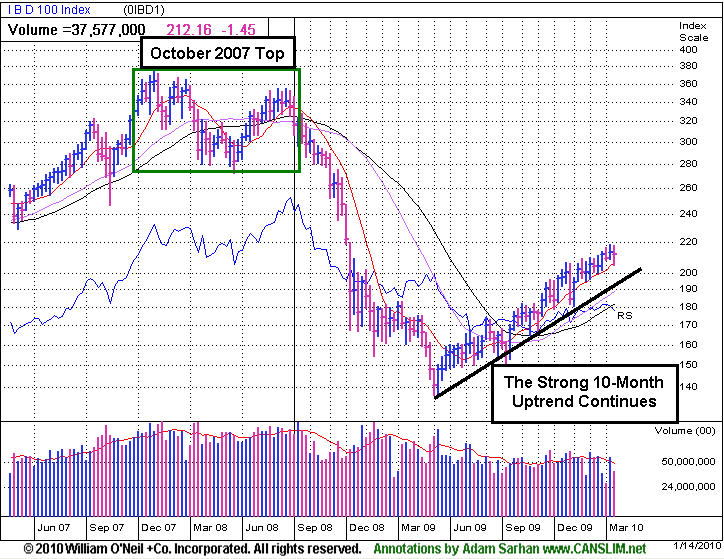
For the most part, the major averages and leading stocks are range bound as investors continue to digest the slew of earnings being released each day. Until a clear picture can be formed as to how companies fared last quarter then expect more of this sideways to slightly higher action to continue. It is important to note that the current 45-week rally remains intact as long as the major averages continue trading above their respective 50-day moving average (DMA) lines. Until those levels are breached, the bulls deserve the benefit of the doubt.
Professional Money Management Services - Free Portfolio Review- Inquire today!
A skilled team of portfolio managers that knows how to follow the rules of this fact-based investment system seeks to help improve your results in 2010, and we are pleased to assist you in taking the critical steps toward your brighter financial future. If you desire to have the expertise you have seen demonstrated by prior analysis here as the basis for your portfolio being actively managed now, click here to submit your inquiry. *Accounts over $250,000 please. ** Serious inquires only, please.
PICTURED: The IBD 100 Index's strong 10-month upward trend continues.
|
|
|
 |
Bank Index Approaching October 2009 Highs As Next Big Challenge
Kenneth J. Gruneisen - Passed the CAN SLIM® Master's Exam
The Bank Index ($BKX +1.64%) and Broker/Dealer Index ($XBD +0.30%) tallied gains on Thursday and the Healthcare Index ($HMO +1.37%) posted a solid gain. The Retail Index ($RLX -0.47%) and Semiconductor Index ($SOX -0.59%) created a drag on the market with their slight losses while the Biotechnology Index ($BTK -0.06%) and Internet Index ($IIX +0.04%) were little changed and the Networking Index ($NWX +0.62%) posted a modest gain. The Oil Services Index ($OSX +0.55%) edged higher while the Integrated Oil Index ($XOI +0.05%) finished flat and the Gold & Silver Index ($XAU -0.85%) laggard most other groups with a modest loss.
Charts courtesy www.stockcharts.com
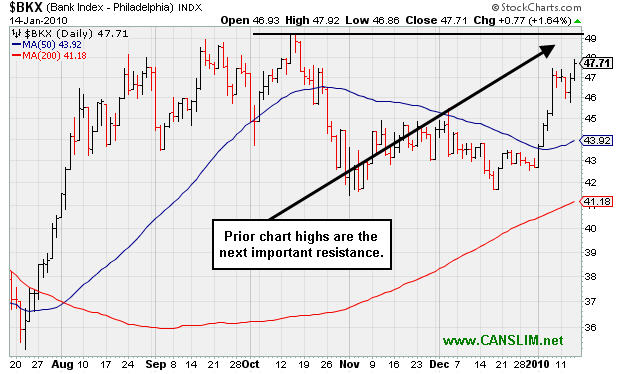
PICTURED: The Bank Index ($BKX +1.64%) held its ground after rallying above its 50-day moving average line recently, and now is approaching resistance at its prior chart high from October 2009.
| Oil Services |
$OSX |
213.49 |
+1.17 |
+0.55% |
+9.53% |
| Healthcare |
$HMO |
1,551.84 |
+20.93 |
+1.37% |
+5.36% |
| Integrated Oil |
$XOI |
1,101.46 |
+0.55 |
+0.05% |
+3.11% |
| Semiconductor |
$SOX |
356.96 |
-2.13 |
-0.59% |
-0.82% |
| Networking |
$NWX |
241.64 |
+1.49 |
+0.62% |
+4.58% |
| Internet |
$IIX |
235.40 |
+0.10 |
+0.04% |
+0.66% |
| Broker/Dealer |
$XBD |
118.59 |
+0.36 |
+0.30% |
+3.08% |
| Retail |
$RLX |
409.43 |
-1.95 |
-0.47% |
-0.41% |
| Gold & Silver |
$XAU |
176.40 |
-1.52 |
-0.85% |
+4.84% |
| Bank |
$BKX |
47.71 |
+0.77 |
+1.64% |
+11.71% |
| Biotech |
$BTK |
986.24 |
-0.57 |
-0.06% |
+4.68% |
|
|
|
 |
Baidu Blasts Beyond Max Buy Level
Kenneth J. Gruneisen - Passed the CAN SLIM® Master's Exam
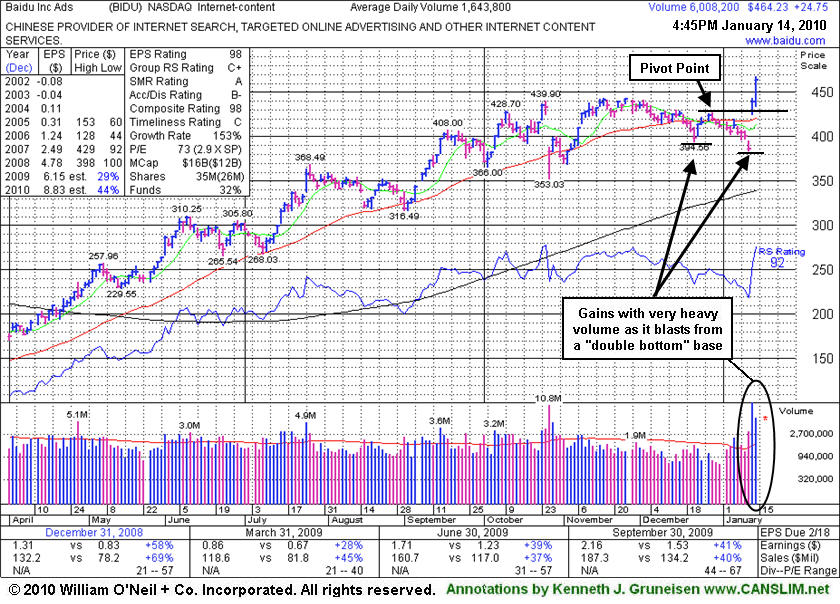
Baidu.com, Inc. (BIDU +$24.75 or +5.63% to $464.23) rose to a fresh all-time high today as a considerable gain backed by nearly 4 times average volume lifted it above its "max buy" level. Its color code was changed to green as it quickly got extended from more than +5% above its pivot point from the latest "double bottom" base pattern. It triggered a technical buy signal and was featured in yellow on 1/13/10 as it cleared the 12/29/09 high mentioned in the prior evening's note (view all notes). The stock had recently encountered resistance at its 50-day moving average (DMA) line and recently undercut its prior chart low, another ominous sign. It was repeatedly stated in prior analysis that, "Gains back above its 50 DMA line are needed for its outlook to improve." It was a sign of great institutional accumulation when it blasted higher. Regardless of the latest headlines, the company has a stellar sales and earnings history that satisfies the C & A criteria. It is reassuring that the number of top-rated funds owning BIDU's shares rose from 103 in Dec '08 to 177 in Sep '09, solid evidence its shares were being accumulated by the institutional (I criteria) crowd.
Always stay disciplined and avoid chasing stocks that are too extended from an ideal buy point to stack the odds of success in your favor. In a bullish market environment, many ideal buy candidates come along.
|
|
|
Color Codes Explained :
Y - Better candidates highlighted by our
staff of experts.
G - Previously featured
in past reports as yellow but may no longer be buyable under the
guidelines.
***Last / Change / Volume quote data in this table corresponds with the timestamp on the note***
Symbol/Exchange
Company Name
Industry Group |
Last |
Chg. |
Vol
% DAV |
Date Featured |
Price Featured |
Latest Pivot Point
Featured |
Status |
| Latest Max Buy Price |
ARST
-
|
$27.06
|
+1.23
|
1,022,513
202% DAV
507,100
|
12/22/2009
(Date
Featured) |
$25.94
(Price
Featured) |
PP = $27.20 |
G |
| MB = $28.56 |
Most Recent Note - 1/14/2010 4:15:32 PM
G - Gapped up today for a gain with above average volume, continuing its prompt rebound after an intra-day violation of its 50 DMA line on the prior session during a worrisome bout of distributional pressure. ARST was first featured in yellow at $19.91 in the 9/01/09 mid-day report with an annotated daily graph (read here).
>>> The latest Featured Stock Update with an annotated graph appeared on 1/4/2010. click here.
|
|
C
A
S
I |
News |
Chart |
SEC
View all notes Alert
me of new notes
Company
Profile
|
ASIA
-
|
$29.01
|
+0.81
|
579,688
46% DAV
1,246,900
|
12/24/2009
(Date
Featured) |
$31.05
(Price
Featured) |
PP = $32.40 |
G |
| MB = $34.02 |
Most Recent Note - 1/14/2010 4:44:30 PM
G - Small gain today on lighter volume was a timid sign of support while consolidating above its 50 DMA line (now $27.65) - important support level to watch. Traded up as much as +68.13% since first featured in the August 2009 CANSLIM.net News (read here).
>>> The latest Featured Stock Update with an annotated graph appeared on 1/12/2010. click here.
|
|
C
A
S
I |
News |
Chart |
SEC
View all notes Alert
me of new notes
Company
Profile
|
BIDU
- NASDAQ
Baidu Inc Ads
INTERNET - Internet Information Providers
|
$464.23
|
+24.75
|
6,021,236
366% DAV
1,643,800
|
1/13/2010
(Date
Featured) |
$431.25
(Price
Featured) |
PP = $426.75 |
G |
| MB = $448.09 |
Most Recent Note - 1/14/2010 4:59:43 PM
G - Hit a fresh all-time high today as a considerable gain backed by nearly 4 times average volume lifted it above its "max buy" level. Color code is changed to green as it quickly got extended from more than 5% above its pivot point from the latest "double bottom" base pattern. Triggered a technical buy signal and was featured in yellow on 1/13/10 as it cleared the 12/29/09 high mentioned in the prior note (view all notes).
>>> The latest Featured Stock Update with an annotated graph appeared on 1/14/2010. click here.
|
|
C
A
S
I |
News |
Chart |
SEC
View all notes Alert
me of new notes
Company
Profile
|
CAAS
- NASDAQ
China Automotive Systems
AUTOMOTIVE - Auto Parts
|
$23.24
|
-1.16
|
2,058,781
200% DAV
1,026,900
|
11/30/2009
(Date
Featured) |
$18.84
(Price
Featured) |
PP = $17.62 |
G |
| MB = $18.50 |
Most Recent Note - 1/14/2010 5:01:47 PM
G - Closed near the session low for a 3rd consecutive loss on above average volume. Distributional pressure has led to a test of prior chart highs in the $22 area - an important near-term technical support level to watch. CAAS was $18.84 when first featured in the 11/30/09 mid-day report (read here).
>>> The latest Featured Stock Update with an annotated graph appeared on 12/29/2009. click here.
|
|
C
A
S
I |
News |
Chart |
SEC
View all notes Alert
me of new notes
Company
Profile
|
CACC
- NASDAQ
Credit Acceptance Corp
FINANCIAL SERVICES - Credit Services
|
$48.00
|
+1.12
|
39,456
86% DAV
45,700
|
9/29/2009
(Date
Featured) |
$33.48
(Price
Featured) |
PP = $37.10 |
G |
| MB = $38.96 |
Most Recent Note - 1/14/2010 5:02:50 PM
G - Gain today on average volume, perched near all-time highs. Previous chart high and 50 DMA line coincide in the $37 area, defining an important support level to watch. It was featured on 9/29/09 in yellow in the mid-day report (read here).
>>> The latest Featured Stock Update with an annotated graph appeared on 1/8/2010. click here.
|
|
C
A
S
I |
News |
Chart |
SEC
View all notes Alert
me of new notes
Company
Profile
|
CRM
- NYSE
Salesforce.com Inc
INTERNET - Internet Software & Services
|
$69.19
|
+0.69
|
2,600,059
140% DAV
1,855,000
|
12/18/2009
(Date
Featured) |
$67.32
(Price
Featured) |
PP = $67.82 |
G |
| MB = $71.21 |
Most Recent Note - 1/14/2010 5:10:45 PM
G - Posted a small gain with +40% above average volume today. A positive reversal on 1/13/10 was a sign of support near prior chart highs and its 50 DMA line in the $67 area previously noted as "an important support level to watch on pullbacks." The old resistance level and its 50 DMA line define some classic support levels watched by technical analysts. Large gap down on 1/12/10 was indicative of institutional activity (I criteria) - clear distributional pressure.
>>> The latest Featured Stock Update with an annotated graph appeared on 1/6/2010. click here.
|
|
C
A
S
I |
News |
Chart |
SEC
View all notes Alert
me of new notes
Company
Profile
|
CTRP
- NASDAQ
Ctrip.com Intl Ltd Adr
LEISURE - Resorts & Casinos
|
$73.34
|
+3.17
|
1,333,317
125% DAV
1,065,300
|
1/14/2010
(Date
Featured) |
$73.34
(Price
Featured) |
PP = $78.70 |
Y |
| MB = $82.64 |
Most Recent Note - 1/14/2010 5:17:41 PM
Y - Considerable gain today with +25% above average volume showed prompt support and led to a close back above its 50 DMA line. Color code is changed to yellow based on its resilience, with a new pivot point noted based on its current flat base pattern. Featured on 12/01/09 in yellow in the mid-day report (read here).
>>> The latest Featured Stock Update with an annotated graph appeared on 12/30/2009. click here.
|
|
C
A
S
I |
News |
Chart |
SEC
View all notes Alert
me of new notes
Company
Profile
|
GMCR
- NASDAQ
Green Mtn Coffee Roastrs
FOOD & BEVERAGE - Processed & Packaged Goods
|
$81.24
|
-4.44
|
2,304,286
145% DAV
1,594,100
|
12/28/2009
(Date
Featured) |
$77.49
(Price
Featured) |
PP = $76.50 |
G |
| MB = $80.33 |
Most Recent Note - 1/14/2010 5:22:43 PM
G - Considerable loss today on higher volume negated the bulk of the prior session's gain and was a clear sign of distributional pressure as it promptly pulled back after hitting a fresh 52-week high. Still above its "max buy" level. Prior chart highs in the $76-77 area are important support levels to watch now.
>>> The latest Featured Stock Update with an annotated graph appeared on 1/13/2010. click here.
|
|
C
A
S
I |
News |
Chart |
SEC
View all notes Alert
me of new notes
Company
Profile
|
HEAT
-
|
$16.19
|
-0.44
|
478,323
41% DAV
1,166,300
|
1/6/2010
(Date
Featured) |
$17.19
(Price
Featured) |
PP = $17.27 |
G |
| MB = $18.13 |
Most Recent Note - 1/14/2010 5:30:44 PM
G - Small loss with light volume today, yet the deterioration and close below its 12/15/09 close ($16.59) is a technical sign of further damage. Recent chart lows near $14 define the next important support level. HEAT traded as much as +55.0% higher in the 8-week period since it was first featured in yellow in the 11/17/09 mid-day report (read here) when technically rising from a "double bottom" base, reaching a new all-time high.
>>> The latest Featured Stock Update with an annotated graph appeared on 12/31/2009. click here.
|
|
C
A
S
I |
News |
Chart |
SEC
View all notes Alert
me of new notes
Company
Profile
|
LFT
-
|
$38.35
|
+0.24
|
387,920
92% DAV
422,000
|
11/17/2009
(Date
Featured) |
$31.77
(Price
Featured) |
PP = $33.04 |
G |
| MB = $34.69 |
Most Recent Note - 1/14/2010 6:32:05 PM
G - Held its ground today after a big loss on 1/13/10 with above average volume indicated more worrisome distributional pressure. Its 50 DMA line near $35 has been previously noted as an initial support level to watch on pullbacks. Its fundamentals remain strong.
>>> The latest Featured Stock Update with an annotated graph appeared on 1/5/2010. click here.
|
|
C
A
S
I |
News |
Chart |
SEC
View all notes Alert
me of new notes
Company
Profile
|
PEGA
- NASDAQ
Pegasystems Inc
COMPUTER SOFTWARE & SERVICES - Business Software & Services
|
$35.17
|
-0.08
|
99,845
44% DAV
224,900
|
1/4/2010
(Date
Featured) |
$34.00
(Price
Featured) |
PP = $36.19 |
Y |
| MB = $38.00 |
Most Recent Note - 1/14/2010 5:32:02 PM
Y - Perched near all-time highs with no resistance remaining due to overhead supply. Featured in the January 2010 issue of CANSLIM.net News (read here).
>>> The latest Featured Stock Update with an annotated graph appeared on 1/3/2010. click here.
|
|
C
A
S
I |
News |
Chart |
SEC
View all notes Alert
me of new notes
Company
Profile
|
VIT
-
|
$19.99
|
-0.15
|
363,008
65% DAV
561,600
|
12/24/2009
(Date
Featured) |
$20.07
(Price
Featured) |
PP = $21.17 |
Y |
| MB = $22.23 |
Most Recent Note - 1/14/2010 6:33:53 PM
Y - Loss on lighter volume today, however distributional pressure in the past week has raised concerns. It abruptly reversed under its pivot point following its big 1/06/10 gain on heavy volume and 1/11/10 gain on +36% above average volume. Featured in yellow in the 12/24/09 mid-day report (read here).
>>> The latest Featured Stock Update with an annotated graph appeared on 1/11/2010. click here.
|
|
C
A
S
I |
News |
Chart |
SEC
View all notes Alert
me of new notes
Company
Profile
|
|
|
|
THESE ARE NOT BUY RECOMMENDATIONS!
Comments contained in the body of this report are technical
opinions only. The material herein has been obtained
from sources believed to be reliable and accurate, however,
its accuracy and completeness cannot be guaranteed.
This site is not an investment advisor, hence it does
not endorse or recommend any securities or other investments.
Any recommendation contained in this report may not
be suitable for all investors and it is not to be deemed
an offer or solicitation on our part with respect to
the purchase or sale of any securities. All trademarks,
service marks and trade names appearing in this report
are the property of their respective owners, and are
likewise used for identification purposes only.
This report is a service available
only to active Paid Premium Members.
You may opt-out of receiving report notifications
at any time. Questions or comments may be submitted
by writing to Premium Membership Services 665 S.E. 10 Street, Suite 201 Deerfield Beach, FL 33441-5634 or by calling 1-800-965-8307
or 954-785-1121.
|
|
|


