You are not logged in.
This means you
CAN ONLY VIEW reports that were published prior to Monday, April 14, 2025.
You
MUST UPGRADE YOUR MEMBERSHIP if you want to see any current reports.
AFTER MARKET UPDATE - FRIDAY, JANUARY 11TH, 2013
Previous After Market Report Next After Market Report >>>
|
|
|
|
DOW |
+17.21 |
13,488.43 |
+0.13% |
|
Volume |
632,959,590 |
-13% |
|
Volume |
1,716,281,090 |
+1% |
|
NASDAQ |
+3.87 |
3,125.63 |
+0.12% |
|
Advancers |
1,590 |
51% |
|
Advancers |
1,230 |
48% |
|
S&P 500 |
-0.07 |
1,472.05 |
-0.00% |
|
Decliners |
1,423 |
45% |
|
Decliners |
1,225 |
48% |
|
Russell 2000 |
-0.47 |
880.77 |
-0.05% |
|
52 Wk Highs |
250 |
|
|
52 Wk Highs |
132 |
|
|
S&P 600 |
-0.19 |
492.06 |
-0.04% |
|
52 Wk Lows |
3 |
|
|
52 Wk Lows |
12 |
|
|
 |
Major Averages Posted Small Weekly Gains
Kenneth J. Gruneisen - Passed the CAN SLIM® Master's Exam
The major averages posted small weekly gains as the Dow Jones Industrial Average and the S&P 500 Index gained +0.4%, and the Nasdaq Composite Index rallied +0.8% on the week. The major averages finished Friday with gains while the volume totals were reported mixed, lighter on the NYSE and slightly higher on the Nasdaq exchange. Advancers narrowly led decliners on the NYSE and the action was evenly mixed on the Nasdaq exchange. The total number of stocks hitting new 52-week highs contracted from the prior session totals, yet still new highs easily outnumbered new 52-week lows on the NYSE and on the Nasdaq exchange. There were 77 high-ranked companies from the CANSLIM.net Leaders List making new 52-week highs and appearing on the CANSLIM.net BreakOuts Page, down from the prior session total of 97 stocks. Any sustainable rally requires a healthy crop of companies hitting new 52-week highs, so it remains encouraging to see solid leadership. There were gains for 5 of the 10 high-ranked companies currently included on the Featured Stocks Page.
Stocks were choppy as investors digest mixed economic and corporate earnings reports. Looking at the data, the U.S. trade deficit unexpectedly widened in the November reading and import prices fell -0.1% in December.
Sector action on the S&P was mixed with losses in financials overshadowing positive moves in consumer stocks. Shares of Bank of America Corp (BAC -1.27%) and Citigroup Inc (C -1.14%) after concerns were raised that net interest income could be a weak spot in upcoming bank earnings. In other news, Best Buy Co Inc (BBY +16.38%) rallied despite reporting flat holiday sales and lowering their full year free cash flow estimates. Research In Motion Ltd (RIMM +13.76%) shares climbed as investors bet on the company's new BlackBerry. Materials companies were weaker as shares of Alcoa Inc (AA -0.33%) and U.S. Steel Corp (X -3.30%) fell.
Turning to fixed income markets, Treasuries were higher along the curve with the benchmark 10-year note up 5/16 of a point to yield 1.87%.
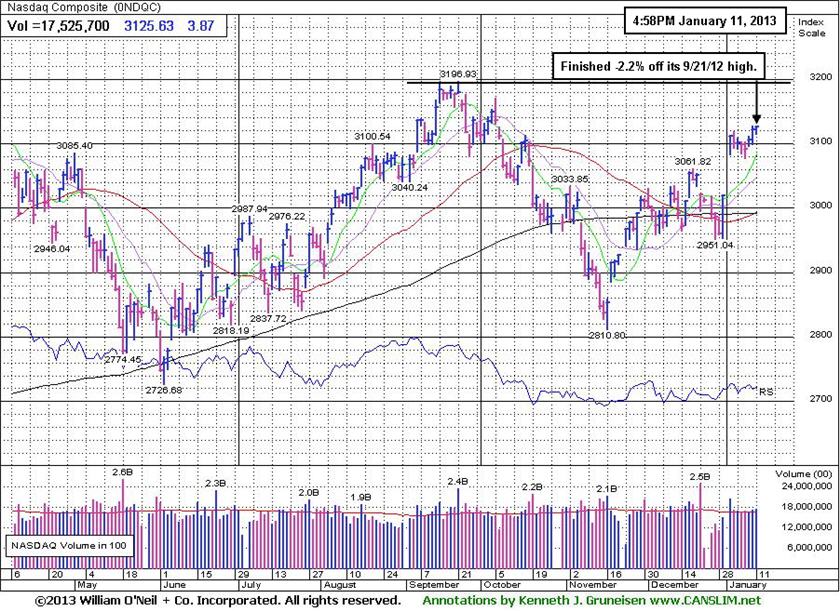
Investors may consider new buying efforts in stocks meeting all key criteria, as the market's (M criteria) confirmed uptrend showed a great expansion in leadership (stocks hitting new 52-week highs) after overcoming recent pressure. Solid gains helped the benchmark S&P 500 Index promptly rebound above its 50-day moving average (DMA) line, and Nasdaq Composite Index and Dow Jones Industrial Average both promptly rebounded above their respective 50 DMA and 200 DMA lines. All of the major averages then blasted above their December highs with additional volume-driven gains.
Watch for an announcement via email concerning the next WEBCAST. The webcast will also be available via an updated link highlighted at the top of the Premium Member Homepage.
PICTURED: The Nasdaq Composite Index is currently perched within -2.2% of its 9/21/12 high. Any meaningful rally above the old high might be viewed as a bullish technical signal which would bode well for the broader market outlook
|
 Kenneth J. Gruneisen started out as a licensed stockbroker in August 1987, a couple of months prior to the historic stock market crash that took the Dow Jones Industrial Average down -22.6% in a single day. He has published daily fact-based fundamental and technical analysis on high-ranked stocks online for two decades. Through FACTBASEDINVESTING.COM, Kenneth provides educational articles, news, market commentary, and other information regarding proven investment systems that work in good times and bad.
Comments contained in the body of this report are technical opinions only and are not necessarily those of Gruneisen Growth Corp. The material herein has been obtained from sources believed to be reliable and accurate, however, its accuracy and completeness cannot be guaranteed. Our firm, employees, and customers may effect transactions, including transactions contrary to any recommendation herein, or have positions in the securities mentioned herein or options with respect thereto. Any recommendation contained in this report may not be suitable for all investors and it is not to be deemed an offer or solicitation on our part with respect to the purchase or sale of any securities. |
|
 |
Tech Sector Rises While Financial Groups Edge Lower
Kenneth J. Gruneisen - Passed the CAN SLIM® Master's Exam
Weakness in the Bank Index ($BKX -0.78%) and the Broker/Dealer Index ($XBD -0.25%) created a drag on the market that limited the major averages ability to rally on Friday. Defensive groups also edged lower as the Healthcare Index ($HMO -0.31%) and Gold & Silver Index ($XAU -0.15%) finished with small losses. Energy-related shares were quiet as the Oil Services Index ($OSX -0.08%) and the Integrated Oil Index ($XOI +0.06%) finished virtually unchanged. The Retail Index ($RLX +0.27%) posted a small gain that helped offset weakness in other groups. Although the Networking Index ($NWX -0.15%) edged lower, most of the tech sector posted gains including the Semiconductor Index ($SOX +0.53%), Internet Index ($IIX +0.78%), and the Biotechnology Index ($BTK +1.12%).
Charts courtesy www.stockcharts.com
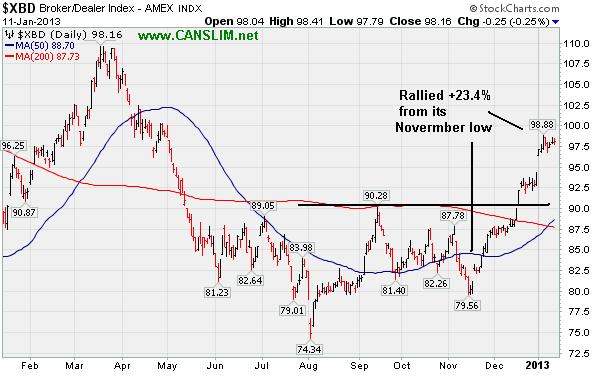
PICTURED: The Broker/Dealer Index ($XBD -0.25%) finished the week +23.4% above its November low. Its 50-day moving average (DMA) line (the blue line) recently rebounded above its 200 DMA line (red line) as a result of its recent strength, which is another encouraging technical improvement.
| Oil Services |
$OSX |
232.15 |
-0.18 |
-0.08% |
+5.45% |
| Healthcare |
$HMO |
2,527.31 |
-7.93 |
-0.31% |
+0.52% |
| Integrated Oil |
$XOI |
1,282.12 |
+0.71 |
+0.06% |
+3.24% |
| Semiconductor |
$SOX |
402.86 |
+2.13 |
+0.53% |
+4.90% |
| Networking |
$NWX |
237.05 |
-0.36 |
-0.15% |
+4.64% |
| Internet |
$IIX |
340.14 |
+2.65 |
+0.78% |
+4.02% |
| Broker/Dealer |
$XBD |
98.16 |
-0.25 |
-0.25% |
+4.06% |
| Retail |
$RLX |
668.32 |
+1.80 |
+0.27% |
+2.34% |
| Gold & Silver |
$XAU |
163.36 |
-0.25 |
-0.15% |
-1.35% |
| Bank |
$BKX |
53.18 |
-0.42 |
-0.78% |
+3.71% |
| Biotech |
$BTK |
1,638.31 |
+18.07 |
+1.12% |
+5.90% |
|
|
|
 |
Stalled After Latest Breakout Gain With Sufficient Volume
Kenneth J. Gruneisen - Passed the CAN SLIM® Master's Exam
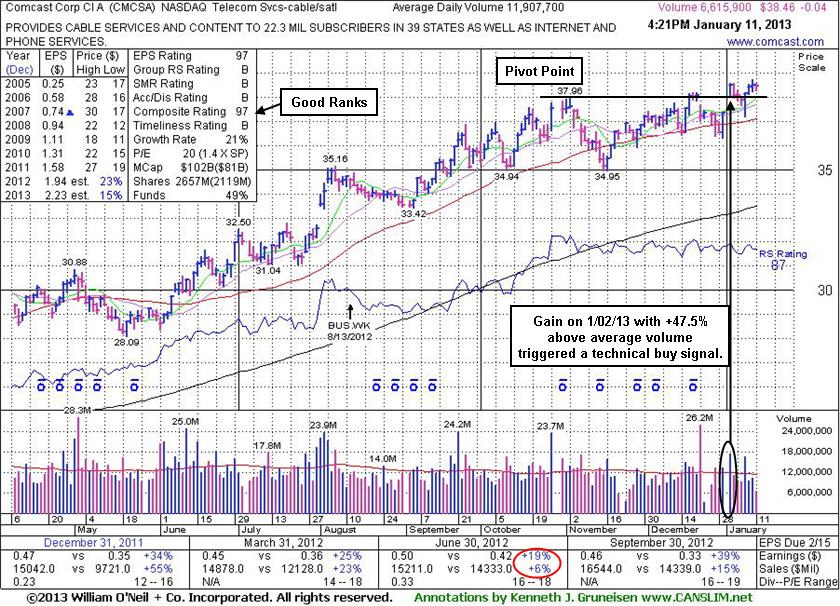
Comcast Corp Cl A (CMCSA -$0.04 or -0.10% to $38.46) stalled and has been hovering near its 52-week high since its gain above its pivot point on 1/02/12 backed by +47.5% above average volume triggered a technical buy signal. No resistance remains due to overhead supply and it remains trading below its "max buy" level. It managed an impressive "positive reversal" on Tuesday for a gain on higher volume after dipping near its 50-day moving average (DMA) line intra-day. It was last shown in this FSU section on 12/27/12 with an annotated graph under the headline, "Found Support at 50-Day Average While Still Awaiting Breakout", when finishing in the upper half of its intra-day range after dipping below its 50-day moving average (DMA) line. It found prompt support near that important short-term average and it had been highlighted in yellow throughout December and repeatedly noted with caution - "Disciplined investors will watch for gains above the pivot point backed by at least the bare minimum +40% above average volume threshold to trigger a proper new (or add-on) technical buy signal before taking action."
The high-ranked Telecom Services - Cable/Satellite firm reported earnings +39% on +15% sales revenues for the Sep '12 quarter, above the fact-based investment system's +25% minimum guideline for the C criteria, a reassuring follow-up to the previously noted sub par quarter (see red circle). It has earned good ranks. Its annual earnings (A criteria) history has been strong and leadership from other firms in the industry group is a reassuring sign concerning the L criteria. The number of top-rated funds owning its shares rose from 1,916 in Jun '11 to 2,222 in Dec '12, a reassuring sign concerning the I criteria. Its huge supply of 2.097 billion shares in the float could make it less likely to be a great sprinter, meanwhile, the S criteria calls for investors to usually look at small-cap or mid-cap companies.
|
|
|
Color Codes Explained :
Y - Better candidates highlighted by our
staff of experts.
G - Previously featured
in past reports as yellow but may no longer be buyable under the
guidelines.
***Last / Change / Volume data in this table is the closing quote data***
Symbol/Exchange
Company Name
Industry Group |
PRICE |
CHANGE
(%Change) |
Day High |
Volume
(% DAV)
(% 50 day avg vol) |
52 Wk Hi
% From Hi |
Featured
Date |
Price
Featured |
Pivot Featured |
|
Max Buy |
CELG
-
NASDAQ
Celgene Corp
DRUGS - Drug Manufacturers - Major
|
$96.30
|
+0.82
0.86% |
$96.33
|
5,195,987
155.77% of 50 DAV
50 DAV is 3,335,600
|
$95.53
0.81%
|
12/11/2012
|
$82.24
|
PP = $81.34
|
|
MB = $85.41
|
 Most Recent Note - 1/11/2013 11:58:39 AM
G - Perched at its 52-week high today after a streak of 8 consecutive gains, very extended from its prior base. Prior highs near $81-82 define initial support to watch on pullbacks.
>>> The latest Featured Stock Update with an annotated graph appeared on 1/3/2013. Click here.
View all notes |
Alert me of new notes |
CANSLIM.net Company Profile |
SEC |
Zacks Reports |
StockTalk |
News |
Chart |
Request a new note
C
A N
S L
I M


|
CFNL
-
NASDAQ
Cardinal Financial Corp
BANKING - Regional - Southeast Banks
|
$16.24
|
-0.17
-1.04% |
$16.48
|
195,713
89.74% of 50 DAV
50 DAV is 218,100
|
$16.90
-3.91%
|
12/3/2012
|
$15.20
|
PP = $16.31
|
|
MB = $17.13
|
Most Recent Note - 1/8/2013 2:33:49 PM
Y - Poised for a best-ever close with above average volume behind today's gain, yet still trading below its "max buy" level. Hit a new 52-week high and cleared its pivot point on 1/02/13 with sufficient volume to trigger a proper new (or add-on) technical buy signal.
>>> The latest Featured Stock Update with an annotated graph appeared on 12/31/2012. Click here.
View all notes |
Alert me of new notes |
CANSLIM.net Company Profile |
SEC |
Zacks Reports |
StockTalk |
News |
Chart |
Request a new note
C
A N
S L
I M
|
CMCSA
-
NASDAQ
Comcast Corp Cl A
MEDIA - CATV Systems
|
$38.46
|
-0.04
-0.10% |
$38.58
|
6,977,749
58.60% of 50 DAV
50 DAV is 11,907,700
|
$38.76
-0.77%
|
12/3/2012
|
$37.08
|
PP = $38.06
|
|
MB = $39.96
|
Most Recent Note - 1/11/2013 5:36:26 PM
Y - It managed an impressive "positive reversal" on Tuesday after dipping near its 50 DMA line. Hovering near its 52-week high since its gain above its pivot point on 1/02/12 triggered a technical buy signal. No resistance remains due to overhead supply. See the latest FSU analysis for more details and a new annotated graph.
>>> The latest Featured Stock Update with an annotated graph appeared on 1/11/2013. Click here.
View all notes |
Alert me of new notes |
CANSLIM.net Company Profile |
SEC |
Zacks Reports |
StockTalk |
News |
Chart |
Request a new note
C
A N
S L
I M
|
LULU
-
NASDAQ
Lululemon Athletica
MANUFACTURING - Textile Manufacturing
|
$70.84
|
+0.26
0.37% |
$71.19
|
1,567,772
78.03% of 50 DAV
50 DAV is 2,009,100
|
$81.09
-12.64%
|
12/26/2012
|
$73.81
|
PP = $77.95
|
|
MB = $81.85
|
Most Recent Note - 1/8/2013 2:41:18 PM
G - Holding its ground today near its 50 DMA line and trading -12.1% off its 52-week high. Distributional losses on above average volume raised concerns following a "negative reversal" on 1/02/13. Disciplined investors waited to take any action after it was recently noted - "Subsequent volume-driven gains above its pivot point are still needed to trigger a new technical buy signal."
>>> The latest Featured Stock Update with an annotated graph appeared on 12/28/2012. Click here.
View all notes |
Alert me of new notes |
CANSLIM.net Company Profile |
SEC |
Zacks Reports |
StockTalk |
News |
Chart |
Request a new note
C
A N
S L
I M
|
MIDD
-
NASDAQ
Middleby Corp
MANUFACTURING - Diversified Machinery
|
$131.89
|
+0.40
0.30% |
$132.56
|
67,080
75.37% of 50 DAV
50 DAV is 89,000
|
$134.51
-1.95%
|
10/8/2012
|
$118.46
|
PP = $122.67
|
|
MB = $128.80
|
Most Recent Note - 1/8/2013 2:43:21 PM
G - Holding its ground stubbornly near its 52-week and all-time highs with recent volume totals below average. Earnings +23% on +18% sales for the Sep '12 quarter, below the +25% minimum earnings guideline (C criteria), raised concerns.
>>> The latest Featured Stock Update with an annotated graph appeared on 12/26/2012. Click here.
View all notes |
Alert me of new notes |
CANSLIM.net Company Profile |
SEC |
Zacks Reports |
StockTalk |
News |
Chart |
Request a new note
C
A N
S L
I M
|
Symbol/Exchange
Company Name
Industry Group |
PRICE |
CHANGE
(%Change) |
Day High |
Volume
(% DAV)
(% 50 day avg vol) |
52 Wk Hi
% From Hi |
Featured
Date |
Price
Featured |
Pivot Featured |
|
Max Buy |
N
-
NYSE
Netsuite Inc
DIVERSIFIED SERVICES - Business/Management Services
|
$68.77
|
-1.11
-1.59% |
$70.42
|
233,578
56.30% of 50 DAV
50 DAV is 414,900
|
$70.80
-2.87%
|
12/12/2012
|
$64.75
|
PP = $67.12
|
|
MB = $70.48
|
Most Recent Note - 1/9/2013 5:43:06 PM
Y - Gains above its pivot point have been marked by below average volume. Disciplined investors know that volume must be at least +40% above average behind gains above the pivot point to trigger a proper technical buy signal.
>>> The latest Featured Stock Update with an annotated graph appeared on 1/4/2013. Click here.
View all notes |
Alert me of new notes |
CANSLIM.net Company Profile |
SEC |
Zacks Reports |
StockTalk |
News |
Chart |
Request a new note
C
A N
S L
I M
|
NSR
-
NYSE
Neustar Inc
TELECOMMUNICATIONS - Diversified Communication Serv
|
$44.35
|
+1.18
2.73% |
$44.39
|
356,619
84.95% of 50 DAV
50 DAV is 419,800
|
$43.90
1.03%
|
12/11/2012
|
$41.85
|
PP = $41.41
|
|
MB = $43.48
|
Most Recent Note - 1/11/2013 5:34:28 PM
G - Color code is changed to green again after rallying above its "max buy" level with today's light volume gain. Prior highs and its 50 DMA line define support to watch on pullbacks.
>>> The latest Featured Stock Update with an annotated graph appeared on 1/2/2013. Click here.
View all notes |
Alert me of new notes |
CANSLIM.net Company Profile |
SEC |
Zacks Reports |
StockTalk |
News |
Chart |
Request a new note
C
A N
S L
I M
|
RAX
-
NYSE
Rackspace Hosting Inc
INTERNET - Internet Software and; Services
|
$77.83
|
+0.05
0.06% |
$78.30
|
532,420
38.11% of 50 DAV
50 DAV is 1,396,900
|
$78.36
-0.68%
|
12/18/2012
|
$71.88
|
PP = $70.10
|
|
MB = $73.61
|
Most Recent Note - 1/8/2013 2:46:54 PM
G - Inching to another new all-time high with today's gain lacking great volume conviction. Getting extended from its prior base, meanwhile prior highs in the $70 area define initial support to watch.
>>> The latest Featured Stock Update with an annotated graph appeared on 1/8/2013. Click here.
View all notes |
Alert me of new notes |
CANSLIM.net Company Profile |
SEC |
Zacks Reports |
StockTalk |
News |
Chart |
Request a new note
C
A N
S L
I M
|
RNF
-
NYSE
Rentech Nitrogen Ptnr Lp
CHEMICALS - Agricultural Chemicals
|
$46.07
|
-0.06
-0.13% |
$46.88
|
462,428
146.48% of 50 DAV
50 DAV is 315,700
|
$46.22
-0.32%
|
11/1/2012
|
$39.11
|
PP = $40.15
|
|
MB = $42.16
|
Most Recent Note - 1/11/2013 12:40:08 PM
G - Very extended after a streak of 9 consecutive gains, its prior highs in the $40 area define initial support to watch on pullbacks. Disciplined investors avoid chasing stocks extended more than +5% above prior highs following a technical breakout from a sound base.
>>> The latest Featured Stock Update with an annotated graph appeared on 1/9/2013. Click here.
View all notes |
Alert me of new notes |
CANSLIM.net Company Profile |
SEC |
Zacks Reports |
StockTalk |
News |
Chart |
Request a new note
C
A N
S L
I M
|
VRX
-
NYSE
Valeant Pharmaceuticals
DRUGS - Drug Manufacturers - Other
|
$63.63
|
-0.28
-0.44% |
$64.41
|
1,064,381
67.50% of 50 DAV
50 DAV is 1,576,800
|
$64.12
-0.76%
|
12/20/2012
|
$60.24
|
PP = $61.21
|
|
MB = $64.27
|
Most Recent Note - 1/9/2013 8:27:07 PM
Y - Rallied further above its pivot point to another new 52-week high today , however volume thus far is below the +40% above average volume guideline which is the bare minimum threshold needed to trigger a proper technical buy signal. Disciplined investors may use a tactic called "pyramiding" to allow market action to dictate their positioning.
>>> The latest Featured Stock Update with an annotated graph appeared on 1/10/2013. Click here.
View all notes |
Alert me of new notes |
CANSLIM.net Company Profile |
SEC |
Zacks Reports |
StockTalk |
News |
Chart |
Request a new note
C
A N
S L
I M
|
Symbol/Exchange
Company Name
Industry Group |
PRICE |
CHANGE
(%Change) |
Day High |
Volume
(% DAV)
(% 50 day avg vol) |
52 Wk Hi
% From Hi |
Featured
Date |
Price
Featured |
Pivot Featured |
|
Max Buy |
|
|
|
THESE ARE NOT BUY RECOMMENDATIONS!
Comments contained in the body of this report are technical
opinions only. The material herein has been obtained
from sources believed to be reliable and accurate, however,
its accuracy and completeness cannot be guaranteed.
This site is not an investment advisor, hence it does
not endorse or recommend any securities or other investments.
Any recommendation contained in this report may not
be suitable for all investors and it is not to be deemed
an offer or solicitation on our part with respect to
the purchase or sale of any securities. All trademarks,
service marks and trade names appearing in this report
are the property of their respective owners, and are
likewise used for identification purposes only.
This report is a service available
only to active Paid Premium Members.
You may opt-out of receiving report notifications
at any time. Questions or comments may be submitted
by writing to Premium Membership Services 665 S.E. 10 Street, Suite 201 Deerfield Beach, FL 33441-5634 or by calling 1-800-965-8307
or 954-785-1121.
|
|
|

