***Last / Change / Volume data in this table is the closing quote data***
Symbol/Exchange
Company Name
Industry Group |
PRICE |
CHANGE
(%Change) |
Day High |
Volume
(% DAV)
(% 50 day avg vol) |
52 Wk Hi
% From Hi |
Featured
Date |
Price
Featured |
Pivot Featured |
|
Max Buy |
ADS
-
NYSE
Alliance Data Sys Corp
COMPUTER SOFTWARE and SERVICES - Information and Delivery Service
|
$106.70
|
+1.74
1.66% |
$107.20
|
800,429
114.17% of 50 DAV
50 DAV is 701,100
|
$107.33
-0.59%
|
10/21/2011
|
$97.94
|
PP = $101.15
|
|
MB = $106.21
|
Most Recent Note - 1/10/2012 5:44:09 PM
Y - Up for a 4th consecutive gain today after finding prompt support near its 50 DMA line, still perched within close striking distance of its all-time high. However, a subsequent violation of the 1/04/12 session low ($100.42) would raise greater concerns and trigger a technical sell signal.
>>> The latest Featured Stock Update with an annotated graph appeared on 12/14/2011. Click here.
View all notes |
Alert me of new notes |
CANSLIM.net Company Profile |
SEC |
Zacks Reports |
StockTalk |
News |
Chart |
Request a new note
C
A N
S L
I M


|
ALXN
-
NASDAQ
Alexion Pharmaceuticals
DRUGS - Drug Manufacturers - Other
|
$73.64
|
-1.04
-1.39% |
$75.03
|
1,291,298
108.33% of 50 DAV
50 DAV is 1,192,000
|
$76.20
-3.36%
|
11/30/2011
|
$68.66
|
PP = $70.52
|
|
MB = $74.05
|
Most Recent Note - 1/9/2012 12:25:45 PM
G - Color code is changed to green after rallying beyond its "max buy" level for new all-time highs today with volume running at an above average pace for a 3rd consecutive session. The prior gain above its pivot point had +53% above average volume, meeting the investment system guidelines for a technical buy signal. Its 50 DMA line defines near-term support above prior lows in the $62 area.
>>> The latest Featured Stock Update with an annotated graph appeared on 12/12/2011. Click here.
View all notes |
Alert me of new notes |
CANSLIM.net Company Profile |
SEC |
Zacks Reports |
StockTalk |
News |
Chart |
Request a new note
C
A N
S L
I M
|
CATM
-
NASDAQ
Cardtronics Inc
DIVERSIFIED SERVICES - Business/Management Services
|
$26.70
|
+0.18
0.68% |
$26.76
|
351,708
103.81% of 50 DAV
50 DAV is 338,800
|
$28.74
-7.10%
|
12/23/2011
|
$28.64
|
PP = $28.56
|
|
MB = $29.99
|
 Most Recent Note - 1/11/2012 4:55:54 PM
Y - Color code is changed to yellow while showing resilience and finding prompt support near its 50 DMA line. Previously noted, "The gain on 12/23/11 was backed by +77% above average volume and it touched a new 52-week high, but it did not close above the new pivot point cited based on its 11/08/11 high plus 10 cents."
>>> The latest Featured Stock Update with an annotated graph appeared on 12/23/2011. Click here.
View all notes |
Alert me of new notes |
CANSLIM.net Company Profile |
SEC |
Zacks Reports |
StockTalk |
News |
Chart |
Request a new note
C
A N
S L
I M
|
CELG
-
NASDAQ
Celgene Corp
DRUGS - Drug Manufacturers - Major
|
$72.07
|
+1.81
2.58% |
$72.31
|
4,311,214
128.01% of 50 DAV
50 DAV is 3,367,800
|
$70.77
1.84%
|
12/20/2011
|
$66.68
|
PP = $68.35
|
|
MB = $71.77
|
Most Recent Note - 1/11/2012 5:03:48 PM
G - Color code is changed to green after rallying beyond its "max buy" level for another new 52-week high today. Its 1/10/12 gain and strong close was backed by +59% above average volume as it rallied above its pivot point triggering a technical buy signal.
>>> The latest Featured Stock Update with an annotated graph appeared on 12/29/2011. Click here.
View all notes |
Alert me of new notes |
CANSLIM.net Company Profile |
SEC |
Zacks Reports |
StockTalk |
News |
Chart |
Request a new note
C
A N
S L
I M
|
FEIC
-
NASDAQ
F E I Co
ELECTRONICS - Diversified Electronics
|
$43.91
|
+1.53
3.61% |
$44.04
|
552,844
168.55% of 50 DAV
50 DAV is 328,000
|
$43.00
2.12%
|
12/7/2011
|
$41.41
|
PP = $42.35
|
|
MB = $44.47
|
Most Recent Note - 1/11/2012 5:05:41 PM
Y - Hit a new all-time high and triggered a technical buy signal with +68% above average volume behind its gain today while rising above its pivot point for a 3rd consecutive gain. No overhead supply remains to hinder its upward progress. The 50 DMA line defines chart support above prior lows.
>>> The latest Featured Stock Update with an annotated graph appeared on 12/21/2011. Click here.
View all notes |
Alert me of new notes |
CANSLIM.net Company Profile |
SEC |
Zacks Reports |
StockTalk |
News |
Chart |
Request a new note
C
A N
S L
I M
|
Symbol/Exchange
Company Name
Industry Group |
PRICE |
CHANGE
(%Change) |
Day High |
Volume
(% DAV)
(% 50 day avg vol) |
52 Wk Hi
% From Hi |
Featured
Date |
Price
Featured |
Pivot Featured |
|
Max Buy |
GNC
-
NYSE
G N C Holdings Inc
RETAIL - Drug Stores
|
$28.36
|
+0.32
1.14% |
$28.45
|
296,437
25.45% of 50 DAV
50 DAV is 1,164,900
|
$29.50
-3.86%
|
10/26/2011
|
$24.60
|
PP = $24.80
|
|
MB = $26.04
|
Most Recent Note - 1/9/2012 2:08:08 PM
G - Overcame early weakness and managed a positive reversal, finding prompt support after briefly undercutting its 50 DMA line. Subsequent losses below its intra-day low ($26.54) would raise more serious concerns and trigger technical sell signals.
>>> The latest Featured Stock Update with an annotated graph appeared on 12/16/2011. Click here.
View all notes |
Alert me of new notes |
CANSLIM.net Company Profile |
SEC |
Zacks Reports |
StockTalk |
News |
Chart |
Request a new note
C
A N
S L
I M
|
HMSY
-
NASDAQ
H M S Holdings Corp
COMPUTER SOFTWARE and SERVICES - Healthcare Information Service
|
$32.13
|
-0.04
-0.12% |
$32.16
|
319,145
29.93% of 50 DAV
50 DAV is 1,066,400
|
$32.83
-2.13%
|
10/27/2011
|
$26.44
|
PP = $28.37
|
|
MB = $29.79
|
Most Recent Note - 1/11/2012 4:58:14 PM
G - No resistance remains to hinder its progress, but it is slightly extended from its prior base. Holding its ground near its all-time high with volume totals cooling in recent weeks.
>>> The latest Featured Stock Update with an annotated graph appeared on 12/28/2011. Click here.
View all notes |
Alert me of new notes |
CANSLIM.net Company Profile |
SEC |
Zacks Reports |
StockTalk |
News |
Chart |
Request a new note
C
A N
S L
I M
|
ISRG
-
NASDAQ
Intuitive Surgical Inc
HEALTH SERVICES - Medical Appliances and Equipment
|
$456.95
|
+6.76
1.50% |
$457.76
|
319,105
104.32% of 50 DAV
50 DAV is 305,900
|
$474.50
-3.70%
|
12/20/2011
|
$442.43
|
PP = $449.16
|
|
MB = $471.62
|
Most Recent Note - 1/11/2012 4:59:33 PM
Y - Gain today on average volume halted a streak of 3 consecutive losses. Recently enduring mild distributional pressure while churning near its all-time high, and previously noted, "Recent gains above its pivot point have lacked the volume needed to trigger a proper new (or add-on) technical buy signal. Important support is defined by its 50 DMA line."
>>> The latest Featured Stock Update with an annotated graph appeared on 12/13/2011. Click here.
View all notes |
Alert me of new notes |
CANSLIM.net Company Profile |
SEC |
Zacks Reports |
StockTalk |
News |
Chart |
Request a new note
C
A N
S L
I M
|
LULU
-
NASDAQ
Lululemon Athletica
MANUFACTURING - Textile Manufacturing
|
$60.57
|
+0.70
1.17% |
$61.38
|
4,370,880
112.23% of 50 DAV
50 DAV is 3,894,700
|
$64.49
-6.08%
|
1/10/2012
|
$60.97
|
PP = $59.46
|
|
MB = $62.43
|
Most Recent Note - 1/11/2012 12:32:55 PM
Y - Holding its ground today following a considerable gap up gain on 1/10/12 when noted rising from a "double bottom" base. Prior chart highs in the low $60s may now act as a resistance level. See the latest FSU analysis for more details and a new annotated graph.
>>> The latest Featured Stock Update with an annotated graph appeared on 1/10/2012. Click here.
View all notes |
Alert me of new notes |
CANSLIM.net Company Profile |
SEC |
Zacks Reports |
StockTalk |
News |
Chart |
Request a new note
C
A N
S L
I M
|
MA
-
NYSE
Mastercard Inc Cl A
DIVERSIFIED SERVICES - Business/Management Services
|
$341.47
|
-7.36
-2.11% |
$345.56
|
1,435,029
138.76% of 50 DAV
50 DAV is 1,034,200
|
$384.99
-11.30%
|
1/3/2012
|
$367.87
|
PP = $385.09
|
|
MB = $404.34
|
Most Recent Note - 1/11/2012 2:26:21 PM
G - Slumping further below its 50 DMA line and under late-November lows raising greater concerns. Its 200 DMA line defines the next nearest support level as technical damage mounts.
>>> The latest Featured Stock Update with an annotated graph appeared on 1/3/2012. Click here.
View all notes |
Alert me of new notes |
CANSLIM.net Company Profile |
SEC |
Zacks Reports |
StockTalk |
News |
Chart |
Request a new note
C
A N
S L
I M
|
Symbol/Exchange
Company Name
Industry Group |
PRICE |
CHANGE
(%Change) |
Day High |
Volume
(% DAV)
(% 50 day avg vol) |
52 Wk Hi
% From Hi |
Featured
Date |
Price
Featured |
Pivot Featured |
|
Max Buy |
MG
-
NYSE
Mistras Group Inc
DIVERSIFIED SERVICES - Bulding and Faci;ity Management Services
|
$22.31
|
-0.08
-0.36% |
$23.13
|
270,321
193.64% of 50 DAV
50 DAV is 139,600
|
$26.24
-14.98%
|
10/28/2011
|
$22.49
|
PP = $23.61
|
|
MB = $24.79
|
Most Recent Note - 1/11/2012 5:09:18 PM
Yet another damaging loss today with above average volume. Violation of its 50 DMA line and upward trendline triggered technical sell signals. Based on weak action it will be dropped from the Featured Stocks list tonight. Only a prompt rebound above its 50 DMA line would help its outlook. Reported earnings +38% on +29% sales revenues for the quarter ended November 30, 2011 versus the year ago period.
>>> The latest Featured Stock Update with an annotated graph appeared on 1/6/2012. Click here.
View all notes |
Alert me of new notes |
CANSLIM.net Company Profile |
SEC |
Zacks Reports |
StockTalk |
News |
Chart |
Request a new note
C
A N
S L
I M
|
MKTX
-
NASDAQ
Marketaxess Holdings Inc
FINANCIAL SERVICES - Investment Brokerage - Nationa
|
$30.77
|
-1.39
-4.32% |
$32.01
|
106,309
51.61% of 50 DAV
50 DAV is 206,000
|
$32.23
-4.53%
|
10/28/2011
|
$29.79
|
PP = $31.05
|
|
MB = $32.60
|
Most Recent Note - 1/11/2012 2:44:38 PM
Y - Pulling back today following 2 prior gains into new all-time high territory without truly great volume conviction. The 50 DMA line defines initial chart support to watch.
>>> The latest Featured Stock Update with an annotated graph appeared on 12/20/2011. Click here.
View all notes |
Alert me of new notes |
CANSLIM.net Company Profile |
SEC |
Zacks Reports |
StockTalk |
News |
Chart |
Request a new note
C
A N
S L
I M
|
OSIS
-
NASDAQ
O S I Systems Inc
ELECTRONICS - Semiconductor Equipment and Mate
|
$50.66
|
+0.00
0.00% |
$51.05
|
55,188
52.81% of 50 DAV
50 DAV is 104,500
|
$51.06
-0.78%
|
11/1/2011
|
$42.07
|
PP = $45.57
|
|
MB = $47.85
|
Most Recent Note - 1/9/2012 1:17:41 PM
G - Wedging higher again with today's 5th consecutive small gain, getting extended from its prior base. Its 50 DMA line and recent chart lows near $45 define important near-term support to watch.
>>> The latest Featured Stock Update with an annotated graph appeared on 12/27/2011. Click here.
View all notes |
Alert me of new notes |
CANSLIM.net Company Profile |
SEC |
Zacks Reports |
StockTalk |
News |
Chart |
Request a new note
C
A N
S L
I M
|
PRGO
-
NASDAQ
Perrigo Co
DRUGS - Drug Related Products
|
$97.42
|
-2.16
-2.17% |
$99.24
|
951,516
71.82% of 50 DAV
50 DAV is 1,324,900
|
$104.70
-6.95%
|
12/9/2011
|
$99.54
|
PP = $101.56
|
|
MB = $106.64
|
Most Recent Note - 1/10/2012 2:39:47 PM
G - Gapped up today for a solid gain backed by higher volume, rallying toward previously stubborn resistance in the low $100s.
>>> The latest Featured Stock Update with an annotated graph appeared on 1/9/2012. Click here.
View all notes |
Alert me of new notes |
CANSLIM.net Company Profile |
SEC |
Zacks Reports |
StockTalk |
News |
Chart |
Request a new note
C
A N
S L
I M
|
RAX
-
NYSE
Rackspace Hosting Inc
INTERNET - Internet Software and; Services
|
$42.63
|
+0.56
1.33% |
$42.68
|
1,033,434
62.51% of 50 DAV
50 DAV is 1,653,200
|
$46.50
-8.31%
|
11/8/2011
|
$44.28
|
PP = $46.27
|
|
MB = $48.58
|
Most Recent Note - 1/10/2012 5:45:58 PM
G - Encountering resistance when trying to rebound back above its 50 DMA line, enduring distributional pressure after not making headway above its pivot point. Its 200 DMA line defines the next near-term support level to watch.
>>> The latest Featured Stock Update with an annotated graph appeared on 1/5/2012. Click here.
View all notes |
Alert me of new notes |
CANSLIM.net Company Profile |
SEC |
Zacks Reports |
StockTalk |
News |
Chart |
Request a new note
C
A N
S L
I M
|
Symbol/Exchange
Company Name
Industry Group |
PRICE |
CHANGE
(%Change) |
Day High |
Volume
(% DAV)
(% 50 day avg vol) |
52 Wk Hi
% From Hi |
Featured
Date |
Price
Featured |
Pivot Featured |
|
Max Buy |
SXCI
-
NASDAQ
S X C Health Solutions
COMPUTER SOFTWARE and SERVICES - Healthcare Information Service
|
$64.65
|
+1.85
2.95% |
$64.75
|
661,330
154.01% of 50 DAV
50 DAV is 429,400
|
$66.40
-2.64%
|
1/10/2012
|
$62.05
|
PP = $60.10
|
|
MB = $63.11
|
Most Recent Note - 1/11/2012 4:18:24 PM
G - Finished strong today for its second-best close ever with its 2nd consecutive volume-driven gain, quickly getting extended from its orderly base pattern, and its color code is changed to green. Featured in yellow in the 1/10/12 mid-day report (read here) with pivot point cited based on its 12/02/11 high plus 10 cents. Ownership by top-rated funds has been increasing, rising from 453 in Jun '10 to 600 in Dec '11, a reassuring sign concerning the I criteria. Reported earnings +57% on +163% sales revenues for the quarter ended September 31, 2011 versus the year ago period. Strong prior quarters and good annual earnings history satisfy the C & A criteria.

There are no Featured Stock Updates™ available for this stock at this time. You may request one by clicking the Request a New Note link below
View all notes |
Alert me of new notes |
CANSLIM.net Company Profile |
SEC |
Zacks Reports |
StockTalk |
News |
Chart |
Request a new note
C
A N
S L
I M
|
TDG
-
NYSE
Transdigm Group Inc
AEROSPACE/DEFENSE - Aerospace/Defense Products and; Services
|
$98.37
|
-0.33
-0.33% |
$98.76
|
226,541
64.56% of 50 DAV
50 DAV is 350,900
|
$102.73
-4.24%
|
1/10/2012
|
$98.83
|
PP = $102.83
|
|
MB = $107.97
|
Most Recent Note - 1/10/2012 5:49:48 PM
Y - Gain today on light volume for its best-ever close. No overhead supply remains to act as resistance. Color code was changed to yellow with new pivot point cited based on its 52-week high plus 10 cents. Volume driven gains for new highs may help it clear a base-on-base type pattern. Recent lows in the $90 area define the next nearby support level to watch above its 200 DMA line.
>>> The latest Featured Stock Update with an annotated graph appeared on 1/4/2012. Click here.
View all notes |
Alert me of new notes |
CANSLIM.net Company Profile |
SEC |
Zacks Reports |
StockTalk |
News |
Chart |
Request a new note
C
A N
S L
I M
|
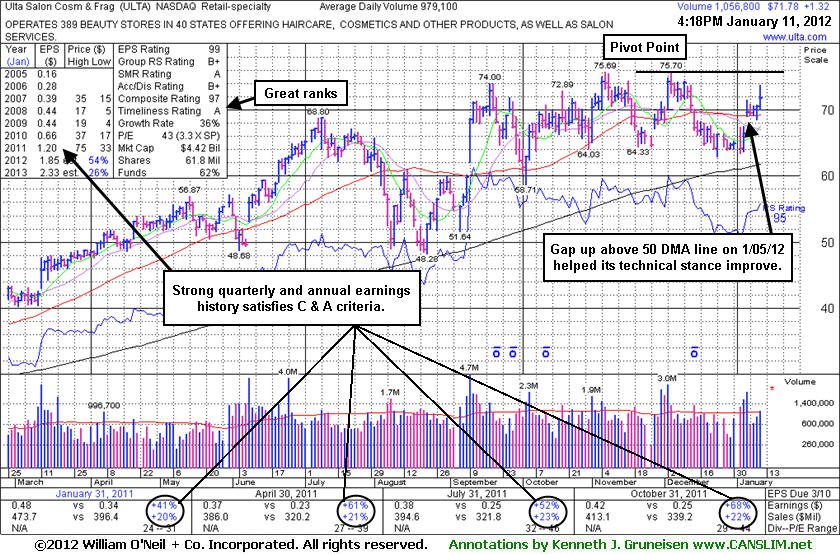
ULTA
-
NASDAQ
Ulta Salon Cosm & Frag
SPECIALTY RETAIL - Specialty Retail, Other
|
$71.78
|
+1.32
1.87% |
$73.78
|
1,057,191
107.98% of 50 DAV
50 DAV is 979,100
|
$75.70
-5.18%
|
1/11/2012
|
$71.97
|
PP = $75.80
|
|
MB = $79.59
|
Most Recent Note - 1/11/2012 5:41:49 PM
Y - Color code was changed to yellow with new pivot point cited based on its 52-week high plus 10 cents while building on a riskier late-stage base. Prior lows near $64 define important chart support above its 200 DMA line. A gap up and rebound above its 50 DMA line has helped its technical stance improve since it was dropped from the Featured Stocks list on 12/22/11. See the latest FSU analysis for more details and a new annotated graph.
>>> The latest Featured Stock Update with an annotated graph appeared on 1/11/2012. Click here.
View all notes |
Alert me of new notes |
CANSLIM.net Company Profile |
SEC |
Zacks Reports |
StockTalk |
News |
Chart |
Request a new note
C
A N
S L
I M
|
V
-
NYSE
Visa Inc Cl A
DIVERSIFIED SERVICES - Business/Management Services
|
$99.11
|
-0.69
-0.69% |
$99.50
|
4,753,217
120.86% of 50 DAV
50 DAV is 3,932,800
|
$103.45
-4.20%
|
10/24/2011
|
$94.21
|
PP = $94.85
|
|
MB = $99.59
|
Most Recent Note - 1/10/2012 5:51:06 PM
G - Down today for a 4th loss in the span of 5 sessions, slumping near its "max buy" level. Prior highs in the $95 area and its 50 DMA line define chart support to watch on pullbacks.
>>> The latest Featured Stock Update with an annotated graph appeared on 12/15/2011. Click here.
View all notes |
Alert me of new notes |
CANSLIM.net Company Profile |
SEC |
Zacks Reports |
StockTalk |
News |
Chart |
Request a new note
C
A N
S L
I M
|