You are not logged in.
This means you
CAN ONLY VIEW reports that were published prior to Monday, April 14, 2025.
You
MUST UPGRADE YOUR MEMBERSHIP if you want to see any current reports.
AFTER MARKET UPDATE - THURSDAY, JANUARY 10TH, 2013
Previous After Market Report Next After Market Report >>>
|
|
|
|
DOW |
+80.71 |
13,471.22 |
+0.60% |
|
Volume |
726,921,800 |
+8% |
|
Volume |
1,702,297,680 |
+1% |
|
NASDAQ |
+15.95 |
3,121.76 |
+0.51% |
|
Advancers |
1,938 |
62% |
|
Advancers |
1,443 |
56% |
|
S&P 500 |
+11.10 |
1,472.12 |
+0.76% |
|
Decliners |
1,046 |
34% |
|
Decliners |
1,036 |
40% |
|
Russell 2000 |
+1.73 |
881.24 |
+0.20% |
|
52 Wk Highs |
297 |
|
|
52 Wk Highs |
173 |
|
|
S&P 600 |
+2.87 |
492.25 |
+0.59% |
|
52 Wk Lows |
4 |
|
|
52 Wk Lows |
11 |
|
|
 |
Major Averages Rallied Into Closing Bell
Kenneth J. Gruneisen - Passed the CAN SLIM® Master's Exam
The major averages rallied into the closing bell on Thursday, after briefly turning negative in mid-session trading, and stocks finished near their best levels of the day. The volume totals were reported higher on the NYSE and on the Nasdaq exchange. Advancers led decliners by nearly 2-1 on the NYSE and by 7-5 on the Nasdaq exchange. The total number of stocks hitting new 52-week highs expanded and easily outnumbered new 52-week lows on the NYSE and on the Nasdaq exchange. There were 97 high-ranked companies from the CANSLIM.net Leaders List making new 52-week highs and appearing on the CANSLIM.net BreakOuts Page, down from the prior session total of 108 stocks. Any sustainable rally requires a healthy crop of companies hitting new 52-week highs, so it remains encouraging to see solid leadership. There were gains for 6 of the 10 high-ranked companies currently included on the Featured Stocks Page.
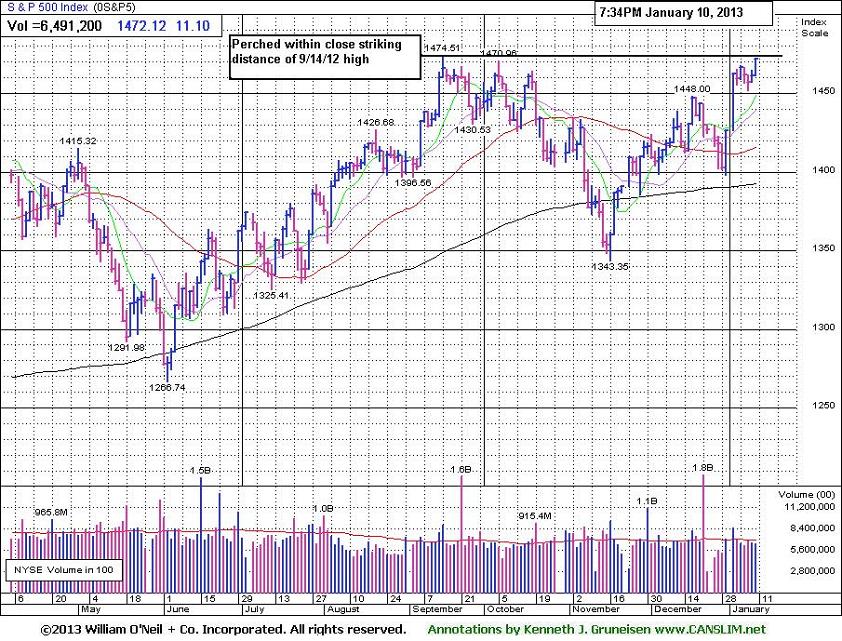
The Dow Jones Industrial Average gained 81 points to 13,471, after being down by as many as 8 points in earlier action. Positive Chinese export data and encouraging comments from the ECB helped investors overlook a disappointing result in weekly jobless claims.
All 10 sectors on the S&P were higher, led by gains in financial stocks including Bank of America Corp (BAC +3.06%). Energy stocks also showed strength including Exxon Mobil Corp (XOM +1.09%). On the earnings front, Nokia Cop (NOK +18.67%) rallied after topping analysts' expectations in the quarter.
Treasuries were lower along the curve with the benchmark 10-year note down 9/32 to yield 1.90% and the 30-year bond off 5/16 of a point to yield 3.08%.
Investors may consider new buying efforts in stocks meeting all key criteria, as the market's (M criteria) confirmed uptrend showed a great expansion in leadership (stocks hitting new 52-week highs) after overcoming recent pressure. Solid gains helped the benchmark S&P 500 Index promptly rebound above its 50-day moving average (DMA) line, and Nasdaq Composite Index and Dow Jones Industrial Average both promptly rebounded above their respective 50 DMA and 200 DMA lines. All of the major averages then blasted above their December highs with additional volume-driven gains.
Watch for an announcement via email concerning the next WEBCAST. The webcast will also be available via an updated link highlighted at the top of the Premium Member Homepage.
PICTURED: The S&P 500 Index is currently perched within close striking distance of its 9/14/12 high. Any meaningful rally above the old high might be viewed as a bullish technical signal which would bode well for the broader market outlook.
|
 Kenneth J. Gruneisen started out as a licensed stockbroker in August 1987, a couple of months prior to the historic stock market crash that took the Dow Jones Industrial Average down -22.6% in a single day. He has published daily fact-based fundamental and technical analysis on high-ranked stocks online for two decades. Through FACTBASEDINVESTING.COM, Kenneth provides educational articles, news, market commentary, and other information regarding proven investment systems that work in good times and bad.
Comments contained in the body of this report are technical opinions only and are not necessarily those of Gruneisen Growth Corp. The material herein has been obtained from sources believed to be reliable and accurate, however, its accuracy and completeness cannot be guaranteed. Our firm, employees, and customers may effect transactions, including transactions contrary to any recommendation herein, or have positions in the securities mentioned herein or options with respect thereto. Any recommendation contained in this report may not be suitable for all investors and it is not to be deemed an offer or solicitation on our part with respect to the purchase or sale of any securities. |
|
 |
Financial, Defensive, and Tech Gains Boosted Market
Kenneth J. Gruneisen - Passed the CAN SLIM® Master's Exam
Financial shares were a positive influence as the Bank Index ($BKX +1.34%) and the Broker/Dealer Index ($XBD +0.70%) posted gains, and the Retail Index ($RLX +0.36%) also edged higher. Defensive groups had a positive bias as the Healthcare Index ($HMO +1.58%) and the Gold & Silver Index ($XAU +2.36%) posted solid gains. The energy group also helped the major averages rise as the Integrated Oil Index ($XOI +1.00%) and the Oil Services Index ($OSX +1.25%) traded higher. The tech sector had a positive bias as the Networking Index ($NWX +1.12%), Semiconductor Index ($SOX +1.33%), and the Internet Index ($IIX +0.43%) posted gains, but the Biotechnology Index ($BTK -0.93%) was clearly a laggard as it lost ground on the mostly positive session.
Charts courtesy www.stockcharts.com
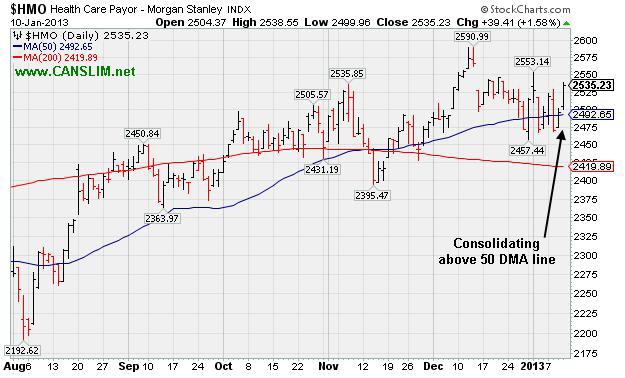
PICTURED: The Healthcare Index ($HMO +1.58%) is consolidating above its 50-day moving average (DMA) line.
| Oil Services |
$OSX |
232.33 |
+2.87 |
+1.25% |
+5.53% |
| Healthcare |
$HMO |
2,535.23 |
+39.41 |
+1.58% |
+0.84% |
| Integrated Oil |
$XOI |
1,281.42 |
+12.64 |
+1.00% |
+3.19% |
| Semiconductor |
$SOX |
400.73 |
+5.26 |
+1.33% |
+4.34% |
| Networking |
$NWX |
237.41 |
+2.62 |
+1.12% |
+4.79% |
| Internet |
$IIX |
337.49 |
+1.46 |
+0.43% |
+3.21% |
| Broker/Dealer |
$XBD |
98.41 |
+0.68 |
+0.70% |
+4.33% |
| Retail |
$RLX |
666.52 |
+2.41 |
+0.36% |
+2.06% |
| Gold & Silver |
$XAU |
163.61 |
+3.77 |
+2.36% |
-1.20% |
| Bank |
$BKX |
53.60 |
+0.71 |
+1.34% |
+4.52% |
| Biotech |
$BTK |
1,620.24 |
-15.26 |
-0.93% |
+4.73% |
|
|
|
 |
Light Volume Behind Gains Into New High Ground
Kenneth J. Gruneisen - Passed the CAN SLIM® Master's Exam
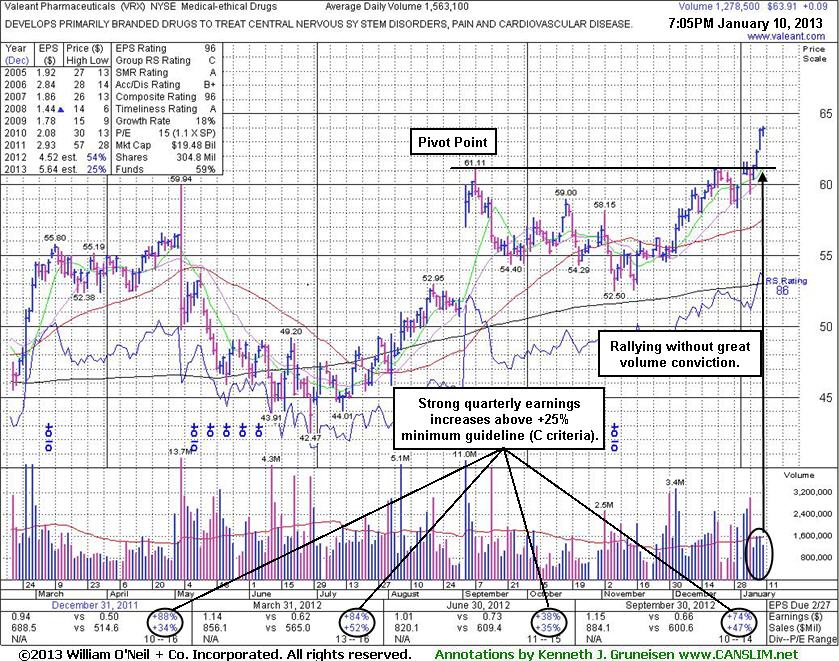
Valeant Pharmaceuticals (VRX +$0.09 or +0.14% to $63.91) rallied further above its pivot point today for another new 52-week high, however, behind its latest spurt of gains volume was below the +40% above average guideline which is the bare minimum threshold needed to trigger a proper technical buy signal. It was last shown in this FSU section on 12/28/12 with an annotated graph under then headline "Finished Near Pivot Point With Volume Behind Solid Gain". Subsequent gains helped it approach the pivot point cited based on its 9/07/12 high plus 10 cents when highlighted in yellow in the 12/20/12 mid-day report (read here).
Prior articles reminded members that in the Certification they teach a tactic called "pyramiding" that allows investors to let the market action dictate how heavily they position themselves in fresh buy candidates. VRX encountered distributional pressure near the $60-61 area, and it remains below its "max buy" level. The wedging action of late is not as bullish as a solid burst of volume behind gains into new high territory would be, meanwhile, investors employing the pyramiding technique may have accumulated partial positions.
Quarterly earnings increases (C criteria) have been strong and well above the +25% guideline. A downturn in FY '07 and '08 earnings (A criteria) has been followed by a strong earnings rebound in recent years. The number of top-rated funds owning its shares rose from 818 in Mar '12 in to 887 in Dec '12, a reassuring trend concerning the I criteria. Its current Up/Down Volume Ratio of 1.6 is also an unbiased indication that its shares have been under accumulation over the past 50 days. Although it is of some concern that the Medical - Ethical Drugs group's Relative Strength rating is weak, there have been a couple of strong performers in the group which offer reassuring signs concerning the L criteria.
|
|
|
Color Codes Explained :
Y - Better candidates highlighted by our
staff of experts.
G - Previously featured
in past reports as yellow but may no longer be buyable under the
guidelines.
***Last / Change / Volume data in this table is the closing quote data***
Symbol/Exchange
Company Name
Industry Group |
PRICE |
CHANGE
(%Change) |
Day High |
Volume
(% DAV)
(% 50 day avg vol) |
52 Wk Hi
% From Hi |
Featured
Date |
Price
Featured |
Pivot Featured |
|
Max Buy |
CELG
-
NASDAQ
Celgene Corp
DRUGS - Drug Manufacturers - Major
|
$95.48
|
+3.14
3.40% |
$95.53
|
6,497,082
200.34% of 50 DAV
50 DAV is 3,243,100
|
$93.13
2.52%
|
12/11/2012
|
$82.24
|
PP = $81.34
|
|
MB = $85.41
|
 Most Recent Note - 1/10/2013 12:03:50 PM
G - On track for an 8th consecutive gain today, getting very extended from its prior base. Prior highs near $81-82 define initial support to watch on pullbacks.
>>> The latest Featured Stock Update with an annotated graph appeared on 1/3/2013. Click here.
View all notes |
Alert me of new notes |
CANSLIM.net Company Profile |
SEC |
Zacks Reports |
StockTalk |
News |
Chart |
Request a new note
C
A N
S L
I M


|
CFNL
-
NASDAQ
Cardinal Financial Corp
BANKING - Regional - Southeast Banks
|
$16.41
|
-0.07
-0.42% |
$16.53
|
253,407
116.35% of 50 DAV
50 DAV is 217,800
|
$16.90
-2.90%
|
12/3/2012
|
$15.20
|
PP = $16.31
|
|
MB = $17.13
|
Most Recent Note - 1/8/2013 2:33:49 PM
Y - Poised for a best-ever close with above average volume behind today's gain, yet still trading below its "max buy" level. Hit a new 52-week high and cleared its pivot point on 1/02/13 with sufficient volume to trigger a proper new (or add-on) technical buy signal.
>>> The latest Featured Stock Update with an annotated graph appeared on 12/31/2012. Click here.
View all notes |
Alert me of new notes |
CANSLIM.net Company Profile |
SEC |
Zacks Reports |
StockTalk |
News |
Chart |
Request a new note
C
A N
S L
I M
|
CMCSA
-
NASDAQ
Comcast Corp Cl A
MEDIA - CATV Systems
|
$38.50
|
+0.08
0.21% |
$38.76
|
10,497,754
88.10% of 50 DAV
50 DAV is 11,915,600
|
$38.58
-0.21%
|
12/3/2012
|
$37.08
|
PP = $38.06
|
|
MB = $39.96
|
Most Recent Note - 1/8/2013 2:36:18 PM
Y - It stalled and has been hovering near its 52-week high since its gain above its pivot point on 1/02/12 had sufficient volume to trigger a technical buy signal. No resistance remains due to overhead supply.
>>> The latest Featured Stock Update with an annotated graph appeared on 12/27/2012. Click here.
View all notes |
Alert me of new notes |
CANSLIM.net Company Profile |
SEC |
Zacks Reports |
StockTalk |
News |
Chart |
Request a new note
C
A N
S L
I M
|
LULU
-
NASDAQ
Lululemon Athletica
MANUFACTURING - Textile Manufacturing
|
$70.58
|
-0.46
-0.65% |
$71.37
|
2,057,625
102.70% of 50 DAV
50 DAV is 2,003,600
|
$81.09
-12.96%
|
12/26/2012
|
$73.81
|
PP = $77.95
|
|
MB = $81.85
|
Most Recent Note - 1/8/2013 2:41:18 PM
G - Holding its ground today near its 50 DMA line and trading -12.1% off its 52-week high. Distributional losses on above average volume raised concerns following a "negative reversal" on 1/02/13. Disciplined investors waited to take any action after it was recently noted - "Subsequent volume-driven gains above its pivot point are still needed to trigger a new technical buy signal."
>>> The latest Featured Stock Update with an annotated graph appeared on 12/28/2012. Click here.
View all notes |
Alert me of new notes |
CANSLIM.net Company Profile |
SEC |
Zacks Reports |
StockTalk |
News |
Chart |
Request a new note
C
A N
S L
I M
|
MIDD
-
NASDAQ
Middleby Corp
MANUFACTURING - Diversified Machinery
|
$131.49
|
-0.35
-0.27% |
$132.70
|
25,794
28.85% of 50 DAV
50 DAV is 89,400
|
$134.51
-2.25%
|
10/8/2012
|
$118.46
|
PP = $122.67
|
|
MB = $128.80
|
Most Recent Note - 1/8/2013 2:43:21 PM
G - Holding its ground stubbornly near its 52-week and all-time highs with recent volume totals below average. Earnings +23% on +18% sales for the Sep '12 quarter, below the +25% minimum earnings guideline (C criteria), raised concerns.
>>> The latest Featured Stock Update with an annotated graph appeared on 12/26/2012. Click here.
View all notes |
Alert me of new notes |
CANSLIM.net Company Profile |
SEC |
Zacks Reports |
StockTalk |
News |
Chart |
Request a new note
C
A N
S L
I M
|
Symbol/Exchange
Company Name
Industry Group |
PRICE |
CHANGE
(%Change) |
Day High |
Volume
(% DAV)
(% 50 day avg vol) |
52 Wk Hi
% From Hi |
Featured
Date |
Price
Featured |
Pivot Featured |
|
Max Buy |
N
-
NYSE
Netsuite Inc
DIVERSIFIED SERVICES - Business/Management Services
|
$69.88
|
-0.47
-0.67% |
$70.80
|
184,808
43.40% of 50 DAV
50 DAV is 425,800
|
$70.58
-0.99%
|
12/12/2012
|
$64.75
|
PP = $67.12
|
|
MB = $70.48
|
Most Recent Note - 1/9/2013 5:43:06 PM
Y - Gains above its pivot point have been marked by below average volume. Disciplined investors know that volume must be at least +40% above average behind gains above the pivot point to trigger a proper technical buy signal.
>>> The latest Featured Stock Update with an annotated graph appeared on 1/4/2013. Click here.
View all notes |
Alert me of new notes |
CANSLIM.net Company Profile |
SEC |
Zacks Reports |
StockTalk |
News |
Chart |
Request a new note
C
A N
S L
I M
|
NSR
-
NYSE
Neustar Inc
TELECOMMUNICATIONS - Diversified Communication Serv
|
$43.17
|
+0.28
0.65% |
$43.31
|
497,731
120.40% of 50 DAV
50 DAV is 413,400
|
$43.90
-1.66%
|
12/11/2012
|
$41.85
|
PP = $41.41
|
|
MB = $43.48
|
Most Recent Note - 1/8/2013 2:45:22 PM
Y - Quietly consolidating just below its "max buy" level and its color code is changed to yellow. Subsequent deterioration below its old high close ($41.05 on 10/05/12) could negate its recent breakout, a worrisome sign.
>>> The latest Featured Stock Update with an annotated graph appeared on 1/2/2013. Click here.
View all notes |
Alert me of new notes |
CANSLIM.net Company Profile |
SEC |
Zacks Reports |
StockTalk |
News |
Chart |
Request a new note
C
A N
S L
I M
|
RAX
-
NYSE
Rackspace Hosting Inc
INTERNET - Internet Software and; Services
|
$77.78
|
+0.03
0.04% |
$78.36
|
1,198,600
83.20% of 50 DAV
50 DAV is 1,440,700
|
$78.22
-0.56%
|
12/18/2012
|
$71.88
|
PP = $70.10
|
|
MB = $73.61
|
Most Recent Note - 1/8/2013 2:46:54 PM
G - Inching to another new all-time high with today's gain lacking great volume conviction. Getting extended from its prior base, meanwhile prior highs in the $70 area define initial support to watch.
>>> The latest Featured Stock Update with an annotated graph appeared on 1/8/2013. Click here.
View all notes |
Alert me of new notes |
CANSLIM.net Company Profile |
SEC |
Zacks Reports |
StockTalk |
News |
Chart |
Request a new note
C
A N
S L
I M
|
RNF
-
NYSE
Rentech Nitrogen Ptnr Lp
CHEMICALS - Agricultural Chemicals
|
$46.13
|
+1.74
3.92% |
$46.22
|
595,037
191.58% of 50 DAV
50 DAV is 310,600
|
$44.73
3.12%
|
11/1/2012
|
$39.11
|
PP = $40.15
|
|
MB = $42.16
|
Most Recent Note - 1/10/2013 12:46:23 PM
G - Getting more extended from a sound base after gapping up today while on track for a 9th consecutive gain. Prior highs in the $40 area define initial support to watch on pullbacks. See latest FSU analysis for more details and a new annotated graph.
>>> The latest Featured Stock Update with an annotated graph appeared on 1/9/2013. Click here.
View all notes |
Alert me of new notes |
CANSLIM.net Company Profile |
SEC |
Zacks Reports |
StockTalk |
News |
Chart |
Request a new note
C
A N
S L
I M
|
VRX
-
NYSE
Valeant Pharmaceuticals
DRUGS - Drug Manufacturers - Other
|
$63.91
|
+0.09
0.14% |
$64.12
|
1,279,175
81.84% of 50 DAV
50 DAV is 1,563,100
|
$63.92
-0.02%
|
12/20/2012
|
$60.24
|
PP = $61.21
|
|
MB = $64.27
|
Most Recent Note - 1/9/2013 8:27:07 PM
Y - Rallied further above its pivot point to another new 52-week high today , however volume thus far is below the +40% above average volume guideline which is the bare minimum threshold needed to trigger a proper technical buy signal. Disciplined investors may use a tactic called "pyramiding" to allow market action to dictate their positioning.
>>> The latest Featured Stock Update with an annotated graph appeared on 1/10/2013. Click here.
View all notes |
Alert me of new notes |
CANSLIM.net Company Profile |
SEC |
Zacks Reports |
StockTalk |
News |
Chart |
Request a new note
C
A N
S L
I M
|
Symbol/Exchange
Company Name
Industry Group |
PRICE |
CHANGE
(%Change) |
Day High |
Volume
(% DAV)
(% 50 day avg vol) |
52 Wk Hi
% From Hi |
Featured
Date |
Price
Featured |
Pivot Featured |
|
Max Buy |
|
|
|
THESE ARE NOT BUY RECOMMENDATIONS!
Comments contained in the body of this report are technical
opinions only. The material herein has been obtained
from sources believed to be reliable and accurate, however,
its accuracy and completeness cannot be guaranteed.
This site is not an investment advisor, hence it does
not endorse or recommend any securities or other investments.
Any recommendation contained in this report may not
be suitable for all investors and it is not to be deemed
an offer or solicitation on our part with respect to
the purchase or sale of any securities. All trademarks,
service marks and trade names appearing in this report
are the property of their respective owners, and are
likewise used for identification purposes only.
This report is a service available
only to active Paid Premium Members.
You may opt-out of receiving report notifications
at any time. Questions or comments may be submitted
by writing to Premium Membership Services 665 S.E. 10 Street, Suite 201 Deerfield Beach, FL 33441-5634 or by calling 1-800-965-8307
or 954-785-1121.
|
|
|

