You are not logged in.
This means you
CAN ONLY VIEW reports that were published prior to Monday, April 14, 2025.
You
MUST UPGRADE YOUR MEMBERSHIP if you want to see any current reports.
AFTER MARKET UPDATE - TUESDAY, JANUARY 10TH, 2012
Previous After Market Report Next After Market Report >>>
|
|
|
|
DOW |
+69.78 |
12,462.47 |
+0.56% |
|
Volume |
840,847,150 |
+17% |
|
Volume |
1,779,479,910 |
+1% |
|
NASDAQ |
+25.94 |
2,702.50 |
+0.97% |
|
Advancers |
2,323 |
74% |
|
Advancers |
1,848 |
69% |
|
S&P 500 |
+11.38 |
1,292.08 |
+0.89% |
|
Decliners |
691 |
22% |
|
Decliners |
707 |
27% |
|
Russell 2000 |
+11.24 |
764.75 |
+1.49% |
|
52 Wk Highs |
150 |
|
|
52 Wk Highs |
104 |
|
|
S&P 600 |
+5.99 |
427.62 |
+1.42% |
|
52 Wk Lows |
14 |
|
|
52 Wk Lows |
28 |
|
|
 |
Major Averages Rally With Leadership Expanding
Kenneth J. Gruneisen - Passed the CAN SLIM® Master's Exam
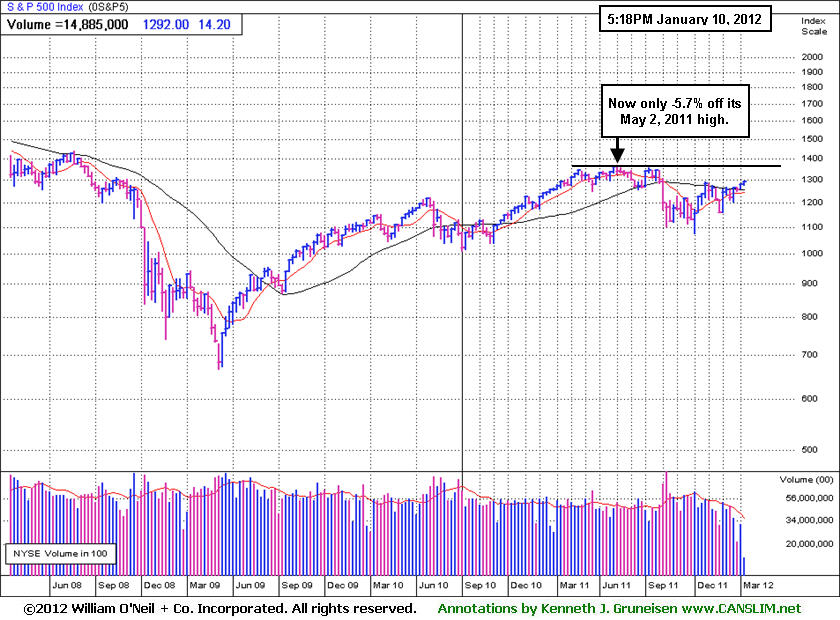
The three major averages remain in rally mode while the tech-heavy Nasdaq Composite Index rose for a fourth straight session on Tuesday and the S&P 500 Index rose to its highest level since July. The reported volume totals were higher again versus the prior session on the NYSE and on the Nasdaq exchange. Breadth on the session was positive as advancers led decliners by more than 3-1 on the NYSE and by nearly 3-1 on the Nasdaq exchange. New 52-week highs solidly outnumbered new 52-week lows on the NYSE and on the Nasdaq exchange. There were 73 high-ranked companies from the CANSLIM.net Leaders List that made new 52-week highs and appeared on the CANSLIM.net BreakOuts Page, up substantially from the prior session total of 38 stocks. The strong expansion in leadership is a reassuring sign concerning the M criteria, as a healthy crop of strong leaders is necessary for any sustained market advance. There were gains for 14 of the 18 high-ranked companies currently included on the Featured Stocks Page.
A decline in China's import growth in December spurred speculation of monetary easing by the world's second largest economy. Material, financial and industrial stocks led a widespread rally. Alcoa Inc (AA) finished up 1 cent to $9.44 after rising as much as +4.5% on better-than-expected top-line results and outlook. Freeport-McMoRan Copper & Gold Inc. (FCX +4.0%) climbed in sympathy with higher metal prices on a weaker dollar. Shares of Caterpillar Inc (CAT +2.95%) contributed the most to the Dow's advance.
Citigroup Inc (C +3.16%) and Bank of America Corp (BAC +5.64%) helped the financials outperform. Sitting out the rally were Tiffany & Co (TIF -10.46%) after lowering its guidance, and Goodyear Tire & Rubber Co (GT -8.31%), stumbling after giving cautious comments on volumes during an investor conference.
European markets finished higher with the FTSE up +1.5% in London and the DAX up +2.4% in Germany.
The Q4 2011 CANSLIM.net Webcast is still available "ON DEMAND" to all upgraded members at no additional cost. Via the Premium Member Homepage links to all prior reports and webcasts are always available.
PICTURED: The S&P 500 Index rose to its highest level since July, and it closed -5.7% off its May 2, 2011 high. The market (M criteria) is currently in a confirmed uptrend, which means that disciplined investors' odds are considered favorable for accumulating shares of sound buy candidates in the days ahead.
|
 Kenneth J. Gruneisen started out as a licensed stockbroker in August 1987, a couple of months prior to the historic stock market crash that took the Dow Jones Industrial Average down -22.6% in a single day. He has published daily fact-based fundamental and technical analysis on high-ranked stocks online for two decades. Through FACTBASEDINVESTING.COM, Kenneth provides educational articles, news, market commentary, and other information regarding proven investment systems that work in good times and bad.
Comments contained in the body of this report are technical opinions only and are not necessarily those of Gruneisen Growth Corp. The material herein has been obtained from sources believed to be reliable and accurate, however, its accuracy and completeness cannot be guaranteed. Our firm, employees, and customers may effect transactions, including transactions contrary to any recommendation herein, or have positions in the securities mentioned herein or options with respect thereto. Any recommendation contained in this report may not be suitable for all investors and it is not to be deemed an offer or solicitation on our part with respect to the purchase or sale of any securities. |
|
 |
Financial, Commodity-Linked, Tech, and Medical Groups Led Gainers
Kenneth J. Gruneisen - Passed the CAN SLIM® Master's Exam
Gains from financial shares helped underpin the major averages' rally as the Broker/Dealer Index ($XBD +2.78%) and Bank Index ($BKX +1.85%) rallied on Tuesday. Strength in commodity-linked groups boosted the Gold & Silver Index ($XAU +1.95%), Oil Services Index ($OSX +2.49%), and Integrated Oil Index ($XOI +0.70%). Medical-related shares were strong as the Healthcare Index ($HMO +1.50%) and Biotechnology Index ($BTK +2.37%) posted decent gains. The Semiconductor Index ($SOX +0.96%) and Networking Index ($NWX +1.71%) also led the tech sector higher, but the Internet Index ($IIX -0.12%) was a laggard. The Retail Index ($RLX +0.44%) rounded out the mostly positive session with a modest gain.
Charts courtesy www.stockcharts.com
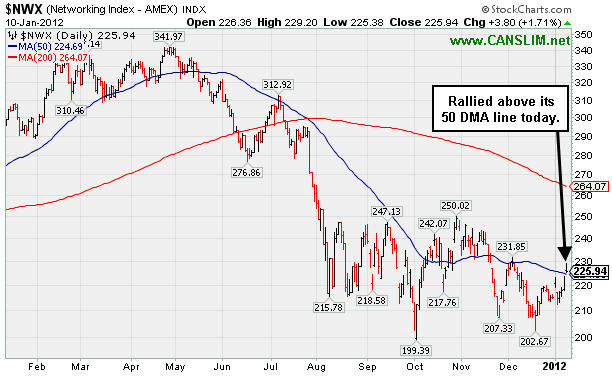
PICTURED: The Networking Index ($NWX +1.71%) has rallied back above its 50-day moving average (DMA) line.
| Oil Services |
$OSX |
230.14 |
+5.60 |
+2.49% |
+6.41% |
| Healthcare |
$HMO |
2,495.56 |
+36.78 |
+1.50% |
+9.38% |
| Integrated Oil |
$XOI |
1,263.08 |
+8.80 |
+0.70% |
+2.76% |
| Semiconductor |
$SOX |
386.28 |
+3.69 |
+0.96% |
+5.99% |
| Networking |
$NWX |
225.93 |
+3.79 |
+1.71% |
+5.01% |
| Internet |
$IIX |
288.07 |
-0.35 |
-0.12% |
+2.25% |
| Broker/Dealer |
$XBD |
89.30 |
+2.42 |
+2.78% |
+7.24% |
| Retail |
$RLX |
533.99 |
+2.32 |
+0.44% |
+2.06% |
| Gold & Silver |
$XAU |
191.70 |
+3.67 |
+1.95% |
+6.12% |
| Bank |
$BKX |
42.86 |
+0.78 |
+1.85% |
+8.84% |
| Biotech |
$BTK |
1,202.59 |
+27.87 |
+2.37% |
+10.19% |
|
|
|
 |
Retail Apparel Firm Gapped Up For Considerable Volume-Driven Gain
Kenneth J. Gruneisen - Passed the CAN SLIM® Master's Exam
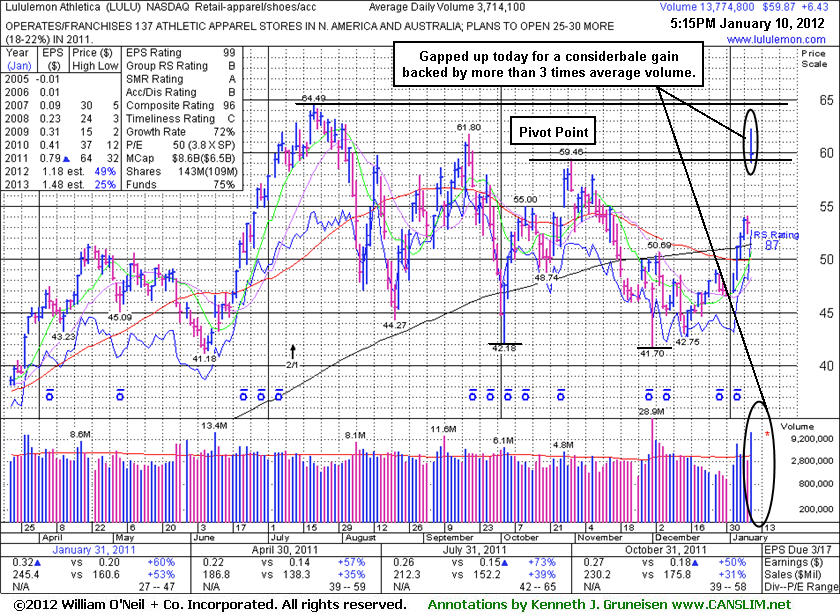
Lululemon Athletica (LULU +$6.43 or +12.03% to $59.87) gapped up today, rising from a "double bottom" base and challenging prior chart highs in the low $60s that may now act as a resistance level. In the mid-day report (read here) its color code was changed to yellow with pivot point cited based on its 10/31/11 high. It went through a long and choppy consolidation since last noted on 9/20/11. Its fundamental characteristics (C and A criteria) remain strong. Reported earnings +50% on +31% sales revenues for the quarter ended October 31, 2011 versus the year ago period. This high-ranked Retail-Apparel firm has confirmed a new technical buy signal with its solid gain above the new pivot point cited. A little bit of overhead supply remains to hinder its progress, yet it could work through that resistance in the days ahead and go on to produce more climactic gains. As always, limit losses by selling if ever a stock fall more than -7% from your purchase price.
Its last appearance in this FSU section was on 7/15/11 with an annotated graph under the headline, "Extended After +20% Gains in First 2-3 Weeks After Latest Breakout", and based on subsequent weak action on 8/05/11 it was dropped from the Featured Stocks list. The number of top-rated funds owning its shares rose from 262 in Mar '11 to 429 in Dec '11. The 8 latest quarterly comparisons showed strong sales revenues and impressive earnings increases (C criteria), and it maintained a good annual earnings history (A criteria) despite a patch of negative comparisons in early '09. LULU was first featured in yellow at $47.66 in the October 8, 2010 mid-day report report (read here) and it traded up as much as +163.7% in a little more than 9 months.
 |
|
|
Color Codes Explained :
Y - Better candidates highlighted by our
staff of experts.
G - Previously featured
in past reports as yellow but may no longer be buyable under the
guidelines.
***Last / Change / Volume data in this table is the closing quote data***
Symbol/Exchange
Company Name
Industry Group |
PRICE |
CHANGE
(%Change) |
Day High |
Volume
(% DAV)
(% 50 day avg vol) |
52 Wk Hi
% From Hi |
Featured
Date |
Price
Featured |
Pivot Featured |
|
Max Buy |
ADS
-
NYSE
Alliance Data Sys Corp
COMPUTER SOFTWARE and SERVICES - Information and Delivery Service
|
$104.96
|
+0.77
0.74% |
$105.77
|
795,436
110.00% of 50 DAV
50 DAV is 723,100
|
$107.33
-2.21%
|
10/21/2011
|
$97.94
|
PP = $101.15
|
|
MB = $106.21
|
 Most Recent Note - 1/10/2012 5:44:09 PM
Y - Up for a 4th consecutive gain today after finding prompt support near its 50 DMA line, still perched within close striking distance of its all-time high. However, a subsequent violation of the 1/04/12 session low ($100.42) would raise greater concerns and trigger a technical sell signal.
>>> The latest Featured Stock Update with an annotated graph appeared on 12/14/2011. Click here.
View all notes |
Alert me of new notes |
CANSLIM.net Company Profile |
SEC |
Zacks Reports |
StockTalk |
News |
Chart |
Request a new note
C
A N
S L
I M


|
ALXN
-
NASDAQ
Alexion Pharmaceuticals
DRUGS - Drug Manufacturers - Other
|
$74.68
|
+0.41
0.55% |
$75.71
|
1,651,158
140.07% of 50 DAV
50 DAV is 1,178,800
|
$76.20
-1.99%
|
11/30/2011
|
$68.66
|
PP = $70.52
|
|
MB = $74.05
|
Most Recent Note - 1/9/2012 12:25:45 PM
G - Color code is changed to green after rallying beyond its "max buy" level for new all-time highs today with volume running at an above average pace for a 3rd consecutive session. The prior gain above its pivot point had +53% above average volume, meeting the investment system guidelines for a technical buy signal. Its 50 DMA line defines near-term support above prior lows in the $62 area.
>>> The latest Featured Stock Update with an annotated graph appeared on 12/12/2011. Click here.
View all notes |
Alert me of new notes |
CANSLIM.net Company Profile |
SEC |
Zacks Reports |
StockTalk |
News |
Chart |
Request a new note
C
A N
S L
I M
|
CATM
-
NASDAQ
Cardtronics Inc
DIVERSIFIED SERVICES - Business/Management Services
|
$26.52
|
+0.27
1.03% |
$26.83
|
311,331
89.98% of 50 DAV
50 DAV is 346,000
|
$28.74
-7.72%
|
12/23/2011
|
$28.64
|
PP = $28.56
|
|
MB = $29.99
|
Most Recent Note - 1/6/2012 3:42:29 PM
G - Slumping under its 50 DMA line today with a loss raising concerns, and its color code is changed to green. Previously noted, "The gain on 12/23/11 was backed by +77% above average volume and it touched a new 52-week high, but it did not close above the new pivot point cited based on its 11/08/11 high plus 10 cents."
>>> The latest Featured Stock Update with an annotated graph appeared on 12/23/2011. Click here.
View all notes |
Alert me of new notes |
CANSLIM.net Company Profile |
SEC |
Zacks Reports |
StockTalk |
News |
Chart |
Request a new note
C
A N
S L
I M
|
CELG
-
NASDAQ
Celgene Corp
DRUGS - Drug Manufacturers - Major
|
$70.26
|
+2.03
2.98% |
$70.77
|
5,424,273
159.00% of 50 DAV
50 DAV is 3,411,500
|
$69.26
1.44%
|
12/20/2011
|
$66.68
|
PP = $68.35
|
|
MB = $71.77
|
Most Recent Note - 1/10/2012 2:50:59 PM
Y - Gapped up today, rallying into new 52-week high territory unhindered by overhead supply. Gains above the pivot point with sufficient above average volume and a strong close may trigger a convincing new (or add-on) technical buy signal.
>>> The latest Featured Stock Update with an annotated graph appeared on 12/29/2011. Click here.
View all notes |
Alert me of new notes |
CANSLIM.net Company Profile |
SEC |
Zacks Reports |
StockTalk |
News |
Chart |
Request a new note
C
A N
S L
I M
|
FEIC
-
NASDAQ
F E I Co
ELECTRONICS - Diversified Electronics
|
$42.38
|
+0.44
1.05% |
$42.68
|
368,464
111.83% of 50 DAV
50 DAV is 329,500
|
$43.00
-1.44%
|
12/7/2011
|
$41.41
|
PP = $42.35
|
|
MB = $44.47
|
Most Recent Note - 1/9/2012 2:12:19 PM
Y - Holding its ground following a "positive reversal" on 1/05/12, still hovering near its all-time high. The 50 DMA line (now $39.89) defines chart support above prior lows. Disciplined investors would still be watching for a volume-driven gain above the pivot point to trigger a proper technical buy signal.
>>> The latest Featured Stock Update with an annotated graph appeared on 12/21/2011. Click here.
View all notes |
Alert me of new notes |
CANSLIM.net Company Profile |
SEC |
Zacks Reports |
StockTalk |
News |
Chart |
Request a new note
C
A N
S L
I M
|
Symbol/Exchange
Company Name
Industry Group |
PRICE |
CHANGE
(%Change) |
Day High |
Volume
(% DAV)
(% 50 day avg vol) |
52 Wk Hi
% From Hi |
Featured
Date |
Price
Featured |
Pivot Featured |
|
Max Buy |
GNC
-
NYSE
G N C Holdings Inc
RETAIL - Drug Stores
|
$28.04
|
-0.45
-1.58% |
$29.02
|
532,307
43.48% of 50 DAV
50 DAV is 1,224,300
|
$29.50
-4.95%
|
10/26/2011
|
$24.60
|
PP = $24.80
|
|
MB = $26.04
|
Most Recent Note - 1/9/2012 2:08:08 PM
G - Overcame early weakness and managed a positive reversal, finding prompt support after briefly undercutting its 50 DMA line. Subsequent losses below its intra-day low ($26.54) would raise more serious concerns and trigger technical sell signals.
>>> The latest Featured Stock Update with an annotated graph appeared on 12/16/2011. Click here.
View all notes |
Alert me of new notes |
CANSLIM.net Company Profile |
SEC |
Zacks Reports |
StockTalk |
News |
Chart |
Request a new note
C
A N
S L
I M
|
HMSY
-
NASDAQ
H M S Holdings Corp
COMPUTER SOFTWARE and SERVICES - Healthcare Information Service
|
$32.17
|
+0.33
1.04% |
$32.22
|
460,933
42.62% of 50 DAV
50 DAV is 1,081,500
|
$32.83
-2.01%
|
10/27/2011
|
$26.44
|
PP = $28.37
|
|
MB = $29.79
|
Most Recent Note - 1/6/2012 5:54:08 PM
G - Hovering in a tight range near its all-time high with volume totals cooling. No resistance remains, but it is slightly extended from its prior base.
>>> The latest Featured Stock Update with an annotated graph appeared on 12/28/2011. Click here.
View all notes |
Alert me of new notes |
CANSLIM.net Company Profile |
SEC |
Zacks Reports |
StockTalk |
News |
Chart |
Request a new note
C
A N
S L
I M
|
ISRG
-
NASDAQ
Intuitive Surgical Inc
HEALTH SERVICES - Medical Appliances and Equipment
|
$450.19
|
-1.31
-0.29% |
$456.44
|
435,300
140.74% of 50 DAV
50 DAV is 309,300
|
$474.50
-5.12%
|
12/20/2011
|
$442.43
|
PP = $449.16
|
|
MB = $471.62
|
Most Recent Note - 1/10/2012 12:26:02 PM
Y - Pulling back for a 3rd consecutive session. Recently enduring mild distributional pressure while churning near its all-time high, and previously noted, "Recent gains above its pivot point have lacked the volume needed to trigger a proper new (or add-on) technical buy signal. Important support is defined by its 50 DMA line."
>>> The latest Featured Stock Update with an annotated graph appeared on 12/13/2011. Click here.
View all notes |
Alert me of new notes |
CANSLIM.net Company Profile |
SEC |
Zacks Reports |
StockTalk |
News |
Chart |
Request a new note
C
A N
S L
I M
|
LULU
-
NASDAQ
Lululemon Athletica
MANUFACTURING - Textile Manufacturing
|
$59.87
|
+6.43
12.03% |
$62.25
|
13,781,096
371.05% of 50 DAV
50 DAV is 3,714,100
|
$64.49
-7.16%
|
1/10/2012
|
$60.97
|
PP = $59.46
|
|
MB = $62.43
|
Most Recent Note - 1/10/2012 12:36:04 PM
Y - Gapped up today, rising from a "double bottom" base and challenging prior chart highs in the low $60s that may now act as a resistance level. Color code is changed to yellow with pivot point cited based on its 10/31/11 high. It went through a long and choppy consolidation since last noted on 9/20/11. On 8/05/11 it was dropped from the Featured Stocks list. Its fundamental characteristics (C and A criteria) remain strong. Reported earnings +50% on +31% sales revenues for the quarter ended October 31, 2011 versus the year ago period.
>>> The latest Featured Stock Update with an annotated graph appeared on 1/10/2012. Click here.
View all notes |
Alert me of new notes |
CANSLIM.net Company Profile |
SEC |
Zacks Reports |
StockTalk |
News |
Chart |
Request a new note
C
A N
S L
I M
|
MA
-
NYSE
Mastercard Inc Cl A
DIVERSIFIED SERVICES - Business/Management Services
|
$348.83
|
+3.01
0.87% |
$351.28
|
1,025,167
97.86% of 50 DAV
50 DAV is 1,047,600
|
$384.99
-9.39%
|
1/3/2012
|
$367.87
|
PP = $385.09
|
|
MB = $404.34
|
Most Recent Note - 1/6/2012 3:39:29 PM
G - Down for a 4th consecutive session with above average volume. Failed to attract support since violating its 50 DMA line and triggering a technical sell signal on 1/04/12 when last noted - "Another damaging loss is raising concerns, and its color code is changed to green while now encountering distributional pressure after building a riskier late-stage base. Only a prompt rebound above its short-term average would help its outlook. The 1/03/12 mid-day report (read here) cited a new pivot point based on its 52-week high plus 10 cents. Quarterly and annual earnings history makes it a good match with the C and A criteria. See the latest FSU analysis for an annotated weekly graph."
>>> The latest Featured Stock Update with an annotated graph appeared on 1/3/2012. Click here.
View all notes |
Alert me of new notes |
CANSLIM.net Company Profile |
SEC |
Zacks Reports |
StockTalk |
News |
Chart |
Request a new note
C
A N
S L
I M
|
Symbol/Exchange
Company Name
Industry Group |
PRICE |
CHANGE
(%Change) |
Day High |
Volume
(% DAV)
(% 50 day avg vol) |
52 Wk Hi
% From Hi |
Featured
Date |
Price
Featured |
Pivot Featured |
|
Max Buy |
MG
-
NYSE
Mistras Group Inc
DIVERSIFIED SERVICES - Bulding and Faci;ity Management Services
|
$22.39
|
-1.47
-6.16% |
$24.08
|
411,512
301.25% of 50 DAV
50 DAV is 136,600
|
$26.24
-14.67%
|
10/28/2011
|
$22.49
|
PP = $23.61
|
|
MB = $24.79
|
Most Recent Note - 1/10/2012 5:42:36 PM
G - Another damaging loss today violated its 50 DMA line and upward trendline triggering technical sell signals. Only a prompt rebound above that short-term average would help its outlook. Reported earnings +38% on +29% sales revenues for the quarter ended November 30, 2011 versus the year ago period.
>>> The latest Featured Stock Update with an annotated graph appeared on 1/6/2012. Click here.
View all notes |
Alert me of new notes |
CANSLIM.net Company Profile |
SEC |
Zacks Reports |
StockTalk |
News |
Chart |
Request a new note
C
A N
S L
I M
|
MKTX
-
NASDAQ
Marketaxess Holdings Inc
FINANCIAL SERVICES - Investment Brokerage - Nationa
|
$32.16
|
+0.45
1.42% |
$32.23
|
122,321
58.19% of 50 DAV
50 DAV is 210,200
|
$31.85
0.97%
|
10/28/2011
|
$29.79
|
PP = $31.05
|
|
MB = $32.60
|
Most Recent Note - 1/9/2012 2:03:37 PM
Y - Today's gain has it inching into new all-time high territory without truly great volume conviction. The 50 DMA line defines initial chart support to watch.
>>> The latest Featured Stock Update with an annotated graph appeared on 12/20/2011. Click here.
View all notes |
Alert me of new notes |
CANSLIM.net Company Profile |
SEC |
Zacks Reports |
StockTalk |
News |
Chart |
Request a new note
C
A N
S L
I M
|
OSIS
-
NASDAQ
O S I Systems Inc
ELECTRONICS - Semiconductor Equipment and Mate
|
$50.66
|
+0.25
0.50% |
$51.01
|
51,854
48.69% of 50 DAV
50 DAV is 106,500
|
$51.06
-0.78%
|
11/1/2011
|
$42.07
|
PP = $45.57
|
|
MB = $47.85
|
Most Recent Note - 1/9/2012 1:17:41 PM
G - Wedging higher again with today's 5th consecutive small gain, getting extended from its prior base. Its 50 DMA line and recent chart lows near $45 define important near-term support to watch.
>>> The latest Featured Stock Update with an annotated graph appeared on 12/27/2011. Click here.
View all notes |
Alert me of new notes |
CANSLIM.net Company Profile |
SEC |
Zacks Reports |
StockTalk |
News |
Chart |
Request a new note
C
A N
S L
I M
|
PRGO
-
NASDAQ
Perrigo Co
DRUGS - Drug Related Products
|
$99.58
|
+3.02
3.13% |
$100.38
|
1,455,938
105.40% of 50 DAV
50 DAV is 1,381,400
|
$104.70
-4.89%
|
12/9/2011
|
$99.54
|
PP = $101.56
|
|
MB = $106.64
|
Most Recent Note - 1/10/2012 2:39:47 PM
G - Gapped up today for a solid gain backed by higher volume, rallying toward previously stubborn resistance in the low $100s.
>>> The latest Featured Stock Update with an annotated graph appeared on 1/9/2012. Click here.
View all notes |
Alert me of new notes |
CANSLIM.net Company Profile |
SEC |
Zacks Reports |
StockTalk |
News |
Chart |
Request a new note
C
A N
S L
I M
|
RAX
-
NYSE
Rackspace Hosting Inc
INTERNET - Internet Software and; Services
|
$42.07
|
+0.36
0.86% |
$42.63
|
2,047,356
124.39% of 50 DAV
50 DAV is 1,645,900
|
$46.50
-9.52%
|
11/8/2011
|
$44.28
|
PP = $46.27
|
|
MB = $48.58
|
Most Recent Note - 1/10/2012 5:45:58 PM
G - Encountering resistance when trying to rebound back above its 50 DMA line, enduring distributional pressure after not making headway above its pivot point. Its 200 DMA line defines the next near-term support level to watch.
>>> The latest Featured Stock Update with an annotated graph appeared on 1/5/2012. Click here.
View all notes |
Alert me of new notes |
CANSLIM.net Company Profile |
SEC |
Zacks Reports |
StockTalk |
News |
Chart |
Request a new note
C
A N
S L
I M
|
Symbol/Exchange
Company Name
Industry Group |
PRICE |
CHANGE
(%Change) |
Day High |
Volume
(% DAV)
(% 50 day avg vol) |
52 Wk Hi
% From Hi |
Featured
Date |
Price
Featured |
Pivot Featured |
|
Max Buy |
SXCI
-
NASDAQ
S X C Health Solutions
COMPUTER SOFTWARE and SERVICES - Healthcare Information Service
|
$62.80
|
+4.36
7.46% |
$63.04
|
811,575
188.52% of 50 DAV
50 DAV is 430,500
|
$66.40
-5.42%
|
1/10/2012
|
$62.05
|
PP = $60.10
|
|
MB = $63.11
|
Most Recent Note - 1/10/2012 5:48:44 PM
Y - Finished strong today with a considerable volume-driven gain triggering a technical buy signal while clearing prior chart highs after an orderly base pattern. Color code was changed to yellow in the mid-day report (read here) with pivot point cited based on its 12/02/11 high plus 10 cents. It faces some overhead supply that may act as resistance while now perched within -5.4% of its all-time high. Ownership by top-rated funds has been increasing, rising from 453 in Jun '10 to 600 in Dec '11, a reassuring sign concerning the I criteria. Reported earnings +57% on +163% sales revenues for the quarter ended September 31, 2011 versus the year ago period. Strong prior quarters and good annual earnings history satisfy the C & A criteria.

There are no Featured Stock Updates™ available for this stock at this time. You may request one by clicking the Request a New Note link below
View all notes |
Alert me of new notes |
CANSLIM.net Company Profile |
SEC |
Zacks Reports |
StockTalk |
News |
Chart |
Request a new note
C
A N
S L
I M
|
TDG
-
NYSE
Transdigm Group Inc
AEROSPACE/DEFENSE - Aerospace/Defense Products and; Services
|
$98.70
|
+1.25
1.28% |
$99.43
|
195,103
54.99% of 50 DAV
50 DAV is 354,800
|
$102.73
-3.92%
|
1/10/2012
|
$98.83
|
PP = $102.83
|
|
MB = $107.97
|
Most Recent Note - 1/10/2012 5:49:48 PM
Y - Gain today on light volume for its best-ever close. No overhead supply remains to act as resistance. Color code was changed to yellow with new pivot point cited based on its 52-week high plus 10 cents. Volume driven gains for new highs may help it clear a base-on-base type pattern. Recent lows in the $90 area define the next nearby support level to watch above its 200 DMA line.
>>> The latest Featured Stock Update with an annotated graph appeared on 1/4/2012. Click here.
View all notes |
Alert me of new notes |
CANSLIM.net Company Profile |
SEC |
Zacks Reports |
StockTalk |
News |
Chart |
Request a new note
C
A N
S L
I M
|
V
-
NYSE
Visa Inc Cl A
DIVERSIFIED SERVICES - Business/Management Services
|
$99.80
|
-0.10
-0.10% |
$100.95
|
4,677,888
115.59% of 50 DAV
50 DAV is 4,047,100
|
$103.45
-3.53%
|
10/24/2011
|
$94.21
|
PP = $94.85
|
|
MB = $99.59
|
Most Recent Note - 1/10/2012 5:51:06 PM
G - Down today for a 4th loss in the span of 5 sessions, slumping near its "max buy" level. Prior highs in the $95 area and its 50 DMA line define chart support to watch on pullbacks.
>>> The latest Featured Stock Update with an annotated graph appeared on 12/15/2011. Click here.
View all notes |
Alert me of new notes |
CANSLIM.net Company Profile |
SEC |
Zacks Reports |
StockTalk |
News |
Chart |
Request a new note
C
A N
S L
I M
|
|
|
|
THESE ARE NOT BUY RECOMMENDATIONS!
Comments contained in the body of this report are technical
opinions only. The material herein has been obtained
from sources believed to be reliable and accurate, however,
its accuracy and completeness cannot be guaranteed.
This site is not an investment advisor, hence it does
not endorse or recommend any securities or other investments.
Any recommendation contained in this report may not
be suitable for all investors and it is not to be deemed
an offer or solicitation on our part with respect to
the purchase or sale of any securities. All trademarks,
service marks and trade names appearing in this report
are the property of their respective owners, and are
likewise used for identification purposes only.
This report is a service available
only to active Paid Premium Members.
You may opt-out of receiving report notifications
at any time. Questions or comments may be submitted
by writing to Premium Membership Services 665 S.E. 10 Street, Suite 201 Deerfield Beach, FL 33441-5634 or by calling 1-800-965-8307
or 954-785-1121.
|
|
|

