You are not logged in.
This means you
CAN ONLY VIEW reports that were published prior to Monday, April 14, 2025.
You
MUST UPGRADE YOUR MEMBERSHIP if you want to see any current reports.
AFTER MARKET UPDATE - WEDNESDAY, JANUARY 9TH, 2013
Previous After Market Report Next After Market Report >>>
|
|
|
|
DOW |
+61.66 |
13,390.51 |
+0.46% |
|
Volume |
671,656,850 |
-3% |
|
Volume |
1,689,691,170 |
+1% |
|
NASDAQ |
+14.00 |
3,105.81 |
+0.45% |
|
Advancers |
2,063 |
66% |
|
Advancers |
1,607 |
63% |
|
S&P 500 |
+3.87 |
1,461.02 |
+0.27% |
|
Decliners |
959 |
30% |
|
Decliners |
859 |
33% |
|
Russell 2000 |
+4.81 |
879.51 |
+0.55% |
|
52 Wk Highs |
291 |
|
|
52 Wk Highs |
139 |
|
|
S&P 600 |
+2.45 |
491.43 |
+0.50% |
|
52 Wk Lows |
6 |
|
|
52 Wk Lows |
4 |
|
|
 |
Breadth Positive and Leadership Expanded
Kenneth J. Gruneisen - Passed the CAN SLIM® Master's Exam
The major averages finished modestly higher at the closing bell, albeit off of their best levels of Wednesday's.session. The volume totals were reported mixed, slightly lower on the NYSE and higher on the Nasdaq exchange. Advancers led decliners by a 2-1 margin on the NYSE and nearly as well on the Nasdaq exchange. The total number of stocks hitting new 52-week highs expanded and easily outnumbered new 52-week lows on the NYSE and on the Nasdaq exchange. New lows remained in the single digits on both the NYSE and on the Nasdaq exchange. There were 108 high-ranked companies from the CANSLIM.net Leaders List making new 52-week highs and appearing on the CANSLIM.net BreakOuts Page, up from the prior session total of 73 stocks. Any sustainable rally requires a healthy crop of companies hitting new 52-week highs, so it remains encouraging to see solid leadership. There were gains for 8 of the 10 high-ranked companies currently included on the Featured Stocks Page.
Stocks snapped a two day losing streak on the heels of some positive corporate earnings reports. Seven of the 10 sectors on the S&P ended higher, led by gains in industrial stocks including Boeing Co (BA +3.55%). Biotech stocks also showed strength following some positive comments out of the JP Morgan Health Care Conference. Regeneron Pharmaceuticals, Inc (REGN +3.83%) and Alexion Pharmaceuticals Inc (ALXN +2.89%) rallied.
On the earnings front, Alcoa Inc (AA -0.22%) ended lower after trading higher for most of the session. In other news, Herbalife Ltd (HLF +4.17%) rallied following reports that activist investor Dan Loeb took an 8% stake in nutritional supplements company.
Turning to fixed income markets, Treasuries are modestly higher along the curve. The benchmark 10-year note was up 1/32 to yield 1.86% and the 30-year bond added 3/32 to yield 3.07%.
Investors may consider new buying efforts in stocks meeting all key criteria, as the market's (M criteria) confirmed uptrend showed a great expansion in leadership (stocks hitting new 52-week highs) after overcoming recent pressure. Solid gains helped the benchmark S&P 500 Index promptly rebound above its 50-day moving average (DMA) line, and Nasdaq Composite Index and Dow Jones Industrial Average both promptly rebounded above their respective 50 DMA and 200 DMA lines. All of the major averages then blasted above their December highs with additional volume-driven gains.
Watch for an announcement via email concerning the next WEBCAST. The webcast will also be available via an updated link highlighted at the top of the Premium Member Homepage.
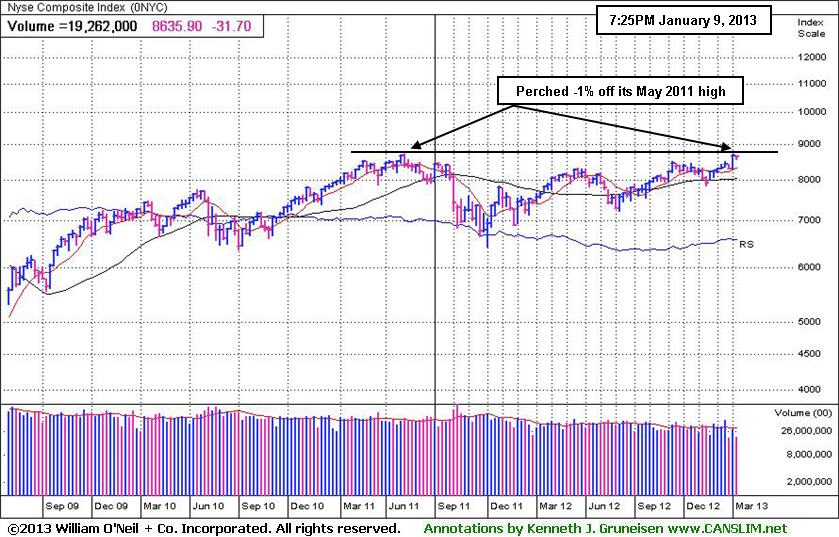
PICTURED: The NYSE Composite Index is currently perched -1% off its May 2011 high. The weekly graph shows no recent signs of distributional pressure, however it is at a likely point chart-wise for some consolidation to be expected. Meanwhile, any meaningful rally above the old high might be viewed as a bullish technical signal in the coming weeks.
|
 Kenneth J. Gruneisen started out as a licensed stockbroker in August 1987, a couple of months prior to the historic stock market crash that took the Dow Jones Industrial Average down -22.6% in a single day. He has published daily fact-based fundamental and technical analysis on high-ranked stocks online for two decades. Through FACTBASEDINVESTING.COM, Kenneth provides educational articles, news, market commentary, and other information regarding proven investment systems that work in good times and bad.
Comments contained in the body of this report are technical opinions only and are not necessarily those of Gruneisen Growth Corp. The material herein has been obtained from sources believed to be reliable and accurate, however, its accuracy and completeness cannot be guaranteed. Our firm, employees, and customers may effect transactions, including transactions contrary to any recommendation herein, or have positions in the securities mentioned herein or options with respect thereto. Any recommendation contained in this report may not be suitable for all investors and it is not to be deemed an offer or solicitation on our part with respect to the purchase or sale of any securities. |
|
 |
Tech Sector Helped Market Rise
Kenneth J. Gruneisen - Passed the CAN SLIM® Master's Exam
The tech sector helped the major averages rise on Wednesday as the Networking Index ($NWX +0.21%), Internet Index ($IIX +0.35%), Biotechnology Index ($BTK +0.90%), and the Semiconductor Index ($SOX +1.05%) ended unanimously higher. Meanwhile, influential financial shares were mixed as the Broker/Dealer Index ($XBD +0.60%) posted a modest gain and the Bank Index ($BKX -0.69%) tallied a similar sized loss. The Retail Index ($RLX -0.20%) also edged lower, limiting the major averages' ability to rally. Defensive groups were mixed as the Healthcare Index ($HMO +1.01%) rose but the Gold & Silver Index ($XAU -0.44%) ended with a small loss. Energy-related shares showed little decisiveness as the Oil Services Index ($OSX +0.27%) edged higher and the Integrated Oil Index ($XOI -0.05%) finished flat.
Charts courtesy www.stockcharts.com
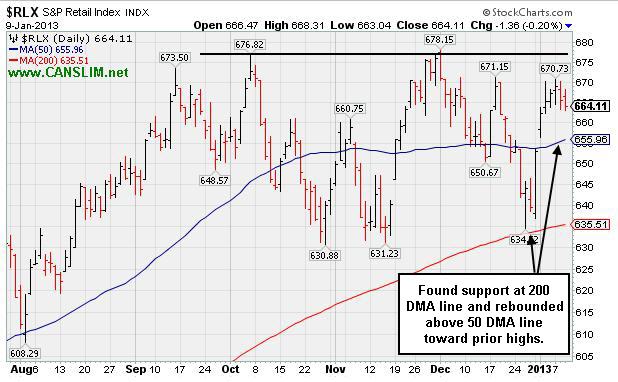
PICTURED: The Retail Index ($RLX -0.20%) found support above its long-term 200-day moving average (DMA) line and well above its prior lows, avoiding going off any technical cliff, then subsequently rebounded above its 50 DMA line toward prior highs.
| Oil Services |
$OSX |
229.46 |
+0.62 |
+0.27% |
+4.22% |
| Healthcare |
$HMO |
2,495.83 |
+25.07 |
+1.01% |
-0.73% |
| Integrated Oil |
$XOI |
1,268.78 |
-0.57 |
-0.05% |
+2.17% |
| Semiconductor |
$SOX |
395.47 |
+4.11 |
+1.05% |
+2.97% |
| Networking |
$NWX |
234.79 |
+0.48 |
+0.21% |
+3.64% |
| Internet |
$IIX |
336.03 |
+1.17 |
+0.35% |
+2.76% |
| Broker/Dealer |
$XBD |
97.73 |
+0.58 |
+0.60% |
+3.60% |
| Retail |
$RLX |
664.11 |
-1.36 |
+0.20% |
+2.44% |
| Gold & Silver |
$XAU |
159.84 |
-0.71 |
-0.44% |
-3.48% |
| Bank |
$BKX |
52.89 |
-0.37 |
-0.69% |
+3.14% |
| Biotech |
$BTK |
1,635.50 |
+14.52 |
+0.90% |
+5.72% |
|
|
|
 |
Extended From Base After 8 Session Winning Streak
Kenneth J. Gruneisen - Passed the CAN SLIM® Master's Exam
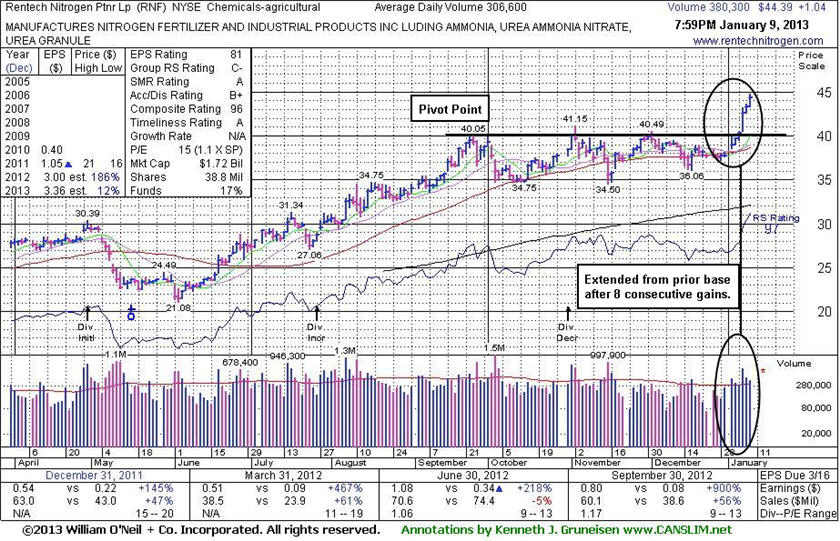
Rentech Nitrogen Ptnr LP (RNF +$1.04 or +2.40% to $44.39) hit another new 52-week high today with its 8th consecutive gain, getting extended from its prior base. Prior highs in the $40 area define initial support to watch on pullbacks. The number of top-rated funds owning its shares had fallen from 52 in Jun '12 to 36 as of Dec '12, a disconcerting sign concerning the I criteria. However, its current Up/Down Volume Ratio of 1.4 indicates a reassuring sign of institutional accumulation over the past 50 days.
Its last appearance in this FSU section was on 12/19/12 with an annotated graph under the headline, "Still Awaiting Volume-Driven Gain Above Pivot Point", as it improved its technical stance by rebounding above its 50-day moving average (DMA) line with a volume-driven gain. We noted at that time - "Disciplined investors may still be watching for volume-driven gains for a new high close to trigger a technical buy signal. Meanwhile, recent lows define chart support to watch where subsequent violations may raise serious concerns and trigger technical sell signals."
Its gain on 1/07/13 was backed by +144% above average volume, well above the minimum volume threshold of +40% above average volume needed to trigger a proper technical buy signal. It quickly got extended from prior highs. If one was willing to chase it +5% above its prior high of $41.15 then $43.21 would be the highest one might consider the stock buyable without being too extended from its prior base. Repeating a point emphasized in yesterday's FSU section - "Disciplined investors avoid chasing extended stocks more than +5% above their pivot point. Making sloppy buy decisions by chasing extended stocks invites a much greater chance that an ordinary consolidation might prompt investors to invoke the investment system's strict loss-limiting sell rule after a pullback of -7% or more from their purchase price."
|
|
|
Color Codes Explained :
Y - Better candidates highlighted by our
staff of experts.
G - Previously featured
in past reports as yellow but may no longer be buyable under the
guidelines.
***Last / Change / Volume data in this table is the closing quote data***
Symbol/Exchange
Company Name
Industry Group |
PRICE |
CHANGE
(%Change) |
Day High |
Volume
(% DAV)
(% 50 day avg vol) |
52 Wk Hi
% From Hi |
Featured
Date |
Price
Featured |
Pivot Featured |
|
Max Buy |
CELG
-
NASDAQ
Celgene Corp
DRUGS - Drug Manufacturers - Major
|
$92.34
|
+0.93
1.02% |
$93.13
|
6,272,695
198.15% of 50 DAV
50 DAV is 3,165,700
|
$91.52
0.90%
|
12/11/2012
|
$82.24
|
PP = $81.34
|
|
MB = $85.41
|
 Most Recent Note - 1/9/2013 12:00:45 PM
G - On track for a 7th consecutive gain today with ever-increasing volume, getting very extended from its prior base. Raised its guidance and rallied well above its "max buy" level with heavy volume while adding to its streak of consecutive gains. Prior highs near $81-82 define initial support to watch on pullbacks.
>>> The latest Featured Stock Update with an annotated graph appeared on 1/3/2013. Click here.
View all notes |
Alert me of new notes |
CANSLIM.net Company Profile |
SEC |
Zacks Reports |
StockTalk |
News |
Chart |
Request a new note
C
A N
S L
I M


|
CFNL
-
NASDAQ
Cardinal Financial Corp
BANKING - Regional - Southeast Banks
|
$16.48
|
-0.19
-1.14% |
$16.84
|
260,853
117.24% of 50 DAV
50 DAV is 222,500
|
$16.90
-2.49%
|
12/3/2012
|
$15.20
|
PP = $16.31
|
|
MB = $17.13
|
Most Recent Note - 1/8/2013 2:33:49 PM
Y - Poised for a best-ever close with above average volume behind today's gain, yet still trading below its "max buy" level. Hit a new 52-week high and cleared its pivot point on 1/02/13 with sufficient volume to trigger a proper new (or add-on) technical buy signal.
>>> The latest Featured Stock Update with an annotated graph appeared on 12/31/2012. Click here.
View all notes |
Alert me of new notes |
CANSLIM.net Company Profile |
SEC |
Zacks Reports |
StockTalk |
News |
Chart |
Request a new note
C
A N
S L
I M
|
CMCSA
-
NASDAQ
Comcast Corp Cl A
MEDIA - CATV Systems
|
$38.42
|
+0.26
0.68% |
$38.55
|
9,813,946
81.96% of 50 DAV
50 DAV is 11,973,800
|
$38.58
-0.41%
|
12/3/2012
|
$37.08
|
PP = $38.06
|
|
MB = $39.96
|
Most Recent Note - 1/8/2013 2:36:18 PM
Y - It stalled and has been hovering near its 52-week high since its gain above its pivot point on 1/02/12 had sufficient volume to trigger a technical buy signal. No resistance remains due to overhead supply.
>>> The latest Featured Stock Update with an annotated graph appeared on 12/27/2012. Click here.
View all notes |
Alert me of new notes |
CANSLIM.net Company Profile |
SEC |
Zacks Reports |
StockTalk |
News |
Chart |
Request a new note
C
A N
S L
I M
|
LULU
-
NASDAQ
Lululemon Athletica
MANUFACTURING - Textile Manufacturing
|
$71.04
|
-0.59
-0.82% |
$72.84
|
1,543,400
77.28% of 50 DAV
50 DAV is 1,997,100
|
$81.09
-12.39%
|
12/26/2012
|
$73.81
|
PP = $77.95
|
|
MB = $81.85
|
Most Recent Note - 1/8/2013 2:41:18 PM
G - Holding its ground today near its 50 DMA line and trading -12.1% off its 52-week high. Distributional losses on above average volume raised concerns following a "negative reversal" on 1/02/13. Disciplined investors waited to take any action after it was recently noted - "Subsequent volume-driven gains above its pivot point are still needed to trigger a new technical buy signal."
>>> The latest Featured Stock Update with an annotated graph appeared on 12/28/2012. Click here.
View all notes |
Alert me of new notes |
CANSLIM.net Company Profile |
SEC |
Zacks Reports |
StockTalk |
News |
Chart |
Request a new note
C
A N
S L
I M
|
MIDD
-
NASDAQ
Middleby Corp
MANUFACTURING - Diversified Machinery
|
$131.84
|
+0.05
0.04% |
$132.70
|
94,303
106.32% of 50 DAV
50 DAV is 88,700
|
$134.51
-1.98%
|
10/8/2012
|
$118.46
|
PP = $122.67
|
|
MB = $128.80
|
Most Recent Note - 1/8/2013 2:43:21 PM
G - Holding its ground stubbornly near its 52-week and all-time highs with recent volume totals below average. Earnings +23% on +18% sales for the Sep '12 quarter, below the +25% minimum earnings guideline (C criteria), raised concerns.
>>> The latest Featured Stock Update with an annotated graph appeared on 12/26/2012. Click here.
View all notes |
Alert me of new notes |
CANSLIM.net Company Profile |
SEC |
Zacks Reports |
StockTalk |
News |
Chart |
Request a new note
C
A N
S L
I M
|
Symbol/Exchange
Company Name
Industry Group |
PRICE |
CHANGE
(%Change) |
Day High |
Volume
(% DAV)
(% 50 day avg vol) |
52 Wk Hi
% From Hi |
Featured
Date |
Price
Featured |
Pivot Featured |
|
Max Buy |
N
-
NYSE
Netsuite Inc
DIVERSIFIED SERVICES - Business/Management Services
|
$70.35
|
+2.32
3.41% |
$70.58
|
380,275
89.31% of 50 DAV
50 DAV is 425,800
|
$70.06
0.41%
|
12/12/2012
|
$64.75
|
PP = $67.12
|
|
MB = $70.48
|
Most Recent Note - 1/9/2013 5:43:06 PM
Y - Gains above its pivot point have been marked by below average volume. Disciplined investors know that volume must be at least +40% above average behind gains above the pivot point to trigger a proper technical buy signal.
>>> The latest Featured Stock Update with an annotated graph appeared on 1/4/2013. Click here.
View all notes |
Alert me of new notes |
CANSLIM.net Company Profile |
SEC |
Zacks Reports |
StockTalk |
News |
Chart |
Request a new note
C
A N
S L
I M
|
NSR
-
NYSE
Neustar Inc
TELECOMMUNICATIONS - Diversified Communication Serv
|
$42.89
|
+0.23
0.54% |
$43.05
|
562,720
138.26% of 50 DAV
50 DAV is 407,000
|
$43.90
-2.30%
|
12/11/2012
|
$41.85
|
PP = $41.41
|
|
MB = $43.48
|
Most Recent Note - 1/8/2013 2:45:22 PM
Y - Quietly consolidating just below its "max buy" level and its color code is changed to yellow. Subsequent deterioration below its old high close ($41.05 on 10/05/12) could negate its recent breakout, a worrisome sign.
>>> The latest Featured Stock Update with an annotated graph appeared on 1/2/2013. Click here.
View all notes |
Alert me of new notes |
CANSLIM.net Company Profile |
SEC |
Zacks Reports |
StockTalk |
News |
Chart |
Request a new note
C
A N
S L
I M
|
RAX
-
NYSE
Rackspace Hosting Inc
INTERNET - Internet Software and; Services
|
$77.75
|
+0.23
0.30% |
$78.22
|
828,098
57.32% of 50 DAV
50 DAV is 1,444,600
|
$77.52
0.30%
|
12/18/2012
|
$71.88
|
PP = $70.10
|
|
MB = $73.61
|
Most Recent Note - 1/8/2013 2:46:54 PM
G - Inching to another new all-time high with today's gain lacking great volume conviction. Getting extended from its prior base, meanwhile prior highs in the $70 area define initial support to watch.
>>> The latest Featured Stock Update with an annotated graph appeared on 1/8/2013. Click here.
View all notes |
Alert me of new notes |
CANSLIM.net Company Profile |
SEC |
Zacks Reports |
StockTalk |
News |
Chart |
Request a new note
C
A N
S L
I M
|
RNF
-
NYSE
Rentech Nitrogen Ptnr Lp
CHEMICALS - Agricultural Chemicals
|
$44.39
|
+1.04
2.40% |
$44.73
|
380,415
124.08% of 50 DAV
50 DAV is 306,600
|
$43.59
1.84%
|
11/1/2012
|
$39.11
|
PP = $40.15
|
|
MB = $42.16
|
Most Recent Note - 1/9/2013 8:25:50 PM
G - Extended from a sound base after 8 consecutive gains. Prior highs in the $40 area define initial support to watch on pullbacks. See latest FSU analysis for more details and a new annotated graph.
>>> The latest Featured Stock Update with an annotated graph appeared on 1/9/2013. Click here.
View all notes |
Alert me of new notes |
CANSLIM.net Company Profile |
SEC |
Zacks Reports |
StockTalk |
News |
Chart |
Request a new note
C
A N
S L
I M
|
VRX
-
NYSE
Valeant Pharmaceuticals
DRUGS - Drug Manufacturers - Other
|
$63.82
|
+1.53
2.46% |
$63.92
|
1,605,180
104.02% of 50 DAV
50 DAV is 1,543,200
|
$62.46
2.18%
|
12/20/2012
|
$60.24
|
PP = $61.21
|
|
MB = $64.27
|
Most Recent Note - 1/9/2013 8:27:07 PM
Y - Rallied further above its pivot point to another new 52-week high today , however volume thus far is below the +40% above average volume guideline which is the bare minimum threshold needed to trigger a proper technical buy signal. Disciplined investors may use a tactic called "pyramiding" to allow market action to dictate their positioning.
>>> The latest Featured Stock Update with an annotated graph appeared on 12/20/2012. Click here.
View all notes |
Alert me of new notes |
CANSLIM.net Company Profile |
SEC |
Zacks Reports |
StockTalk |
News |
Chart |
Request a new note
C
A N
S L
I M
|
Symbol/Exchange
Company Name
Industry Group |
PRICE |
CHANGE
(%Change) |
Day High |
Volume
(% DAV)
(% 50 day avg vol) |
52 Wk Hi
% From Hi |
Featured
Date |
Price
Featured |
Pivot Featured |
|
Max Buy |
|
|
|
THESE ARE NOT BUY RECOMMENDATIONS!
Comments contained in the body of this report are technical
opinions only. The material herein has been obtained
from sources believed to be reliable and accurate, however,
its accuracy and completeness cannot be guaranteed.
This site is not an investment advisor, hence it does
not endorse or recommend any securities or other investments.
Any recommendation contained in this report may not
be suitable for all investors and it is not to be deemed
an offer or solicitation on our part with respect to
the purchase or sale of any securities. All trademarks,
service marks and trade names appearing in this report
are the property of their respective owners, and are
likewise used for identification purposes only.
This report is a service available
only to active Paid Premium Members.
You may opt-out of receiving report notifications
at any time. Questions or comments may be submitted
by writing to Premium Membership Services 665 S.E. 10 Street, Suite 201 Deerfield Beach, FL 33441-5634 or by calling 1-800-965-8307
or 954-785-1121.
|
|
|

